Let to Birmingham: 2016 case study report
MULLINS, David, SACRANIE, Halima and PATTISON, Ben
<http://orcid.org/0000-0002-3672-0849>
Available from Sheffield Hallam University Research Archive (SHURA) at:
http://shura.shu.ac.uk/15741/
This document is the author deposited version. You are advised to consult the
publisher's version if you wish to cite from it.
Published version
MULLINS, David, SACRANIE, Halima and PATTISON, Ben (2017). Let to
Birmingham: 2016 case study report. Project Report. Birmingham, University of
Birmingham.
Copyright and re-use policy
See
http://shura.shu.ac.uk/information.html
LET TO BIRMINGHAM
2016 CASE STUDY REPORT
David Mullins and Halima Sacranie
with Ben Pattison
1
Contents
Glossary... 4
Acknowledgements ... 6
1. Introduction and Background ... 7
2. Data Analysis ... 10
2.0 Introduction ... 10
2.1 Wider Trends in the use of Private Rentals for lower income households in Great Britain. 10 2.2 Trends in Housing Benefit claimants in Birmingham ... 11
2.2.1 LHA claimants in Birmingham ... 13
2.2.2 The distribution of LHA claimants in Birmingham in 2011 ... 14
2.2.3 Changes in Distribution of LHA Claimants 2011-16 ... 16
2.2.4 Private sector rents and the LHA rate in Birmingham ... 18
2.3 Let to Birmingham Lettings Analysis 2014-16 ... 19
2.3.1 Background ... 19
2.3.2 Properties sourced ... 19
2.3.3 Tenant Profile ... 24
2.4 Conclusions: Comparing Let to Birmingham to the LHA market ... 27
3. Tenant Experience of Let to Birmingham ... 28
3.0 Aims and Methods ... 28
3.1 Tenant Experience ... 30
3.1.1 Access Group ... 30
3.1.2 Household types ... 31
3.1.3 Tenant motivations ... 32
3.1.4 What are the barriers to tenants letting through Let to Birmingham? ... 33
3.1.5 What enables tenants to secure lettings through Let to Birmingham? ... 34
3.1.6 Tenant comparisons of LtB with social housing and PRS ... 34
3.1.7 Does Let to Birmingham provide comparable benefits to tenants to social housing? 35 3.1.8 Conclusion ... 39
4. Landlord Experience and Motivations ... 40
4.0 Aims and Methods ... 40
4.1 Types of Landlord ... 41
4.2 Motivations ... 43
4.3 Barriers ... 45
2
4.5 Conclusion ... 48
5. Process and Policy ... 50
5.0 Introduction ... 50
5.1 Process Issues ... 50
5.2 Policy Issues ... 52
6. Conclusions and Recommendations ... 54
6.0 Introduction ... 54
6.1 Data Analysis ... 54
6.2 Tenant Experience ... 55
6.3 Landlord Experience ... 56
6.4 Policy and Practice Learning ... 57
6.5 Recommendations ... 59
6.5.1 Recommendations to LtB ... 59
6.5.2 Recommendations to Birmingham City Council Homelessness Hub ... 61
6.5.3 Recommendations to Birmingham City Council Commissioning Centre... 62
Bibliography ... 64
Figures and Tables Figure 2.1 Number of Housing Benefit claimants in the private rented sector, Great Britain, November 2008 to February 2016 10 Figure 2.2: Number of Housing Benefit claimants in employment (not on passported benefits), private rented sector, Great Britain, November 2008 to February 2016 11 Figure 2.3: Number of Housing Benefit claimants in the private rented sector, Birmingham, January 2011 to February 2016 12
Figure 2.4: Number of Housing Benefit claimants in employment (not on passported benefits), private rented sector, Birmingham, January 2011 to February 2016 12 Figure 2.5: Size of property for LHA claimants, Birmingham, April 2016 13
Figure 2.6: Household size, LHA claimants, Birmingham, April 2016 14 Figure 2.7: Housing Benefit claimants as percentage of households renting from a private landlord, 2011 15
3
4
Glossary
This research explores a number of little known aspects of housing and welfare support provision related to Private Rented Housing. Readers may find this short summary of some of the more technical terms useful to have to hand when reading the report. Some of the most obscure of these turned out to be significant in understanding the scope for and limits to Social Lettings Agencies.
AST Assured Shorthold Tenancy – standard 12 month tenancy term for new PRS tenancies used by most SLAs. Shorter introductory tenancies of 6 months may also be used and accounted for one in five of Let to Birmingham lettings in 2016.
HALD Housing Association Leasing Direct scheme. This covers properties leased from private landlords by registered providers (RPs) and allows a level of housing benefit subsidy above LHA to be claimed (currently 90% of LHA plus £60 a week outside London). Under HALD the RP is responsible for all costs relating to the procurement, management and maintenance of the property including repairs and dilapidations, lettings and voids. 80% of the properties let by Let to Birmingham in the first three years were under the HALD scheme.
DHP Discretionary Housing Payments. Small fund available to local authorities that can be used to help tenants with deposits or to prevent loss of tenancies
HCA Homes and Communities Agency – funding and regulatory body for social and affordable housing in England at the time of this study. Registers and regulates housing providers. Now Known as Homes England but HCA used throughout report.
LHA Local Housing Allowance sets the maximum amount of housing benefit that may be claimed by tenants within a Broad Rental Market Area. While LHA levels are theoretically set to include the bottom three deciles of rents in an area, they do not map against actual market rent levels and have not been updated since 2011. In Birmingham an analysis by the local authority found that only 8% of local market rents would be accessible to clients depending on LHA alone to cover their rent.
LtB Let to Birmingham – the social lettings agency established by Birmingham City Council with a private company, Omega Lettings, from January 2014. Omega and LtB are now subsidiaries of Mears.
PRS Private rented sector. Major and growing tenure of particular importance for younger households, including those unable to access home ownership or social housi g. Ge e atio e t efe s to the growing proportion of all under 35s living in the PRS in England (up from 28% in 2001 to nearly 50% in 2011 and continuing to grow).
5
RP Registered Provider. Housing body registered with HCA. These include non-profit housing associations and for profit providers such as Omega Lettings who won the SLA contract in Birmingham. Being and RP enables eligibility for HALD.
SEA Supported Exempt Accommodation (SEA). SEA providers are eligible for housing benefit at above LHA level. SEA providers may include Upper-tier County Council, housing association, egiste ed ha it o olu ta o ga isatio s where the body providing the accommodation, or a person acting on its behalf, also provides the
lai a t ith a e, suppo t o supe isio . “upe isio must not be a trifling amount and must be made use of by the claimant. U de the Housi g Be efit a d U i e sal C edit “uppo ted Housi g A e d e t ‘egulatio s “EA sits outside of UC and is exempt from bedroom tax and benefit caps, The future of supported exempt accommodation one of the main issues to be addressed by the 2017 Green Paper on transfer of exempt accommodation and supported housing funding to local authorities 2019. . SEA was the main form of subsidy used by the two third sector SLAs in our case studies that provided shared accommodation for single homeless. SEA rents of up to £200 a week compared to the median shared accommodation LHA claim of £258.41 a month in Birmingham.
SLA Social Lettings Agency. The focus of this research. Defined by Evans (2105) as age ies that help people access the PRS who are homeless or on low-i o es .
SP Supporting People. Funding available through local authorities for housing related suppo t osts. Floati g suppo t an sometimes cover support for households placed in private rented accommodation. However, availability has declined dramatically in recent years as the budget is no longer ring fenced.
VIP Let to Bi i gha s VIP la dlo ds a e those ho pla e a po tfolio of p ope ties ith
the SLA and receive a high level of service.
6
Acknowledgements
Thanks to Rashid Ikram at Birmingham City Council for providing invaluable support throughout as Project Lead Client and to staff at Let to Birmingham and Birmingham City Council for responding to our requests for information and assistance with the research.
Thanks to Dr Ben Pattison of Sheffield Hallam University for data analysis feeding into Chapter 2, to Reelika Riepulk for research assistance in sampling and setting up interviews for Chapter 3.
Thanks to Dr Ricky Joseph and Mirela Luca Nechita for undertaking earlier research in 2015 as part of the first wave of study of Let to Birmingham and to Webb Memorial Trust for part support of that earlier study.
Finally, thanks to the West Midlands Housing Officers Group for contributing to the costs of the project and providing expert advice through our Project Advisory Group and to Vicki Popplewell for managing the overall project.
David Mullins and Halima Sacranie, Housing and Communities Research Group
7
1.
Introduction and Background
Social Lettings Agencies (SLAs) have been described succinctly by Shelter Scotland (Evans, 2015) as age ies that help people access the PRS who are homeless or on low-incomes . “LA is a ge e al term applied to schemes that secure access to decent, affordable private rental accommodation for households in need and on low incomes who would previously have been likely to access social housing. The growth of SLAs has been a consequence of the falling supply of social housing, growth i the p i ate e ted se to , e pa sio of housi g optio s app oa hes si e the Ho eless ess A t 2002 and discharge of homeless duties in the private rented sector since the Localism Act 2011.
The West Midlands Housing Officers Group has supported this project by the Housing and
Communities Research Group at the University of Birmingham to explore the current and potential future role of SLAs in the region. Its relevance to current policy has increased considerably since the time of its commissioning.
This epo t o e s the se o d a e of esea h o Let to Bi ingham undertaken in Autumn 2016. It supplements our earlier report in Autumn 2015 which covered the background to the
establishment of Let to Birmingham in January 2014 as a social lettings agency by Birmingham City Council in partnership with Omega Lettings (now a division of Mears) and the first 18 months of its operation (Mullins, Joseph and Nechita 2015).
The 2015 case study had covered the set up and first 20 months of LtB based on interviews with council and LtB staff and a small number of tenant (3) and landlord (2) interviews. It identified the reasons for procuring the SLA from Omega, a leading PRS agent for London Boroughs, and for setting up LtB as a partnership with majority council representation on the local board. It also highlighted the appointment of an experienced Birmingham City Council officer as the first manager of LtB. It reviewed the arrangements put in place to ensure the quality of accommodation and management, the bond scheme and the avoidance of tenant deposits.
8
It showed that despite being stimulated by the discharge of duties under the Localism Act, LtB had not been used for statutory homeless clients because the council had not agreed to implement that provision of the Localism Act.
Competition with other statutory agencies seeking similar sources of housing for their clients and changes to the policy environment were identified as potential barriers to the expansion of the scheme.
The importance of the start-up funding from a DCLG prevention grant and an underpinning of ongoing viability by the HALD scheme allowing rents above LHA levels to be charged were already emerging as distinctive features of LtB which may limit its replicability to other authorities.
In this report we update the earlier analysis of procurement and letting of rented properties by Let to Birmingham, which had a stock of 400 private rented homes in management across the City by the end of 2016. We set this analysis in the context of wider trends in the use of private lettings to house lower income households in England and Birmingham. We fill a gap in the literature on the operation of social lettings agencies in England by analysing the experience of landlords and tenants drawing on 22 semi-structured interviews (15 with tenants and 7 with landlords) undertaken in Autumn 2016. We complete our analysis by reviewing the learning that can be drawn on policy and process based on the data set out above and interviews with officers at Let to Birmingham and at Birmingham City Council about the operation of the scheme.
This report is one of three published in March 2017 by the Housing and Communities Research Group at the University of Birmingham with support from the West Midlands Housing Officers Group. The purpose is to explore the current and potential future role of SLAs to address the needs of low income households seeking decent, secure and affordable rented homes in the Midlands.
9
MARCH 2017 – PROJECT FINAL REPORTS
REPORT 1 – SOCIAL LETTINGS AGENCIES IN THE WEST MIDLANDS: PEER LEARNING EVENTS, CASE STUDIES, REGIONAL CONTEXT & POLICY RECOMMENDATIONS
REPORT 2 - LET TO BIRMINGHAM 2016 CASE STUDY REPORT (This report)
REPORT 3 - WEST MIDLANDS SOCIAL LETTING AGENCIES RESEARCH PROJECT: LITERATURE REVIEW AND TYPOLOGY
10
2.
Data Analysis
2.0
Introduction
This chapter begins by providing an overview of recent trends in the use of private rentals for lower income households in Great Britain and in Birmingham. It then presents an analysis of lettings by Let to Birmingham over the first three years of its operations (2014-2016). The final section of the chapter shows the role Let to Birmingham is playing in the wider market by comparing tenant and property profiles between the Let to Birmingham portfolio and the overall private rental stock in the city.
2.1
Wider Trends in the use of Private Rentals for lower income
households in Great Britain
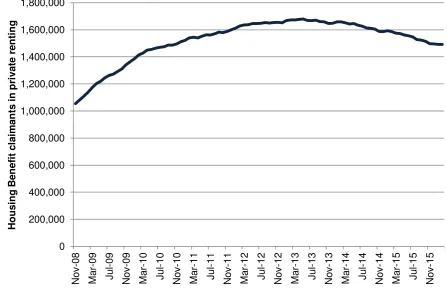
[image:12.595.78.526.438.739.2]In order to understand the changes in Housing Benefit claimants in Birmingham it is necessary to briefly reflect on the national picture. Figure 2.1 highlights the trends in the number of households claiming Housing Benefit within the private rented sector. This group increased rapidly reaching a peak of 1.68 million in May 2013 then declined to just less than 1.5 million claimants in early 2016.1 Figure 2.1: Number of Housing Benefit claimants in the private rented sector, Great Britain,
November 2008 to February 20162
1
This decline may be associated with claimants transferring to Universal Credit. 2
11
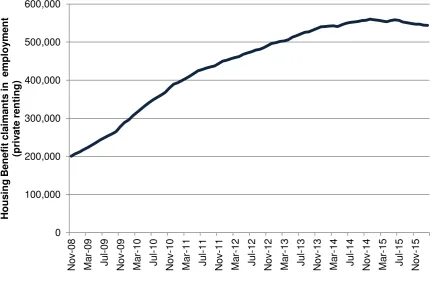
[image:13.595.81.518.248.539.2]Within these increases there have also been important changes in the type of households claiming Housing Benefit in the private rented sector. One of the most important changes is the rapid growth in the number of claimants who are in employment. This group increased from around 200,000 claimants in November 2008 to 560,000 claimants in just four years (see Figure 2.2). The average cost of Housing Benefit awards has increased in recent years. In November 2008 the average weekly claim within the private rented sector was £100.35. This increased to £111.76 in April 2011 before a decline to £105.22 in December 2012. The average cost of awards has steadily increased since this point to £109.71 in February 2016.
Figure 2.2: Number of Housing Benefit claimants in employment (not on passported benefits), private rented sector, Great Britain, November 2008 to February 20163
2.2
Trends in Housing Benefit claimants in Birmingham
Local level statistics for Housing Benefit claimants are available for the last five years from January 2011. During this period the number of Housing Benefit claimants in the private rented sector in Birmingham has been largely stable (see Figure 2.3). There was a slight increase from 32,900 claimants in January 2011 to a peak of 35,500 in March 2012. Since this point there has been a gradual decline to 31,800 in January 2016.
3
12
Figure 2.3: Number of Housing Benefit claimants in the private rented sector, Birmingham, January 2011 to February 20164
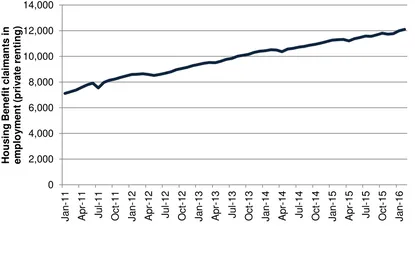
The relative stability of overall claimant numbers in Birmingham masks a number of notable changes in their characteristics. Figure 2.4 highlights a rapid increase in the number of in-work claimants. This group increased from 7,100 in January 2011 to 12,100 in February 2016.
Figure 2.4: Number of Housing Benefit claimants in employment (not on passported benefits), private rented sector, Birmingham, January 2011 to February 20165
4
Data from DWP STATXplore, accessed August 2016 5
[image:14.595.74.489.454.707.2]13
There were also changes in the age of claimants with a particularly large decline in Under 25s following reductions to benefit entitlements for under 25s in the 2015 summer budget. The stated
atio ale fo these ha ges as to ensure that young people in the benefits systems face the same choi es as ou g people ho a e i o k a d ho a ot e a le to affo d to lea e ho e (Wilson, 2015). In contrast middle aged claimants (aged 45 to 59) were the groups who increased most rapidly during this period.
2.2.1 LHA claimants in Birmingham
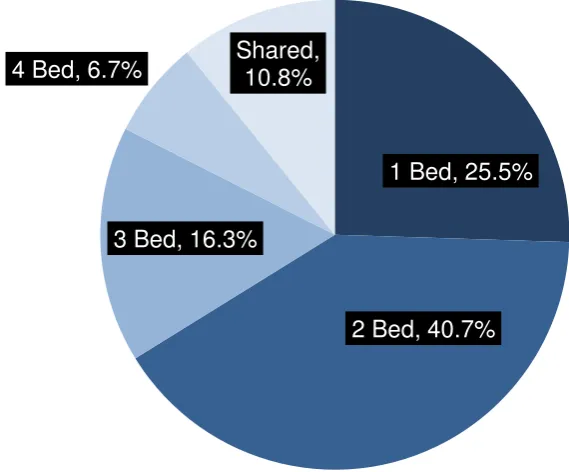
[image:15.595.130.415.388.624.2]More details on these trends can be found by analysing individual level data on Local Housing Allowance (LHA) claimants in Birmingham. Figure 2.5 shows the size of property occupied by LHA claimants in Birmingham in 2016. One and two bed properties account for two thirds of claimants within the city. This can be compared to the size of properties occupied by LHA claimants in April 2011. At this time shared rooms accounted for 18% of properties but had declined to 11% by 2016. This is likely to be associated with the decline in the number of Under 25s highlighted in the previous section.
Figure 2.5: Size of property for LHA claimants, Birmingham, April 20166
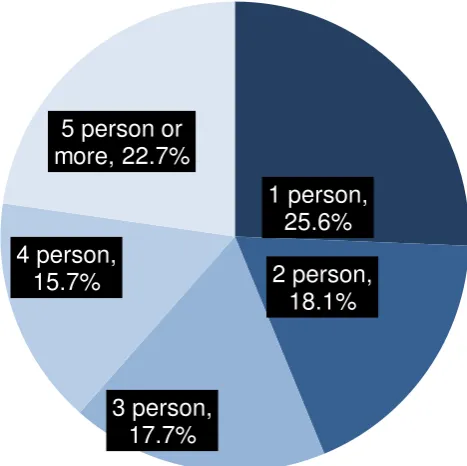
The changing profile of claimants can also be seen in household size. Figure 2.6 shows the household size for LHA claimants in Birmingham in April 2016. Small households are most common with almost half of claimants being one or two person households. However, there is evidence of increases in larger household sizes since 2011. The proportion of one person households declined from 40% in April 2011 to 26% in April 2016.
6 Author’s calculations based on Single Housing Benefit Extract
1 Bed, 25.5%
2 Bed, 40.7%
3 Bed, 16.3%
14
Figure 2.6: Household size, LHA claimants, Birmingham, April 20167
2.2.2 The distribution of LHA claimants in Birmingham in 2011
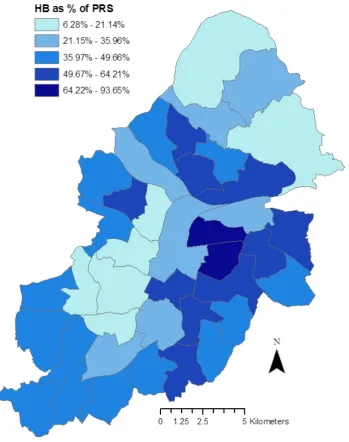
The spatial distribution of households within the private rented sector in Birmingham who were claiming Housing Benefit is shown in Figure 2.7. Combining postcode data on Housing Benefit claimants with data from the 2011 census on tenure provides an indication of the proportion of private renters who are claiming Housing Benefit in each ward.
In 2011 there was considerable variation in the proportion of Housing Benefit claimants across the city. The highest rates of Housing Benefit as a proportion of all private renters were found in Washwood Heath (94%) and Bordesley Green (92%). These adjacent wards situated to the East of the city had unusually high levels of claimants. The next highest proportion of Housing Benefit claimants was 64% of private renters in Kingstanding. Other areas with high proportions of Housing Benefit claimants were situated on the Eastern and Northern fringes of the city centre. At the other end of the spectrum Housing Benefit claimants made up only a small proportion of private renters in some wards within the city. The lowest levels were found in Ladywood (6%) and Selly Oak (11%) situated on the South Western fringe of the city centre.
7
Authors calculations based on Single Housing Benefit Extract
1 person,
25.6%
2 person,
18.1%
3 person,
17.7%
4 person,
15.7%
15
Figure 2.7: Housing Benefit claimants as percentage of households renting from a private landlord, 20118
The distribution of Housing Benefit claimants is likely to be linked to the characteristics of these wards - particularly their socio-economic profile and available housing stock. Wards with low
proportions of housing benefit claimants tended to be those which were dominated by students and young professionals. The housing stock available in these areas was dominated by Houses in
Multiple Occupation (HMOs), particularly Selly Oak, and purpose-built flats (e.g. Ladywood). Wards with higher levels of Housing Benefit claimants within the private rented sector were characterised by availability of terraced accommodation. This type of accommodation fits with the type of households claiming Housing Benefit in 2011 (e.g. small household size in 2/3 bed properties).
16
Wards such as Bordesley Green were characterised by highly diverse populations with low levels of income. These wards appeared to be acting as 'escalator areas' which provide relatively easy access to lower cost accommodation for a range of different groups including Housing Benefit claimants.9
2.2.3 Changes in Distribution of LHA Claimants 2011-16
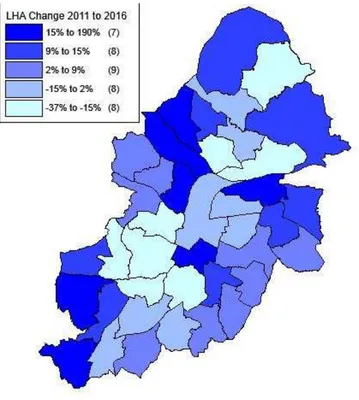
[image:18.595.78.437.232.632.2]Housing Benefit data from 2016 highlights the changing geography of claimants across the city. Figure 2.8 maps the changes that occurred between 2011 and 2016.
Figure 2.8: Local Housing Allowance claimants change, 2011 to 2016
Between 2011 and 2016 there was a 4% increase in claimants within Birmingham but these were not spread evenly (Table 2.1 shows the absolute numbers and percentage changes for each ward
between 2011 and 2016).
9
17
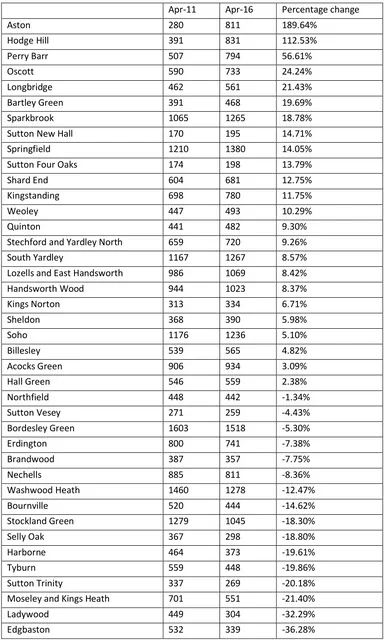
Table 2.1: Changing distribution of LHA claimants, April 2011 to April 2016
Apr-11 Apr-16 Percentage change
Aston 280 811 189.64%
Hodge Hill 391 831 112.53%
Perry Barr 507 794 56.61%
Oscott 590 733 24.24%
Longbridge 462 561 21.43%
Bartley Green 391 468 19.69%
Sparkbrook 1065 1265 18.78%
Sutton New Hall 170 195 14.71%
Springfield 1210 1380 14.05%
Sutton Four Oaks 174 198 13.79%
Shard End 604 681 12.75%
Kingstanding 698 780 11.75%
Weoley 447 493 10.29%
Quinton 441 482 9.30%
Stechford and Yardley North 659 720 9.26%
South Yardley 1167 1267 8.57%
Lozells and East Handsworth 986 1069 8.42%
Handsworth Wood 944 1023 8.37%
Kings Norton 313 334 6.71%
Sheldon 368 390 5.98%
Soho 1176 1236 5.10%
Billesley 539 565 4.82%
Acocks Green 906 934 3.09%
Hall Green 546 559 2.38%
Northfield 448 442 -1.34%
Sutton Vesey 271 259 -4.43%
Bordesley Green 1603 1518 -5.30%
Erdington 800 741 -7.38%
Brandwood 387 357 -7.75%
Nechells 885 811 -8.36%
Washwood Heath 1460 1278 -12.47%
Bournville 520 444 -14.62%
Stockland Green 1279 1045 -18.30%
Selly Oak 367 298 -18.80%
Harborne 464 373 -19.61%
Tyburn 559 448 -19.86%
Sutton Trinity 337 269 -20.18%
Moseley and Kings Heath 701 551 -21.40%
Ladywood 449 304 -32.29%
18
From Figure 2.7 and Table 2.1 it can be seen that several wards experienced rapid increases in the number of claimants during this period. The number of claimants in Aston and Hodge Hill more than doubled between 2011 and 2016. Areas which had the highest proportion of claimants in 2011 saw a slight decline over the following five years. The number of claimants in Washwood Heath and
Bordesley Green declined by 12% and 5% respectively.
Several wards experienced a notable decline the number of claimants. These tended to be wards such as Edgbaston (-36%) and Ladywood (-32%) which had a low percentage of Housing Benefit claimants in 2011.
In general terms it the distribution of claimants appears to have spread more widely across the city, particularly to the North and Western fringes of the city centre. It is likely that these trends are associated with the changing profile of Housing Benefit claimants during this period. The decline in claimants living in shared accommodation and growth in slightly larger households sizes is likely to have necessitated a shift towards areas of the city where suitable housing stock was available.
2.2.4 Private sector rents and the LHA rate in Birmingham
Accommodation costs for claimants within Birmingham followed a similar profile to national trends increasing from 2008 to 2011. Average weekly costs then declined until 2013 before steadily increasing again. However, the cost band of £100 to £125 per week was the most common within the city from 2008 through to 2016.
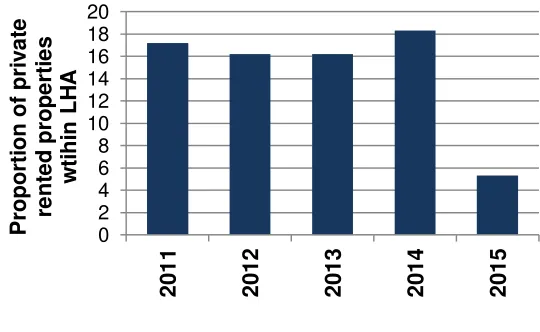
Data collected by Birmingham City Council on the proportion of rents of new lettings in the private rented sector in Birmingham that are within the Local Housing Allowance rate provides some
[image:20.595.82.352.548.714.2]indication as to why there may have been changes. Figure 2.9 suggests that the proportion of private rented properties below the LHA rate was relatively stable between 2011 and 2014. However it then dropped considerably from 18% of properties in 2014 to just 5% in 2015.
Figure 2.9: Proportion of private rented lettings below the Local Housing Allowance level, October 2011 to October 201510
10
19
2.3
Let to Birmingham Lettings Analysis 2014-16
2.3.1 Background
Let to Birmingham provide regular quarterly data to Birmingham City Council in the form of a QAF spreadsheet . This provides details of lettings activity in the previous quarter. Properties let are classified by size, location, lettings term and rent type (HALD, LHA or other). Tenants of properties let are classified by age group, ethnicity, gender and disability. Management information on numbers of properties advertised and the length of time taken at various stages of the lettings process are also recorded. The QAF relates to lettings activity and not to the stock of properties at any point in time or handbacks to landlords. Other records are held by the LtB manager, but to date the main management information provided to Birmingham City Council has been confined to the QAF.
The following analysis draws on the QAF data, using the fourth quarter QAF returns for 2014.2015 and 2015 which each include a summative column with totals for the year. For some of the data presentations we have used a sub-sample of the data covering the 18 month period January 2015 to June 2016.
In using these annual totals we have ignored some reconciliation problems with the raw quarterly data and some minor changes in data formats between years (such as the inclusion of totals for properties advertise but not for those actually let in 2014).
2.3.2 Properties sourced
A key objective of LtB was to source as many good quality properties as possible to provide Birmingham City Council with a reliable source of additional housing supply to assist with its homelessness prevention duties. Targets were set for the numbers of properties to be secured and performance was monitored through totals advertised and totals actually let. One of the reasons for the discrepancy between the latter figures is that some advertised properties were withdrawn when either the council was unable to refer a suitable nominee or the landlord withdrew the property for some other reason.
Lettings against target 2014,2015 and 2016
20
Figure 2.10: Targets and actual outturn for Let to Birmingham11
[image:22.595.182.358.522.713.2]
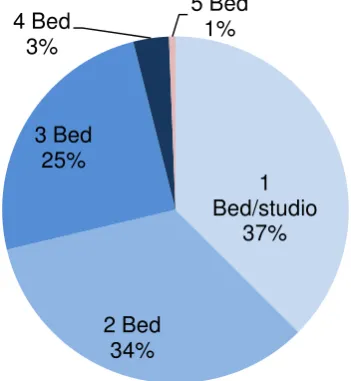
Size of Properties sourced and Let
Figure 2.11 highlights the size of properties being let through the scheme. Most properties being let were small with over two-thirds being 1 or 2 bed. Only 4% of properties were larger than 4 bed or larger.
Figure 2.11: Size of properties being let by Let to Birmingham 12
11
Authors calculations based on data from LtB for 2014-16 0
200 400 600 800 1000 1200
2014 2015 2016
Target
Properties advertised Properties let
1 Bed/studio
37%
2 Bed 34% 3 Bed
25% 4 Bed
3%
21
Location of Properties sourced and let
Figure 2.12 highlights the number of lettings by ward (for those with ten or more lettings). The figures show that 38 out of 40 wards had at least one letting during this period and almost half of the wards (42%) had 10 lettings or more. The number of lettings is mapped in Figure 2.13 to highlight the spatial pattern of areas with higher numbers of lettings.
The top five wards were spread across different parts of the city (Soho, Nechells, Acocks Green, Aston and Kings Norton).
Figure 2.12: Let to Birmingham Number of lettings by ward13
12
Authors calculations based on data from LtB from January 2015 to June 2016 13
22
Figure 2.13: Map of Let to Birmingham lettings by ward14
14
23
Lettings Term
[image:25.595.124.438.193.413.2]The term length of new lettings is outlined in Figure2.13. It highlights the emergence of six month lettings in 2016. Prior to this point all lettings had been on twelve month terms. The shorter six month tenancies represented a minority of lettings in 2016.
Figure 2.14: Let to Birmingham Lettings terms15
Rental Type
The changes in type of rental between 2014 and 2016 are highlighted in Figure 2.15. It shows that HALD represents the largest source in each of the years accounting for the majority of lettings. There has been a reduction in LHA lettings over the three years. Other rental types i lude su -HALD he e e ts a e fle i l egotiated ith la dlo ds at somewhere between LHA and HALD.
Figure 2.15: Type of rental for Let to Birmingham properties16
15
Authors calculations based on data from LtB 16
Authors calculations based on data from LtB 0 50 100 150 200 250
2014 2015 2016
N u m b e r o f p ro p e rt ie s le t 6 months 12 months 0 50 100 150 200
2014 2015 2016
[image:25.595.79.398.560.738.2]24
2.3.3 Tenant Profile
The QAF data provides some useful information on the demographic profile of tenants assisted through LtB, but it does not provide any reliable information on nominations and referrals or the homelessness status of applicants. It is understood from qualitative interviews that LtB has not so far been used to discharge statutory homelessness duties or to move people on from homeless
temporary accommodation. The main focus has been on homelessness prevention and housing options, and there have been a small number of self-referrals/direct applicants and council tenants waiting for transfer taking up new PRS tenancies through LtB.
Age Group
[image:26.595.117.421.349.723.2]The age group of tenants can be seen in Figure 2.16. One-third of lettings (34 %) are to younger tenants aged 25 years or under. Less than 10% of lettings are to older households aged 50 years or over.
Figure 2.16: Age group of Let to Birmingham tenants17
17
Authors calculations based on data from LtB from January 2015 to June 2016
16-18 4%
19-25 30%
26-49 57% 50-59
7%
25
Ethnicity
Figure 2.17 highlights the ethnic groups of tenants. 'White British' ethnicity accounts for more than half of lettings. In total, 17 different ethnic categories are identified in monitoring data which highlights the diversity of tenants.
Figure 2.17: Ethnicity of Let to Birmingham tenants18
Gender and joint tenancies
[image:27.595.180.331.520.705.2]The gender split of tenancies can be found in Figure 2.18. It shows that the vast majority of lettings (almost 90%) were made on single tenancies. In addition there are twice as many females as males on single tenancies.
Figure 2.18: Gender of Let to Birmingham tenants19
18
Authors calculations based on data from LtB from January 2015 to June 2016 19
Authors calculations based on data from LtB from January 2015 to June 2016
White British 53%
Black Caribbean
13% Asian Pakistani
9% Black African
8% Mixed White &
Black Caribbean
3%
Other ethnic group 14%
Female 61% Male
28%
26
Disability
Figure 2.19: Disability status of Let to Birmingham tenants20
Figure 2.19 indicates that one-fifth of tenants disclosed a disability. The most common disabilities being disclosed were:
• mental health (39% of those with a disability), • mobility (18%)
• learning disability (10%)
Employment Status
While the QAF data does not include employment status, interviews with LtB staff confirmed that because of the rent levels and benefit entitlements it is very unusual to place households working more than 16 hours a week into HALD properties which make up around 80% of the LtB stock. LHA properties are sometimes used for people in work, but the majority of LtB tenants are not in full time work. Furthermore in our interviews with LtB tenants who were seeking work indicated that they would be likely to move out if they were successful in getting a full time (see Chapter 3).
20
Authors calculations based on data from LtB from January 2015 to June 2016
Disability 20%
27
2.4
Conclusions: Comparing Let to Birmingham to the LHA market
From the analysis in sections 2.2 and 2.3 of the report it is possible to draw out some key comparisons between the PRS niche occupied by LtB and the wider housing benefit market in Birmingham. It should be noted that the number of lettings from LtB is small when compared to the wider Housing Benefit niche. This means that comparisons should be treated with caution. Some of the key findings relate to:
Size of property. The size of property in LtB lettings is not dissimilar to the wider Housing Benefit market. Around two-thirds of properties are one or two bedrooms in both cases. This is split more towards one-bed properties in the LtB group than the wider market.
Shared accommodation. LtB does not source shared accommodation or HMOs, it therefore has a different market position to some other access schemes reviewed in our other reports.
Age. The age profile of LtB tenants was much younger than the wider Housing Benefit market. Only 6% of HB claimants in the PRS were under 25 compared to 34% of LtB lettings.
Ethnicity. There is no available data on ethnicity of the Housing Benefit niche but it is likely that it is comparable to the private rented sector as a whole. In 2011, 61% of private renter households in Birmingham were 'White'.21 This suggests that the 53% of LtB lettings to 'White British' tenants is broadly representative of the wider population.
Gender. Comparison between LtB and national data on Housing Benefit claimants can be used to assess gender and tenancy type. A higher proportion of LtB lettings went to households headed by single female claimants (61%) than at a national level (52%).22 The proportion of joint lettings was lower in Birmingham (11%) than nationally (22%).
Disability. There is no direct comparator for the LtB lettings in relation to disability.
However, the proportion of LtB lettings to people who are self-reporting disabilities appears to be noticeably higher than might be expected amongst the wider population.
Location. LtB lettings are being made across the city covering a range of different types of sub-market. 38 of 40 wards had at least one letting and over half had ten or more over the 18 month period January 2015 –June 2016.
In summary this suggests that LtB lettings are generally to younger, single households and they appear to more likely to have a disability and less likely to be in full time employment. This can be contrasted with a shift to older, in-work tenants in larger properties amongst the wider Housing Benefit market within the city. There is also evidence of growing affordability pressures within low cost accommodation in Birmingham. This suggests that LtB may be meeting a gap in the market particularly for accommodation for younger people who find it increasingly difficult to access either social housing or other affordable private rented accommodation.
21 Authors’ analysis of census data.
28
3.
Tenant Experience of Let to Birmingham
3.0
Aims and Methods
Our review of existing literature on social lettings agencies (SLAs) identified the lack of evidence on the experience of tenants and of landlords as a major gap in knowledge. In order to determine whether SLAs are successful, we need to know more about how they are viewed by tenants who should be the primary beneficiaries of schemes that aim to help people access the PRS who are homeless or on low-i o es (Shelter Scotland 2015). We also need to know more about what motivates landlords to let properties through SLAs rather through other channels.
We therefore worked with Let to Birmingham to secure access to a sample of tenants and landlords involved with Let to Birmingham lettings in Autumn 2016 to map their experiences and views of the scheme.
Tenant Interviews
For the tenant interviews we constructed a purposive sample of 15 of the 400 households in LtB tenancies in November 2016 aiming to reflect the population in relation to age,
[image:30.595.140.533.580.764.2]household type and size of accommodation, ethnicity and disability, rent regime (HALD or LHA) and length of time in LtB tenancies. We sampled from five wards in north, central and south Birmingham to represent different parts of the market identified in Chapter 2. Table 3.1 compares the achieved sample to the targets showing that the sample broadly reflects the population by age, size of accommodation, household type and ethnicity but slightly over-represents clients with disabilities. In terms of length of time in LtB tenancies we broadly achieved our aim of a mix of recent and more long-standing (over 12 months) tenants. In terms of location we slightly over-represented the north and underrepresented the south of Birmingham and in terms of rents we had slightly fewer HALD and LHA than anticipated because of the emergence of a sub-HALD category (above LHA rates but below full HALD rate).
Table 3.1 Achieved Let to Birmingham tenant sample characteristics against targets
Criteria Target Achieved
AGE 18-25 5 6
AGE 26-49 9 7
AGE 50+ 2 2
One Bed Flat 5 5
Two bed Flat 6 5
Two bed Bungalow - 1
Three Bed House 3 3
Four Bed House 1 1
Ethnicity – White 9 10
Ethnicity – BME 6 5
Disabled 3 4
29
6-12 months with LtB 5 4
Over 12 months with LtB 5 5
Rents HALD 12 10
Rents Reduced HALD - 4
Rents LHA 3 1
Ward Perry Barr (N) 5 6
Ward Aston (N) 1
Ward Acocks Green (C) 5 5 Ward Kings Norton (S) 5 2
Ward Northfield (S) 1
Work on sampling and fixing tenant interviews was undertaken by a Housing and Communities student who had work experience as an intern with Let to Birmingham and who worked with the LtB lettings officer to secure the sample. Tenant interviews were by pre-arranged appointments at the te a ts home address with the male project lead interviewer accompanied by the female student assistant. Four of the tenant interviews were undertaken by phone. Tenant Interview recordings and notes were held securely on password protected laptops by the research team.
The 15 tenant interviewees were provided with a participant information sheet about the project and completed consent forms before interview recording began. They were anonymised and are simply referred to as T1-T15 in the sections below where quotations are presented.
Homeless Hub Advice Session Observation
Additional information on tenant experience was provided by observation of one of the LtB drop in advice sessions at the Birmingham Homeless Hub in Newtown on December 7th 2016. During a period of little more than an hour eight applicants and potential applicants were interviewed, with several of them successfully securing appointments to view properties within the next week. Applicants came from a range of age and ethnic backgrounds, mainly women, some with young children, several in work or seeking work, some quite recently living in Birmingham. Some were clearly anxious, one with family member as interpreter, others quite knowledgeable, confident and articulate. All shared a need for accommodation, some very urgently.
These observations were written up as an anonymous note immediately after the session and this was used as background information for parts of this chapter (particularly in sections of 3.1 on barriers and enablers to housing through LtB). No personal identification information was obtained or held by the research team about these interviewees.
[image:31.595.139.530.71.215.2]30
3.1
Tenant Experience
3.1.1 Access Group
[image:32.595.89.506.246.540.2]As was established in Chapter 2, the majority of the 400 LtB tenants in November 2016 can classified as homeless prevention or housing options clients referred by Birmingham City Council rather than statutory homeless acceptances or other groups. This allows the council to record all LtB clients housed as homeless prevention cases for its returns to DCLG.
Figure 3.1 Mapping Tenant Perceptions of Let to Birmingham
While the majority of new tenants are now sourced through three times a week visits by the LtB letti gs offi e to the Cou ils Ho eless Hu i Ne town, interviews indicated that other routes may be successfully followed by those seeking accommodation including direct approaches to LtB and transfers from council properties in Birmingham. Thus while prevention and housing options are highlighted in Figure 3.1 as the main types of LtB tenants, two other categories were also found: self-referrals and council tenants.
An example of the first access route was provided by a BME household who had moved to
Birmingham from a council property in another local authority where had lived for six months. They had found the LtB office when up for the day from Cheltenham for house-hunting.
I sa the Let to Bi i gha offi e he I as looki g fo a o odatio age ies i
31
kids. The said the had a fe pla es a aila le…..a d the had pi tu es of different properties with energy ratings and all. This place was available, it had just ee efu ished. (T9) Another family had been on the Birmingham council transfer list for a number of years and were desperate to leave their tower block flat but their points level meant they were well down the queue on all of their bids for council properties. They were referred to LtB by an advice worker from a Social Services supported advice service (Home Start) and received an offer very speedily after application. They accepted this first property they viewed. It met their needs much better than the council flat they had left, having a garden and friendly neighbours, and being close to the special schools attended by their two children.
3.1.2 Household types
Survey results in Chapter 2 indicate that LtB tenants tend to be younger than private tenants as whole and more likely to have a household member with a disability. A high proportion are not in work with single parents and older people with long term disabilities being strongly represented in our interview sample.
The experience of worklessness made the HALD scheme advantageous for these groups in the medium term but had potential longer term disadvantages. Property quality was generally good but rents were seen as expensive under HALD and several tenants planned to move on to less expensive properties elsewhere in the PRS if they got a job.
One single woman interviewed compared LtB favourably with other housing options mainly because of the accessibility and responsive repairs service. However, she intended to get into work and move on to an independent PRS property as she felt that she would not be able to afford the rent or feel that it represented value for money if she were paying from a weekly wage.
It s OK ut its ou d a out £ 4 a eek ut I hopi g to get a jo a d ould a t to pa no more than £80 a week. O e I sta t o ki g full ti e I goi g to o e out of he e a d get somewhere proper where I want to live. I would apply to the council but I dou t that I d
get a he e e ause I e got o kids…I d e o the list three to fi e ea s efo e the d gi e
e a p ope t (T8)
Analysis of the interviews revealed some differences in experience and attitudes between these two key important client groups younger single parents and households with disabilities.
This may simply reflect lifecycle stage with younger people having higher aspirations and being more likely to be dissatisfied in many similar surveys such as standard social housing satisfaction surveys. It may also reflect differences in the types of accommodation occupied. For example in this sample most of the young mums lived in apartment blocks, two of which had a significant number of single parents because all the flats had two bedrooms; whereas several of the older people including households with disabilities were renting whole houses and bungalows.
32
Two tenants were less happy with LtB policies on transfers, these were both mums with young children on the third floor of the walk up block, one whose child had serious medical condition. They had difficulty with lugging things up and down the stairs and had asked to move to the ground floor when flats were vacated there. They were both told they were not entitled to transfer within the term of the tenancy. One said that if she had known about this restriction when she moved in she would not have accepted the tenancy.
I ha e a dou le push hai , I o the top floo , I ha e to go up a d do it s a
ight a e…I e t ied to let the k o a d asked if I ould o e to a p ope t o the g ou d
floor that was empty and they said no, that really annoyed me. They said once they have
housed ou the a t ehouse ou, so o I ha e to ait u til I a sa e fo a deposit to get a p i ate pla e o go a k o the ou il list (T5)
3.1.3 Tenant motivations
The general motives for using LtB were fairly clear amongst interviewees. They were usually in urgent need of housing but not eligible or in sufficient priority to secure a social housing offer and unable to get the kind of accommodation they needed in the private rent sector, for example because of the need for a deposit. Motivations tended to vary with household type and experience of other housing options.
One single male tenant had experienced homelessness and poor health and been 12 months sofa surfing and been on street after having to leave family home after domestic dispute. Although not accepted as statutory homeless he had been referred to LtB by the Council:
It was a family matter, yeh? I had to move out. She kicked me out and the police told me
that I a t go a k the e. ….so I as ho eless o the st eets, o e f o f iend to friend,
sleep i a s, that s goi g o fo ea l a ea . I did t get o he e u til this August. Let to Birmingham say the pe so ho as li i g he e as goi g to lea e, a d it as ok (T11)
Another tenant, a former student, had approached LtB when she was sofa surfing with various friends for 6-12 months and was not assisted by the council as she did not meet the priority need criteria:
when you are homeless you have no place to go ..I went many times to the council but each
ti e it as e dep essi g fo e the e e e p oto ols ou ha e to eet a d I did t
because I was moving around. But then council office referred me to LtB who really helped me with finding a place….sho ed e a fe pla es a d the somehow I got this place. (T12)
One family had four children and were sharing with their parents in a council property. They needed a four bedroom house and it had been very difficult for the council to identify accommodation of a suitable size. They were delighted to find a four bedroom former council house in South Birmingham which LtB had secured at the LHA rate from a right to buy purchaser who had migrated to Australia:
We eeded to o e out of u s ou il place as we were overcrowded. The Council
33
because of the overcrowding. They referred us to LtB who sorted us out straight away. This is much better than I had rented before, cheaper as well (T1)
Another had moved from unsuitable PRS accommodation in another part of the Midlands for family support and health reasons:
the PRS) property we were in was old and very cold plus my father was ill and we needed to be over here to help him. We applied to the council but that was a nightmare because we
were not priority but then we saw LtB o the a k of a us a d o ta ted the (T3) Some existing council tenants had found difficulty in getting a transfer to a suitable property, for example to accommodate mobility problems. They had been referred to LtB by advice agencies:
We was in a council high rise in Birmingham, we had two autistic children of 9 and 12 of opposite sexes sharing a room for the best part of four years but the sharing age kept going
up and we needed out. Bidding for council properties had been demoralising but we had an adviser from Social Services (Home Start) who talked to City Council and explained the situation. (T10)
3.1.4 What are the barriers to tenants letting through Let to Birmingham?
However similar circumstances to those set out above would apply to a high proportion of the 23,000 clients on the housing register in Birmingham, whereas only a few hundred have been housed through LtB so far.
Often they were referred to LtB by homeless prevention caseworkers or other housing advisers and it was clear that access to information was important in enabling them to choose this option. While 40 or so homeless case workers at the Newtown hub receive regular information about LtB
vacancies, there is unevenness in the extent to which this information is filtered to their clients. We were told by the Homeless Hub manager that most BCC applicants want a council property (because of the security, rent levels and RTB) and are prepared to wait for it. This was said to be the main reason for the relatively low level of referrals to LtB by the council. This suggests that for most applicants to the council, LtB is not seen to offer comparable benefits to a council tenancy.
Therefore, caseworkers are only likely to refer those clients who they feel are open to considering alternatives.
After initial filtering by homeless advisers, even for those who were aware of LtB there was a large amount of luck involved based on whether LtB had managed to access accommodation of the size they needed in their areas of choice.
34
3.1.5 What enables tenants to secure lettings through Let to Birmingham?
Some of the enablers to securing lettings through LtB were illustrated by the drop in session that we observed at the Newtown Homelessness Hub on December 7th 2016.
The process seemed very informal. LtB staff had a current vacancy list and used this and an
assess e t of lie ts i u sta es a d p efe e e to ake speed de isio s o hethe LtB could help at that time.
Interviews varied in content but usually covered LtB role, BCC shortage of supply and long waiting times, client housing situation, employment and financial circumstances and what size and location of property looking for. Most clients had filled in application forms in advance. In some cases these were scanned and updated during the interview. Supporting information would be taken later at property viewing stage.
LtB staff used judgement to respond to different client needs. They were clear about the high level of HALD rents and the need to avoid putting people into places they could not afford. Knowledge of welfare benefits was used to assess the suitability of different properties for the clients interviewed (rent levels, number of bedrooms and location being the main deciding factors).
This approach appeared to take some clients by surprise. Some were clearly expecting a more formal process and came armed with evidence of medical needs etc. which are more commonly part of council rehousing processes.
Several clients were given the prospect of a speedy property inspection and offer, once their forms referenced, HB sorted and properties come through. Some are less lucky as no properties in their areas or sizes (no bedsits or one bed flats were available on the day). The general feel was of a very un-bureaucratic process in which viewing and sign up could be a matter of days away from first contact interview with LtB. This process is driven by what properties are on offer with LtB trying to let these as rapidly as possible. It is an amalgam of commercial lettings agent and social housing practices.
3.1.6 Tenant comparisons of LtB with social housing and PRS
Tenants with experience of the private rented sector tended to rate their LtB properties higher than those in the sector as a whole. LtB was seen to have a positive effect on private landlords with regard to repairs and the higher HALD rates generally allowed tenants to enjoy better quality properties than they could have accessed individually at LHA rates.
It s ette tha pla es I ha e e ted efo e. I like the a its a peted, ell-kept a d it s ot
old, it s e t all heated ut that s a it e pe si e. (T15)
Our interviews found that most LtB tenants do not make direct comparisons with social housing but that when they do LtB lettings tend to compare favourably on property quality and location and particularly on waiting time.
35
regular income by switching from the student HMO market to family housing supported by housing benefits.
A distinctive pattern was apparent among some of the older households with greater experience of council housing in earlier periods of their lives. Three households in this category were particularly positive about the advantages of their LtB property compared to either council housing or direct access to the PRS.
One older couple who had been council tenants for 15 years had moved from a two bedroom council flat to a two bedroom LtB bungalow which met their mobility needs and was in a good location. It was the only property they had looked at and they had secured it within 6 weeks of being referred to LtB. They were very happy to have moved and were positive about LtB
The e e e o p o le s ith the ou il ut the letti gs age the so t of got us hat e a ted…. e had see it d i i g up a d do a d sa this pla e as hat e a ted …we were just lucky…Its lo el i e a d a a d ple t of spa e…lo el ig ga de (T14) Another former tenant household were also very positive about the experience of moving in to a LtB street property and becoming part of a community.
When we moved in it was totally redecorated . We also needed to be close to our hild e s special s hool……met the landlord in the first three or four weeks and got on famously with
hi …. e li ed i the th ee to e lo ks efo e fo the last 4 ea s a d I d o o l e e k o t o of eigh ou s to speak to, si e e e ee he e I talk to o e neighbours.
I get o ith e e od . (T10)
More than any other case this one shows that PRS can provide an equivalent or better sense of well-being than council housing where there is a decent property, a good service provider, a trust based relationship with the landlord, encouragement of self-help and home making and apparently robust financial support. However it remains the case that these outcomes rely more on individual
personalities and relationships and are not underpinned by similar levels of legal protection to a council tenancy
As noted earlier there were some different perspectives from interviews with four single mums in a new LtB apartment block. Although most had family experiences of council housing, none of them seemed to regard LtB as an alternative to council housing but as part of the PRS. They all either wanted to stay with LtB or to move on to another PRS property. This suggests that for their
generation the transition from council housing is already well advanced. Getting a council property is no longer regarded as a realistic option and housing careers are being planned around a succession of private rentals to fit life changes such as pregnancy, stable family formation and moving into regular employment.
3.1.7 Does Let to Birmingham provide comparable benefits to tenants to social housing?
36
Quality
Taking property quality first, the sample of tenants visited generally confirmed the views expressed by council and LtB officers that these properties were generally at least as good as and often better than council properties.
The tenants visited were occupying a range of property types including new purpose built apartment blocks, whole terraced and semi-detached houses, a bungalow and some converted flats. LtB does not procure shared housing so there were no examples of HMOs.
Comments on the quality of housing were generally positive.
This family were very pleased with their house in Perry Barr that had been completely renovated by the landlord after conversion from a student HMO when the nearby campus closed:
I ould sa it s a i e p ope t , just a fe fla s like the f o t doo that eeded atte tio
(T9)
This young mum was delighted with the newly built two bedroom flat that she had been able to choose through LtB:
I was pregnant and come and viewed the place and had the pick of the flats which were just being built…its lo el …..the e s e e ee a p o le s. (T4)
Another tenant living in a self-contained apartment within an older converted house was also pleased and compared it favourably to other PRS properties:
It s better than places I have rented before. I like the way its carpeted, well-kept and it s not cold, it s e t all heated ut that s a it e pe si e. (T15)
LtB was also generally seen to be providing a better service than tenants could have expected by securing PRS direct or through commercial lettings agents (condition on letting, avoid deposit and responsive repairs). O e di e t e a ple of this as p o ided a te a t hose othe s la dlo d had left LtB but she had continued to rent from him and noticed a deterioration in the service. This showed the difference that LtB management had made to the tenant experience:
My mum lived in a LtB p ope t that s ho I got this o e. But he la dlo d left LtB …the
o t a t e ded so the left a d she s p ett useless. LtB used to be on to the landlord but
o she has to deal ith it. No the d ai s a e all lo ked a d the e s da p i the kit he a d it s so old i the i te . (T4)
Other positive comments about LtB services included
37
Security
This is the dimension on which LtB clearly fares least positively than social housing since properties are let on Assured Shorthold Tenancies (mostly for 12 months, but recently for some lettings on 6 month introductory tenancies).
However, it was notable that despite the absence of legally protected security, a number of LtB tenants appeared to feel secure. Some anticipated that their landlords would continue to let to them well beyond the terms of the AST agreement, and there was a degree of confidence that if their landlords did want their properties back LtB would be able to supply an equivalent property.
If the landlord like wanted his p ope t a k the letti g age t has said hed give three months to get somewhere else and we (LtB) ould get ou so e he e else…get ou hat you want …as lo g as this is he e e ill sta ..this is it ou last o e…. we hope to be here for many years. It never entered our mind that we might lose it.(T14)
A surprising number of interviewees answered our final question on where they expected to be living in two ea s ti e that they expected to still be in their LtB properties. It is still quite early to assess the realism of these expectations, but we found a number of tenants who had been with LtB for over 18 months of its three year life.
However, some tenants saw their LtB accommodation as more temporary and in some cases as not a eal ho e especially the restrictions on decorations) and were looking to move on once
relationships and work allowed.
ou a t de o ate he e, o it s the ules. It akes it feel less like ho e…(T6)
A more flexible approach was encountered by some tenants including the following older couple who had struck up a good individual relationship with their landlord. She had let through LtB after experiencing a major trashing of her property by a previous tenant who had been sourced privately. She was so pleased with her new LtB tenants and was willing to be flexible about repairs:
O ega said e e t allo ed to de o ate fo o ths, ut e et the la dlad a d she
said do it when you want, its ou ho e. (T3)
A similar confidence was shared by a middle aged family with children:
I was told that I had to ask permission first so they could see what the landlord views are whether it s ok or not ok. I will ask them as I want to put up wallpaper and carpets. I do t
38
Cost
As the analysis is chapter 2 showed that the vast majority of the properties sourced by LtB have been let on HALD rates which are significantly above local LHA levels. This has been an important factor on securing better quality accommodation as shown above.
Tenants were also aware that council rents were still considerably lower than PRS and general and LtB in particular and this was seen as particularly important for those paying the full rent
themselves:
Of ou se I ould ha e liked a ou il p ope t . If ou ha e to pa ou o e t it s usually
less tha a p i ate la dlo d (T15).
Some households were clearly facing difficulties with the rents, where top ups were involved:
The e t is o e tha e a affo d eall , the housi g e efit o e s just u de half, ut the ha e ee fle i le a d e ha e et the la dlad . (T3)
And for some the high HALD rents were seen as a reason for seeking alternative accommodation once employment and family circumstances allowed:
It s OK ut Its ou d a out £ 4 a eek ut I hopi g to get a jo a d ould a t to pa o o e tha £ a eek . O e I sta t o ki g full ti e I goi g to o e out of he e a d
get somewhere proper whe e I a t to li e (T8)
I ould t sta lo g te e ause the e t s too high…..I would hope to pay around £100 less for a private flat shared with my o f ie d (T6)
Access in the basis of housing need
LtB clearly provides an additional opportunity for households in need to access good quality housing in Birmingham. The most striking advantage that LtB can offer over council housing is speed of access. This was remarked upon in similar terms in several of the tenant interviews:
we ended up on the waiting list and we rang LtB who said there was nothing they could do but then he said hang on if I send you the forms where do you want to move….the next thing
e k e he said do ou a t to o e a d ha e a look… e lo ed it a d sig ed the pape s
there and then T
Next thing we know we got a phone call from Let to Birmingham and the gentleman we spoke to said we have got this property available this afternoon, we came in and had a look
around. It was take it or leave it so we took it within a week we were i .(T10)
Speed of response was also a key feature of our observation of the drop in session at the Newtown hub. A common reaction to dealing with LtB was that:
39
However, it must be recognised that this advantage that distinguishes LtB from a typical social housing access process is a direct result of their focus on letting properties speedily rather than necessarily housing those with the greatest need. So in this respect the traditional focus of social housing allocations systems o housi g eed is ot a ke featu e of LtB s letti gs p o ess. I stead there is greater emphasis on commercial lettings agent practices of vetting tenants and letting speedily.
3.1.8 Conclusion
This Chapter has filled an important gap in the existing publications on SLAs reviewed in our Evidence Review and Typology Report by providing research evidence on tenant perceptions and experience of SLAs. While the sample is relatively small, it has illustrated the sheer diversity of experience and perceptions among tenants. There is a strong impression of differences in
satisfaction between younger family households and older couples and households with member with disabilities. This may reflect differences in expectations and life-chances repeated in other similar surveys. It may also reflect differences in the types of accommodation sourced by LtB for different household types, with younger families more likely to be found in apartment blocks alongside other families in their cohort creating a sense of impermanence not found in single house residences enjoyed by some of the older cohort.
From the evidence summarised in paragraph 3.1.7 we cannot conclude from tenant experience that LtB has been able to create a e so ial housi g, recreating the advantages of the old social housing model. While property quality is generally good and the service levels and accessibility are widely appreciated by tenants, it has been more difficult to match the cost and security features of social housing.
Arguably, for economically inactive groups including retired people, people with limiting disabilities and young mums focused on childcare rather than employment of over 15 hours a week, the HALD rates have not been a major impediment. Indeed have contributed to the property quality aims by enabling LtB to source better private rentals than they could have done at LHA rates. However, for tenants looking to move into employment the high rents can be a benefit trap forcing them to consider moving home rather than seeing their LtB property as a secure base from which to get a job.
Security has probably been the most significant shortfall in comparison with social housing but this is entirely related to the current predominance of assured shorthold tenancies in the PRS. However, in practice many tenants do not appear to be unduly troubled by insecurity and there are expectations that they will be able to retain their tenancies in the medium term. Failing that they appear to trust that LtB will be able to provide equivalent tenancies in the event of their landlord withdrawing. However, there was another sense in which some younger tenants interviewed saw their LtB properties as insecure and not quite home. This related to the need for permission for decorations by the tenant.
40
During the research we became aware of other access schemes operating in different parts of the market, notably the scheme operated by Spring Housing set out in a case study in our regional publication which is targeted in single people living in shared accommodation. It will be important in the future for a wider range of access schemes to be established to reach a higher proportion of those excluded from social housing and having difficulty accessing decent PRS accommodation. Such access schemes need to learn from the experience and views of Let to Birmingham tenants and build their services to meet the criteria that are most important to tenants. However, to do so they will need to attract many more private landlords and respond to their motivations and requirements as well. The next chapter therefore moves on to review new evidence about the landlords who have worked with Let to Birmingham.
4.
Landlord Experience and Motivations
4.0
Aims and Methods
Section 3.0 set out the rationale for the qualitative interviews with landlords and tenants conducted in Autumn 2016 and the methods used in the tenant interviews. This paragraph sets out the
methodology for the landlord interviews.
For the landlord interviews we aimed for a sample of 10 landlords from the 100 or so letting through LtB in November 2016. The sample aimed to reflect the mix of landlords by size of portfolio, location and type of properties, and length of time as LtB landlords and to match some landlords with tenants already included in the tenant sample.
Work on sampling and fixing landlord interviews was undertaken by a Housing and Communities student who had work experience as an intern with Let to Birmingham and who worked with one of the LtB acquisitions officers to secure the sample. Thanks to his help we achieved 7 interviews in 2016, to add to the two achieved in 2015. Despite several requests he was unable to persuade the owner of a large new block where three of the tenant interviews were held to take part in the study. Landlord interviews took place at a variety of locations including landlord s homes, offices and rented out properties and by phone. All landlord interviews were undertaken by the project lead. Landlord Interview recordings and notes were held securely on password protected laptops by the research team.
We used semi-structured face to face or telephone interviews taking around 30 minutes for landlords. These interviews were recorded after informed consent had been secured using a participant information sheet and consent form. All interviews went well and were completed with few gaps in the questions covered. We us