planning configuration in ERP
SAAD, Sameh M. <http://orcid.org/0000-0002-9019-9636>, MERINO PEREZ,
Castor David and VEGA ALVARADO, Victor Enrique
Available from Sheffield Hallam University Research Archive (SHURA) at:
http://shura.shu.ac.uk/16277/
This document is the author deposited version. You are advised to consult the
publisher's version if you wish to cite from it.
Published version
SAAD, Sameh M., MERINO PEREZ, Castor David and VEGA ALVARADO, Victor
Enrique (2017). Development of a mechanism to facilitate the safety stock planning
configuration in ERP. Production & Manufacturing Research, 5 (1), 42-56.
Copyright and re-use policy
See http://shura.shu.ac.uk/information.html
Full Terms & Conditions of access and use can be found at
http://www.tandfonline.com/action/journalInformation?journalCode=tpmr20
Download by: [Sheffield Hallam University] Date: 25 July 2017, At: 06:10
Production & Manufacturing Research
An Open Access Journal
ISSN: (Print) 2169-3277 (Online) Journal homepage: http://www.tandfonline.com/loi/tpmr20
Development of a mechanism to facilitate the
safety stock planning configuration in ERP
Sameh M. Saad, Castor David Merino Perez & Victor Enrique Vega Alvarado
To cite this article: Sameh M. Saad, Castor David Merino Perez & Victor Enrique Vega Alvarado (2017) Development of a mechanism to facilitate the safety stock planning configuration in ERP, Production & Manufacturing Research, 5:1, 42-56, DOI: 10.1080/21693277.2017.1322541 To link to this article: http://dx.doi.org/10.1080/21693277.2017.1322541
© 2017 The Author(s). Published by Informa UK Limited, trading as Taylor & Francis Group
Published online: 02 Jun 2017.
Submit your article to this journal
Article views: 128
View related articles
https://doi.org/10.1080/21693277.2017.1322541
Development of a mechanism to facilitate the safety stock
planning configuration in ERP
Sameh M. Saada, Castor David Merino Perezb and Victor Enrique Vega Alvaradoc
aDepartment of Engineering and Mathematics, Sheffield Hallam University, Sheffield, UK; bDepartment of
Logistics, Wavin Limited, Doncaster, UK; cDepartment of Planning, Street Crane Limited, Derbyshire, UK
ABSTRACT
Safety stock planning in ERP in general is dependent upon the planner having the experience to simulate planning scenarios. This paper focuses on the development of a mechanism to calculate adequate safety stocks in accordance with required service levels while enabling efficient configuration of the ERP safety stock parameters. The proposed mechanism could be of great benefit to industrial firms as it offers the ability to classify demand patterns, proposes replenishment strategies that are consistent with the demand profile, calculates key parameters and identifies the changes required to the ERP master data. The associated real world application is able to identify potential to save approximately £1.2 M in stock reductions and, more importantly, allows targeted actions to be implemented at material level. These results demonstrated that the proposed mechanism can be considered as a valuable new development for manufacturing industry to gain the competitive advantage.
1. Introduction
Inventory represents a significant investment in any business. It is a critical asset as it secures adequate levels of service for each item class. However, this investment is often larger than it should which generates financial implications on costs, cash flow, risk of obsolescence, loss, damage and administration (Bowersox, Closs, & Cooper, 2010). Another critical implication of excess inventory is that it hides problems. Sadler (2007) suggested that even though most of the time the inventory should be reduced, there are several motives why to hold inven-tory. In fact, these reasons differ from different kind of business, some of these reason are:
• Separate production from customers order.
• To facilitate bulk transport to distributions centres by pallets and these pallets can be divided into individual orders.
• Small item and low costs.
KEYWORDS
Safety stock planning; inventory management; ERP; SAP
ARTICLE HISTORY
Received 10 February 2016 Accepted 15 December 2016
© 2017 The Author(s). Published by Informa UK Limited, trading as Taylor & Francis Group.
This is an Open Access article distributed under the terms of the Creative Commons Attribution License (http://creativecommons.org/ licenses/by/4.0/), which permits unrestricted use, distribution, and reproduction in any medium, provided the original work is properly cited.
CONTACT Sameh M. Saad S.Saad@shu.ac.uk
• Delivery time is less predictable.
• It is necessary assortment of products available for customers. • Geographical location of customers.
• Seasonal products and seasonal sales.
On the other hand, there are several motives to avoid accumulating inventory such as, avoiding tiding up working capitals, reduce storage space, items become obsolete or deteriorate.
One of the most important purposes of inventory control is to make stock holding effi-cient, but a critical issue is how to measure this efficiency. Beutel and Minner (2012) pre-sented an integrated framework for demand estimation and safety stock planning. Number of different factors such as price and weather were considered, the framework was based on causal demand forecasting and error estimation as well as a linear programming. Rappold and Yoho (2014) introduced an optimisation model to determine safety stock levels that minimise long run expected costs and optimise item-level planning parameter such as lot size, safety stock and lead time in MRP systems. Khader, Rekik, Botta-Genoulaz, and Campagne (2014) studied the impact of inventory inaccuracies on the performance of an inventory management system where the demand satisfaction is mainly based on the inventory position which could be subject to errors and might not represent the actual stock physically available. They provided an analytical optimal ordering solution for the problem concerning the impact of errors on the optimal ordering policy.
For firms that under financial distress, their aim often is to reduce level of inventory even for short term, Steinker, Pesch, and Hoberg (2016) showed that the magnitude of inventory reduction under financial distress depends on many factors such as firm size and turnaround strategy which in my opinion contribute to the way forward for the firms in identifying their priority in handling their inventory and stock level. The stock keep-ing is, for any company, strongly connected with the cost, Mascle and Gosse (2014) pre-sented a concept to deal with large number of products which variants considerably and complicates the inventory control process. In their work, the focus was to minimise the stocks while at the same time avoiding missed sales. According to Chikán (2011) a new inventory paradigm is necessary for challenging current business practice and is based on three main concepts:
• Inventory optimization can be performed independently of status, short-term initi-atives or medium and long-term strategies in other business areas such as Logistics, Manufacturing, Demand Planning, Procurement or Finance.
• The main role of inventory as a buffer to smooth processes, mainly on Production and Sales and also its role in connecting physical process between different organization units.
• At present inventory performance is largely evaluated in relation to total cost against the cost of holding, replenishing replenishment and handling shortages.
The author also established the link between state of affairs in the wider economy, tech-nology, the business vision and understanding of best practice in inventory management; a good example is the Just-in-Time concept which presented organizations with the idea of running a business with zero inventory holdings.
objective is to review the inventory costs and increase the availability of this inventory through the application of inventory optimization tools (Gilmore, 2008).
Braglia, Castellano, and Frosolini (2016) presented an approach for safety stock man-agement in a single-vendor single-buyer coordinated supply chain, aiming to minimise the cost under stochastic demands. The approach is mathematical based and as usual there are some assumptions to facilitate the development of the mathematical model that may not applicable in real-life applications such as, for example, the authors assumed that there will be one vendor supplies a single product to one buyer. In addition, they assumed that the inventory is continuously reviewed, and replenishments are made whenever the inventory level falls to the reorder point, this may not be the case in every type of industry as there is another policy can be followed such as reorder cycle method.
Kumar and Evers (2015) examined the impact on safety stock when accurate record of demand during the lead time is compromised and they proposed an alternative formulation for setting safety stocks using a multiplication approach for estimating the variance using data aggregated over lead time. One of the advantages of this approach is its resilience but it will be limited by the coefficient of variation of the lead time.
It is well known that materials requirements planning (MRP) systems are used to coordi-nate the production and the demand based on the lead time parameters (Koh, Saad, & Jones,
2002), which often lead to uncertainty in the effectiveness of the MRP Systems. Rappold and Yoho (2014) introduced an optimisation model to determine safety stock levels that minimise long run expected cost to support sales and operations planning during the lead time which is useful for tactical planning.
Amirjabbari and Bhuiyan (2014) developed a non-linear cost optimisation safety stock model in lean environment aiming to identify the optimal level of safety stock. Their model is presented through different value streams of each finished product family of the company involved in their research and utilised lingo optimisation software but they have to limit the number of stages considered in the model for simplification purposes.
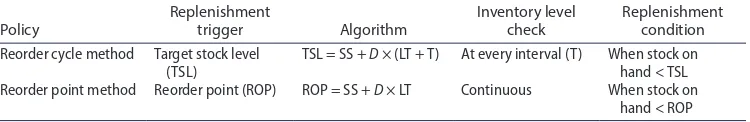
There are many other published research articles in the area of safety stock with vari-ability in both lead time and demand such as Eppen and Martin (1988) used exponential smoothing technique to estimate the demand and also estimate the distribution for the lead times. Charnes, Marmorstein, and Zinn (1995) developed a model that considers the periodic-review inventory replenishment policy to control the stockout rate when the autocovariance function for Gaussian demand is known from historical data. Persona, Battini, Manzini, and Pareschi (2007) proposed two equations to calculate the safety stock for assembly to order and manufacturing to order production systems relying on the usage of modular products and super bill of materials within which the variation in the modular is considered to determine safety stock levels of subassemblies or components taking into consideration the service levels. The work reviewed in the above three mentioned articles differ from the work proposed in this paper from the prospective of the new proposed mechanism which allows efficient configuration of the ERP Safety stock parameters, the two different replenishment policies that can be used based on replenishment conditions whether the stock on hand is less than target stock level (TSL) or less than reorder point (ROP), see Table 1 for more details.
• Demand analysis, allowing the classification and segmentation according to their pat-tern of behavior.
• Determination of inventory levels enhanced security. • Simulations of strategies inventory.
The result of these models is a detailed analysis of the scenarios that can be recom-mended to choose the most appropriate inventory policies, determining the safety stock levels according to the required service levels.
According to Christopher (2011) the aim of supply chain management is to provide cus-tomers with the level of quality of service that they need. The way to measure the service is as the percentage of times in which the customer’s requests are satisfying totally. Supposing the demand follow a normal distribution, which can be defined by two parameters, the mean and standard variation and in that occasions when demand surpasses the average of the sales, safety stock is required. So, a safety stock greater one standard deviation achieve approximately 84% service level and a safety stock with two standard deviation get 98% and with three deviation achieve 99.99%. Thus, an increment in the desire service level brings a disproportionate investment in inventory.
Based on the literature review and the long experience of the authors of this article (in working with ERP systems), it can be concluded that there is an absence of a capability in ERP systems to facilitate the safety stock in accordance with the required service level while enabling efficient configuration of the safety stock parameters within the ERP sys-tem. In addition, a need to have a close and interlinked strategy with Production Planning and stock control in such ways that business strategy rely on manufacturing as a source of competitive advantage. This has been recognised by the authors and set as the research aim of this article which is to improve the functionality of the ERP system in place in order to gain this competitive advantage.
2. Research methodology
The research method used in this project was ‘Action Business Research’ and, in line with Cameron and Price (2009), aims to inform thinking, decisions and/or actions in relation to an issue of interest to the organisation or its stakeholders. The objective of this article is problem-solving orientated and pursues the ability to implement actions to drive business performance. With this in mind, a research question was established as a starting point:
How can we determine the optimum safety stock levels in a systematic way that considers the required levels of service and ensures efficient ERP functionality?
[image:6.493.60.435.67.128.2]Consequently, a roadmap was set as follows to develop the generalised proposed mech-anism, however, from practicality point of view and during the development stage of the
Table 1. Determining the replenishment trigger.
Policy Replenishment trigger Algorithm Inventory level check Replenishment condition
Reorder cycle method Target stock level
(TSL) TSL = SS +
D × (LT + T) At every interval (T) When stock on hand < TSL Reorder point method Reorder point (ROP) ROP = SS + D × LT Continuous When stock on
mechanism, the authors will relate to SAP as it was the ERP system that the authors have access to and also installed at the company which will be used later for application:
• Identify the key parameters for safety stock calculation in SAP.
• Design a methodological framework for determining optimum safety stock. • Develop an application tool to facilitate the calculations required on a large scale. • Redefine the SAP parameters.
3. SAP safety stock planning functionality
The safety stock level is considered in SAP as a measure for protecting against the many variations that may occur in different situations, such as variation in demand, a low pro-duction estimate, delivery time, etc. (SAP AG, 2014). SAP Supply Network Planning (SNP) features two procedures for defining inventory policy at product level, namely standard and advanced methods. In the standard method, the values used by SAP for replenish-ment calculations remain static and the key parameters are the number of days for safety stock coverage and safety stock quantity. When used in conjunction, the system prioritises whichever value is higher (SAP Help Portal, 2014).
The advanced methods are dynamic because safety stock levels are recalculated at item level based on the latest demand profile, forecast accuracy and service level required. These mathematical algorithms are established in SNP modules and are based on two inventory models: the ‘reorder cycle method’ and the ‘reorder point method’. To enable the imple-mentation of advanced methods, it is necessary to set up the initial parameters in a way that allows automatic configuration of the calculations, and this is why it is recommended that these parameters are calculated and constantly monitored using standard methods first so that these parameters can serve as a base values (SCMFOCUS, 2014).
4. Inventory model conceptualisation
Effective inventory management is based on balancing (a) customer service by reducing lead time and minimising the risk of stock out occurrence, (b) inventory costs by mini-mising stock holdings and (c) operating costs by defining efficient batch quantities and frequency of production (Wild, 2002). According to Gilmore (2008), this balance can be achieved through the application of inventory optimisation models. These models are based on mathematical algorithms that account for different demand patterns that can be aligned to a single strategy. Thus, fast moving items can be treated in a different way to those that move less frequently, allowing classification and segmentation according to the pattern of behaviour as well as the allocation of specific replenishment strategies.
4.1. Determining the parameters associated with the demand
(ADI) and the Coefficient of Variation (CV). The mathematical algorithms are expressed by formulas (1) and (2) respectively:
The variable ADI defines the relationship between the interval between two consecutive demands (t) and the number of periods with demand (N), while CV focuses on weighting the consumption of pieces (ε) during a specific number of periods (M). These calculations allow the allocation of the items in categories associated with their demand patterns. Nevertheless, Ghobbar and Friend (2003) agreed with the fact that this demand pattern classification varies systematically and categories must be set according to business decisions and strategies that apply to the demand patterns. For this reason, a deviation from this characterisation definition has been included in this research work due to the particular characteristics of the products and inventory strategies to be used at any manufacturing firms including Wavin company used in this research work for illus-tration purposes. The cut-off points for each type of demand pattern have been set as shown in Figure 1.
These demand patterns can be summarised as follows: The ‘Smooth’ demand category represents items with high demand frequency from weekly to every three weeks plus low variability in quantity order. The ‘Erratic’ demand category is designed to group items with a moderate demand frequency from monthly to a quarter periods with variability in order size. The ‘Lumpy’ demand category represents all the items that are requested sporadically with high variability in order size. Proposing these three mentioned different demand cat-egories will guarantee an appropriate classification to majority of the demand pattern in manufacturing environment.
(1)
ADI=
∑N
i=1ti
N
(2)
CV= 1
𝜀 �
∑M
i=1
� 𝜀i−𝜀�
2
[image:8.493.176.317.467.630.2]M
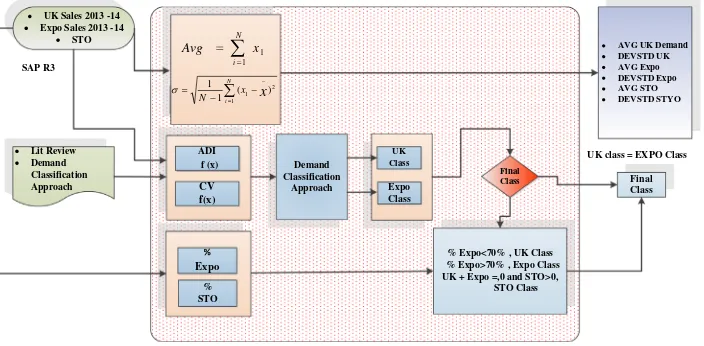
The approach conceptualized for the determination of the Demand is displayed through the flow chart indicated in Figure 2, which can shows the inputs, outputs and relationship between the different key parameters.
4.2. Determining the parameters associated with the lead time
The actual times of production orders are the main inputs for the lead time calculation. Due to the variability of order quantity produced in every batch, it is necessary to establish a base quantity order to identify the variability in production times. A time estimation weighting method is used to determine the nominal value of the lead time in order to consider the tendency of the value obtained. This method is based on the Programme Estimation and Review Technique (PERT) commonly used as a project management technique for time estimation, which deals with the likelihood assigned to estimates about the competition of activities based on the categories of optimistic, most probable and pessimistic times (Maylor, 2010).
The approach for the determination of the lead times illustrated in Figure 3 shows the inputs, outputs and relationship between the different key parameters.
4.3. Inventory policies and determining optimum safety stocks
In view of the need for the company to ensure the availability of products in accordance with required service levels, major decisions must be taken in relation to inventory control: The decisions include how often the review is done, the order quantity and when to order, all of which are the result of product-specific inventory policies set based on a corresponding demand pattern. Schroeder, Goldstein, and Rungtusanatham (2011) indicated two ways for efficiently approaching inventory control for independent demand items: The ‘reorder point method’, in which the stock level is reviewed after each transaction and replenishment happens as soon as the inventory level drops to a reorder point. The other is the ‘reorder cycle method’, in which the stock position is reviewed at fixed intervals heading towards a target stock level. Table 1 shows the respective replenishment conditions of the two methods.
ADI f (x) CV f(x) Expo % STO
AVG UK Demand DEVSTD UK AVG Expo DEVSTD Expo AVG STO DEVSTD STYO
% Expo<70% , UK Class % Expo>70% , Expo Class UK + Expo =,0 and STO>0,
STO Class Demand Classification Approach Final Class UK Class Expo Class Final Class UK class = EXPO Class UK Sales 2013 -14
[image:9.493.72.424.457.630.2]Expo Sales 2013 -14 STO Lit Review Demand Classification Approach N i x Avg 1 1 N i x x N 1 2 1 ) ( 1 1 SAP R3
As such, the outputs of the process are outlined by the parameters representative of each inventory policy that will define the inventory levels when balancing supply and demand during the evolution of the company’s operations.
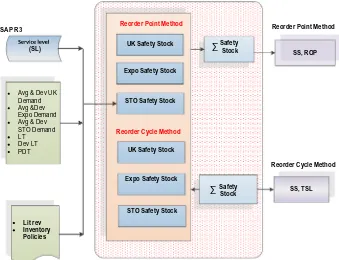
[image:10.493.73.423.52.228.2]The safety stock value drives the efficiency of the inventory policy. To proceed with this calculation, it is necessary to determine a safety factor (Z) associated with the service level percentage required. This factor is determined by the probability of stock out occurrence based on a normal distribution percentage curve (Christopher, 2011). Finished products at Wavin experience variability in both demand (D) and lead time (LT) parameters, meaning that the demand deviation (σD) and lead time deviation (σLT) are taken into account for calculating the optimum safety stock (SS) level for each item under the application of the expression (3).
Figure 4 illustrates the main inputs, which relate to data extracted from the different reports either via SAP R3, APO or Business Warehouse.
All the calculation processes and algorithms showed previously provide the guidelines for proceeding with the building and development of an application tool in any programming language. In this research project, Microsoft Excel and Access software are used.
5. Inventory management tool development and its application at WAVIN Company
In order to gain a competitive advantage, successful companies often seek to achieve a leadership position in terms of both cost reduction and service enhancement.
This has been recognised by Wavin Limited, a company that manages an extensive prod-uct portfolio, enabling it to now become the UK’s leading supplier of water management, plumbing and other construction and utilities materials with a direct presence in over 25 countries (Wavin, 2014).
(3)
SS=z
√
𝜎D2 ×LT+𝜎2LT×D2 SAP R3
LT Nominal
LT DEVSTD LT
Nominal
LT DEVSTD Min LT x item
Avg LT x item Max LT item LT x order x item
NO Days Days per /PC LT
Aus Base Qty
PDT/7
SAP R3 SAP R3
The company has recently gone live on SAP and is currently going through a refinement phase that is also associated with the need to unlock further functionality with a view to streamlining and controlling processes. For example, the company has identified that the safety stock calculation functionality has not yet been implemented. Alongside this approach, the senior management team has expressed concern regarding the increasing trend during 2014 towards inventory holdings at the manufacturing site. For this reason, the Planning Team was set the task of reviewing safety stock holdings.
Safety stock planning in SAP allows a specific service level to be attained by creating safety stock for all products throughout the supply chain (SAP Help Portal 2014). As mentioned in Section 3, the tool enables inventory policy to be defined by means of standard and advanced methods: Standard methods are based exclusively on the planner’s experience, while advanced methods determine safety stock levels based on scientific algorithms. At present, Wavin is using only the standard methods, meaning the planner enters the safety stock information for each item directly into the system based on his/her experience. As a result, it has become clear that there is a need for a more robust mechanism to support the calculation of adequate safety stocks at an item level in accordance with the required service level in order to facilitate the safety stock planning configuration.
In order to address the company’s requirements for a method of performing accurate and robust calculations for safety stock settings, an Excel/Access based inventory management tool was developed. Functional graphic shortcuts on the ‘Home’ tab serve as a process flow diagram but also allow quick access to relevant data sources, calculations, results and what if scenarios (see Figure 5).
Reorder Cycle Method UK Safety Stock
Expo Safety Stock
STO Safety Stock
UK Safety Stock
Expo Safety Stock
STO Safety Stock
Safety
Stock SS, TSL
SS, ROP
Avg & Dev UK Demand Avg &Dev Expo Demand Avg & Dev STO Demand LT Dev LT PDT
Lit rev Inventory Policies
Reorder Point Method
Reorder Cycle Method
SAP R3 Reorder Point Method
∑
Safety Stock
[image:11.493.76.415.51.311.2](SL) ∑
As can be seen in Figure 6, mass data input is achieved using Microsoft Access for consolidat-ing pre-defined reports extracted from SAP ECC, APO and Business Warehouse containconsolidat-ing key material master parameters such as product code, service level required, MRP procedure, batch size and safety stock settings, in addition to sales order performance, stock levels and forecasts (Wavin, 2010). This data feeding process allows the construction of a unique database in an accurate and efficient way. It keeps the parameters and their values and helps generate a database with only the parameters required to perform the subsequent and more advanced calculations. All of which are the main inputs for the determination of the safety stocks and inventory policies.
[image:12.493.71.418.52.215.2]Once the calculations are performed, the ‘Results’ section presents the anticipated out-come in terms of inventory projections, including expected savings or additional investment required. Graphic summaries have been included to facilitate the decision-making process either at item or product group level. The section entitled ‘SAP parameters to update’ con-tains the revised settings that need to be configured in SAP in order to make the adjustments proposed by the model. The format allows automatic upload by simply converting into a flat file. Another useful application offered by this tool is the ‘What if’ tab, which facilitates the creation of scenarios by manipulating several parameters in order to analyse the possible variations and their operational and financial impacts in a user-friendly and efficient manner.
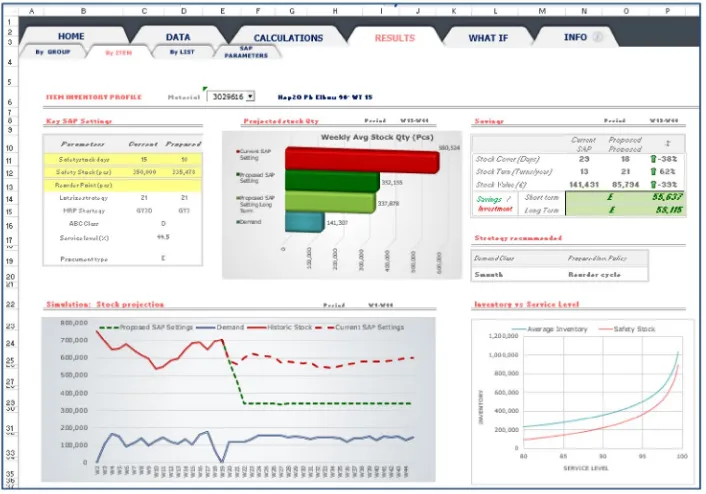
Figure 7 displays the ‘Results’ tab by item and is designed to provide the operational and financial analysis through the use of comparative tables and simulation graphs in a user-friendly interface. One of the major functionalities offered by the development of this application tool is the ability to incorporate the simulation for stock projection, which is a graphic interpretation of the inventory planning algorithms currently used by SAP and known as the Advanced Planning and Optimisation (APO) planning view. This means that this graph is able to calculate approximate values in relation to those determined by the SAP during the inventory planning process.Figure 7. ‘Results’ tab view in the application tool.
6. Application results
The Planning Department at the Wavin Doncaster site identified an increase in stock hold-ing for finished goods, which reached a peak in April 2014 at close to an unprecedented
£4.3 M in inventory value. The portfolio of products supplied by Wavin is complex and diverse but the brand with the greatest stock value contribution is the Hep2O fittings range with an average contribution of 57% for the first quarter of 2014. This suggested that this product family of 599 items was the most adequate to carry out the analysis required. All
Figure 6. Data feeding process into the application tool.
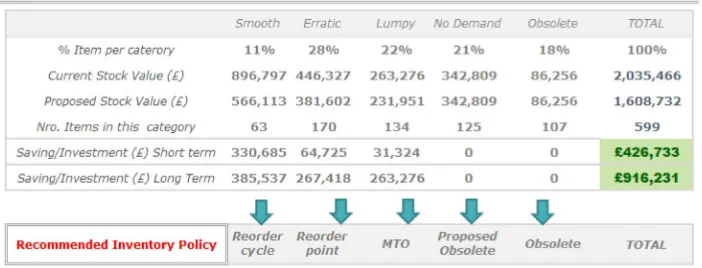
[image:13.493.71.424.310.557.2]key parameters for these materials were taken from the product master materials (MM) records and SAP reports, and the parameters were processed using the application tool. Figure 8 illustrates the resulting demand classification for these items, as well as the inven-tory policy suggested for each class.
It can be seen that these products have three well defined patterns: Smooth, Erratic and Lumpy. The fast moving and high demand items are identified in the classification as ‘Smooth’ and represent the lowest proportion in the total of all items (61 items/599 items). It also shows an outstanding finding regarding the items identified as ‘No demand’ that have not been sold for the last 12 months and also have no forecast demand, even though these items are considered active items by SAP. Conversely, there are some items that are already identified as obsolete, which represents 18% of the total of all items considered in this study. According to this demand classification, the following adequate inventory policies were recommended:
• The reorder cycle method for ‘Smooth’ items so that adequate availability of these high demand and frequent required products is offered thanks to a target stock level set according to the required service levels. Although this demand class represents the lowest proportion of the total of all items, it is the one that offers greater savings in the short term, accounting for around £330,685.
• Items that demonstrate erratic behaviour are better aligned with reorder point methods because the reorder point triggers replenishment only when the stock is lower than this point, meaning that the inventory levels are maintained at the lowest possible level during periods in which there is no demand for this type of item for up to three continuous months.
• ‘Lumpy’ items are requested no more than four times per year, which suggest that neither the cycle method nor the reorder point method are adequate. Instead it is recommended that a change is made to the manufacturing strategy for this type of items, transforming it into a make-to-order strategy.
7. Conclusions
The study has presented a mechanism that could be of great benefit to manufacturing firms. It will enable them to calculate safety stocks in accordance with the required service level
that offers the ability to classify demand patterns and proposes replenishment strategies that are consistent with the demand profile. The proposed mechanism was developed and integrated with SAP as one of the leading ERP system in the market; however, the mecha-nism can be easily integrated with other ERP systems. Therefore, the novelty of this paper can be summarised in the following:
• The development of an approach to classify the demand in real time which allows the establishment of an appropriate production plan, designed to cope with the identified demand classification. This is detailed in Figure 2.
• The development of an approach to calculate the lead time parameters which allows an accurate estimation of the safety stock. This is shown in Figure 3.
• A robust integrated mechanism to support the calculation of adequate safety stocks in accordance with the required service level in order to facilitate the safety stock planning configuration and most importantly enables efficient configuration of the ERP safety stock parameters. This is demonstrated in Figures 4–6.
Output from the integrated mechanism highlighted the need to increase safety stock levels for several products that otherwise would be at higher risk of stock out occurrence. Nevertheless, projections from the results suggested that a reduction of 3 M items is required. This will result in a reduction in inventory investment in excess of £1 M. In addition, the proposed mechanism revealed unwanted and obsolete items, allowing the company to achieve an additional stock reduction of £300 K. The proposed mechanism offered a solu-tion for performing fast and frequent inventory policy reviews with ease, at the same time as producing the output required to update SAP parameters automatically.
Finally, given the consistent results obtained from the proposed mechanism, the authors are confident that these results are robust and the mechanism should be considered as valuable new development for manufacturing industry and will help the practitioners to improve the functionality of the ERP system in place in order to gain the competitive advantage.
The focus of this research work was on the key product group for the company; however, the solution developed constitutes a perfectly transferable process across the whole business portfolio and, with minor adjustments, across all UK manufacturing sites. Nevertheless, further work is still needed such as:
• The mechanism has also plenty of scope to evolve into a robust decision-making tool to aid strategic procurement.
• The need to frame Inventory Management Strategy within the area of Product Lifecycle Management is an element that will allow the business to take the next step towards medium and long term inventory optimization and the associated reduction in write off costs associated with obsolete products.
Finally, extending the functionality of the mechanism beyond finished goods and incor-porate, in the short term, other key component parts.
Acknowledgments
Disclosure statement
No potential conflict of interest was reported by the authors.
References
Amirjabbari, B., & Bhuiyan, N. (2014). Determining supply chain safety stock level and location. Journal of Industrial Engineering and Management, 7, 42–71.
Beutel, A. L., & Minner, S. (2012). Safety stock planning under causal demand forecasting. International Journal of Production Economics, 140, 637–645.
Bowersox, D., Closs, D., & Cooper, B. (2010). Supply chain logistics management (3rd ed.). Boston, MA: McGraw-Hill.
Braglia, M., Castellano, D., & Frosolini, M. (2016). A novel approach to safety stock management in a coordinated supply chain with controllable lead time using present value. Applied Stochastic Models in Business and Industry, 32, 99–112.
Cameron, S., & Price, D. (2009). Business research methods: A practical approach. Wimbledon: Chartered Institute of Personnel and Development.
Charnes, J. M., Marmorstein, H., & Zinn, W. (1995). Safety Stock determination with serially correlated demand in a periodic-review inventory system. Journal of the Operational Research Society, 46, 1006–1013.
Chikán, A. (2011). Managers’ view of a new inventory paradigm. International Journal of Production Economics., 133, 54–59.
Christopher, M. (2011). Logistics and supply chain management (4th ed.). Harlow: Financial Times Prentice Hall.
Eppen, G. D., & Martin, R. K. (1988). Determining safety stock in the presence of stochastic lead time and demand. Management Science, 34, 1380–1390.
Ghobbar, A., & Friend, C. (2003). Evaluation of forecasting methods for intermittent parts demand in the field of aviation: A predictive model. Computers and Operations Research, 30, 2097–2114. Gilmore, D. (2008). Supply chain news: What is inventory optimization? Supply Chain Digest. Retrieved
May 17, 2014, from http://www.scdigest.com/assets/FirstThoughts/08-08-28.php?cid=1885 Khader, S., Rekik, Y., Botta-Genoulaz, Valérie, & Campagne, J. (2014). Inventory management subject
to multiplicative inaccuracies. International Journal of Production Research, 52, 5055–5069. Koh, S. C. L., Saad, S. M., & Jones, M. H. (2002). Uncertainty under MRP-planned manufacture:
Review and categorization. International Journal of Production Research, 40, 2399–2421.
Kumar, A., & Evers, P. T. (2015). Setting safety stock based on imprecise records. International Journal of Production Economics, 169, 68–75.
Mascle, C., & Gosse, J. (2014). Inventory management maximization based on sales forecast: Case study. Production Planning and Control, 25, 1039–1057.
Maylor, H. (2010). Project management (4th ed.). Harlow: Financial Times Prentice Hall.
Persona, A., Battini, D., Manzini, R., & Pareschi, A. (2007). Optimal safety stock levels of subassemblies and manufacturing components. International Journal of Production Economics, 110, 147–159. Rappold, J. A., & Yoho, K. D. (2014). Setting safety stocks for stable rotation cycle schedules.
International Journal of Production Economics, 156, 146–158.
Sadler, I. (2007). Logistics and supply chain integration. [online]. London: Sage. Retrieved May 22, 2014, from https://www.dawsonera.com/readonline/9781848604735
SAP AG. 2014. Enterprise resource planning. Retrieved May 24, 2014, from http://www.sap.com/pc/ bp/erp.html
SAP Help Portal. 2014. Safety stock planning. Retrieved May 29, 2014, from http://help.sap.com/ saphelp_scm50/helpdata.htm
Schroeder, R., Goldstein, S., & Rungtusanatham, M. J. (2011). Operations management: Contemporary concepts and cases. Boston, MA: McGraw-Hill.
Steinker, S., Pesch, M., & Hoberg, K. (2016). Inventory management under financial distress: An empirical analysis. International Journal of Production Research, 54, 5182–5207.
Wavin. (2010). Master Data Manual v01.06. Doncaster: Author.
Wavin. 2014. About Wavin UK. Retrieved May 11, 2014, from http://co-uk.wavin.com/co-uk/About_ Wavin_UK.html
Wild, A. (2002). Best practice in inventory management (2nd ed.). Oxford: Butterworth-Heinemann. Willems, S. (2011). How inventory optimization opens pathways to profitability. [online]. Supply