Home advantage in the Winter Paralympic Games 1976–
2014
WILSON, Darryl and RAMCHANDANI, Girish
<http://orcid.org/0000-0001-8650-9382>
Available from Sheffield Hallam University Research Archive (SHURA) at:
http://shura.shu.ac.uk/15848/
This document is the author deposited version. You are advised to consult the
publisher's version if you wish to cite from it.
Published version
WILSON, Darryl and RAMCHANDANI, Girish (2017). Home advantage in the Winter
Paralympic Games 1976–2014. Sport Sciences for Health, 13 (2), 355-363.
Copyright and re-use policy
O R I G I N A L A R T I C L E
Home advantage in the Winter Paralympic Games 1976–2014
Darryl Wilson1• Girish Ramchandani2
Received: 28 March 2017 / Accepted: 1 May 2017
The Author(s) 2017. This article is an open access publication
Abstract
Purpose There is a limited amount of home advantage research concerned with winter sports. There is also a distinct lack of studies that investigate home advantage in the context of para sport events. This paper addresses this gap in the knowledge by examining home advantage in the Winter Paralympic Games.
Methods Using a standardised measure of success, we compared the performances of host nations at home with their own performances away from home between 1976 and 2014. Both country level and individual sport level analysis is conducted for this time period. Comparisons are also drawn with the Winter Olympic Games since 1992, the point from which both the Winter Olympic Games and the Winter Paralympic Games have been hosted by the same nations and in the same years.
Results Clear evidence of a home advantage effect in the Winter Paralympic Games was found at country level. When examining individual sports, only alpine skiing and cross country skiing returned a significant home advantage effect. When comparing home advantage in the Winter Paralympic Games with the Winter Olympic Games for the last seven host nations (1992–2014), we found that home
advantage was generally more pronounced (although not a statistically significant difference) in the case of the former.
Conclusion The causes of home advantage in the Winter Paralympic Games are unclear and should be investigated further.
Keywords Home advantageDisability sport PerformanceParalympicsOlympics
Introduction
There is a generally well-established body of academic literature that investigates the phenomenon of home advantage in sport. Courneya and Carron reviewed studies that documented the extent of the home advantage and concluded that it exists in major team sports [1]. They went on to develop a conceptual framework for home advantage research, according to which ‘performance’ is a function of: game location (i.e. home or away); game location factors that differentially impact on teams competing at home or away from home; and the critical psychological and behavioural states of competitors, coaches and offi-cials. A subsequent review by Carron, Loughead and Bray proposed a slightly revised conceptual framework [2]. Table1 compares the components of the two models. There are two major differences between the original model and the revised model. First, ‘officials’ were excluded from the latter, not because they do not poten-tially contribute to home advantage but as, unlike com-petitors and coaches, they do not have a designated home or visitor status. Second, the revised model incorporated the critical physiological factors of competitors and coa-ches (e.g. testosterone and jet lag).
& Girish Ramchandani g.ramchandani@shu.ac.uk
Darryl Wilson d.j.wilson@shu.ac.uk
1 Sheffield Hallam University, Academy of Sport and Physical
Activity, A129 Collegiate Hall, Collegiate Crescent, Sheffield S10 2BP, UK
2 Sheffield Hallam University, Sport Industry Research Centre,
A118 Collegiate Hall, Collegiate Crescent, Sheffield S10 2BP, UK
More recently Jamieson conducted a meta-analysis of studies on home advantage [3] and suggested that theo-retical models would benefit from the inclusion of game-context factors, specifically when a contest occurs (time era effects) and what attributes are associated with particular contests (season length effects and sport effects), which may directly feed into game location factors. Differences in the magnitude of the home advantage between sports, and within sports over time, were also identified previously by Pollard and Pollard [4] when considering professional team sports in North America (American football, baseball, basketball, ice hockey) and England (football). With respect to individual sports, a review by Jones found mixed evidence for home advantage in comparison with the more robust evidence of its presence in team sports [5].
A subset of home advantage research is concerned with international multi-sport events, although these studies are rarely cited, or analysed as a separate category, in major literature reviews. For the most part, the Summer Olympic Games have been at the heart of previous research efforts [6–12]. A limited number of studies to date have examined home advantage in the context of the Winter Olympic Games [12–14] and the Commonwealth Games [15–17]. However, within home advantage research in general and its investi-gation within multi-sport events more specifically, there is a
distinct lack of studies in relation to sports events that are targeted at elite athletes with a disability such as the Para-lympic Games. It is this gap in the scientific knowledge that this paper attempts to address by focussing on the Winter Paralympic Games. To date, there have been 11 editions of the Winter Paralympic Games from 1976 to 2014. Nine different nations have hosted the competition in this time frame: Sweden (1976); Norway (1980 and 1994); Austria (1984 and 1988); France (1992); Japan (1998); USA (2002); Italy (2006); Canada (2010); Russia (2014). Between 1976 and 2014, the programme of the Winter Paralympic Games has incorporated six different sports: para alpine skiing (1976–2014); para cross country skiing (1976–2014); para biathlon (1988–2014); ice sledge speed skating (1980–1988 and 1994–1998); ice sledge hockey (1994–2014); wheel-chair curling (2006–2014). Para snowboard made its Winter Paralympic Games debut as a discipline under para alpine skiing in 2014. The number of events contested in these sports in each edition of the Winter Paralympic Games is presented in Table2. Overall, 739 of the 939 events con-tested between 1976 and 2014 (84%) have been in two sports, namely alpine skiing (49%) and cross country skiing (35%). Even though home advantage in para sports has not been investigated thus far, it has been documented to a certain extent in specific winter sports among non-disabled ath-letes. Bray and Carron found some evidence of home advantage in elite-level alpine skiing including statistical significance on some measures [18]. A subsequent study by Balmer et al. examined home advantage in the Winter Olympic Games from 1908 to 1998 [13]. Their study also reported evidence of home advantage in alpine skiing, which reinforces the findings from Bray and Carron’s study. Figure skating, freestyle skiing, ski jumping and short track speed skating were the other sports found by Balmer et al. to exhibit a significant home advantage. On the other hand, they found little or no home advantage in cross country skiing, biathlon, ice hockey and speed skat-ing amongst other sports (Nordic combined, bobsled and luge). When events were grouped according to whether they were subjectively assessed by judges, significantly greater home advantage was observed in the subjectively assessed events (figure skating and freestyle skiing) than other events (p\0.05), suggesting that judges were scor-ing home competitors disproportionately higher than away competitors [13]. Home advantage in subjectively assessed events has also been shown to exist in other international multi-sport competitions featuring summer sports [6, 16, 17]. However, none of the sports in the Winter Paralympic Games programme between 1976 and 2014 were reliant on subjective scoring by judges.
[image:3.595.51.288.73.390.2]Following the Balmer et al. study [13], attempts to examine home advantage in international competitions that feature winter sports have been few and far between. Table 1 Conceptual framework for home advantage research
Component Original model Revised model
Game location
Home 4 4
Away
Game location factors
Crowd 4 4
Learning/familiarity Travel
Rules
Critical psychological states
Competitors 4 4
Coaches
Officials 4 Ò
Critical physiological states
Competitors Ò 4
Coaches
Critical behavioural states
Competitors 4 4
Coaches
Officials 4 Ò
Performance outcomes
Primary 4 4
Secondary Tertiary
Koning analysed elite speed skating data from World Cups, World Championships and the Winter Olympic Games from 1986 to 2003 and found that a competitor skated faster at home than in another country, although the mag-nitude of the home advantage was very small [14]. To the best of our knowledge, there has been no formal investi-gation into home advantage in the sport of curling. Recently, Pettigrew and Reiche used a linear regression model to examine the size of the home advantage effect at country level in the Winter Olympic Games over 17 edi-tions between 1952 and 2014 [12]. While this study showed that host countries tend to increase their number of gold medals by around two and their total medal count by around four compared to the Games prior to hosting, nei-ther of the results were found to be statistically significant at conventional levels. Our research is the first attempt to directly measure the size of the home advantage in the Winter Paralympic Games. The objectives of the research were as follows:
• To analyse the overall performance of host nations in the Winter Paralympic Games when competing at home and away from home.
• To examine sport-specific variations in home advantage in the Winter Paralympic Games.
• To compare the size of the home advantage effect in the Winter Paralympic Games with the Winter Olympic Games.
Methods
The results of each edition of the Winter Paralympic Games between 1976 and 2014 were sourced from the official website of the Paralympic Movement (https://www.
paralympic.org/results/historical) and recorded in SPSS (version 24). As illustrated by the data presented in Table2 previously, there has been considerable fluctuation in the total number of events contested in the Winter Paralympic Games over time, ranging from a high of 133 in 1994 to a low of 53 in 1976. The number of events contested within the sports of alpine skiing (22–66), cross country skiing (20–48), biathlon (3–18) and ice sledge speed skating (8–16) has also not been the same throughout. Therefore, using absolute measures of performance such as the gold medal count or the total medal count does not control for the number of medals on offer or for the performance of non-hosting nations. For these reasons, we measured performance by: first, converting the number and type of medals won by each nation in a given edition into points (gold =3, silver=2 and bronze=1); and second, expressing those points as a proportion of the total number of points won by all competing nations in that edition. This performance measure is termed market share. For example, in 2006 the host nation—Italy—won 14 medal points out of 348 medal points awarded and their overall home edition market share was, therefore, 4.02% (i.e. 14 divided by 348).
[image:4.595.52.543.72.249.2]Table3 shows the number of valid home and away observations for each host country. To obtain a measure of home advantage, we first compared each nation’s average home performance with its own average away performance. For example, Italy’s home average market share of 4.02% was compared with its own average away market share (across nine editions) of 1.85%. This approach ensured that less successful countries were not unfairly compared with more successful countries. Countries that did not host the Winter Paralympic Games were excluded from the analysis. This was because they had no home performances to compare with their away performances.
Table 2 Events contested by sport in the Winter Paralympic Games
Year Alpine Skiing Cross country skiing Ice sledge speed skating Biathlon Ice sledge hockey Wheelchair curling Total
1976 28 25 – – – – 53
1980 22 27 14 – – – 63
1984 56 35 16 – – – 107
1988 43 38 12 3 – – 96
1992 48 27 – 4 – – 79
1994 66 48 8 10 1 – 133
1998 54 39 16 12 1 – 122
2002 53 32 – 6 1 – 92
2006 24 20 – 12 1 1 58
2010 30 20 – 12 1 1 64
2014 32 20 – 18 1 1 72
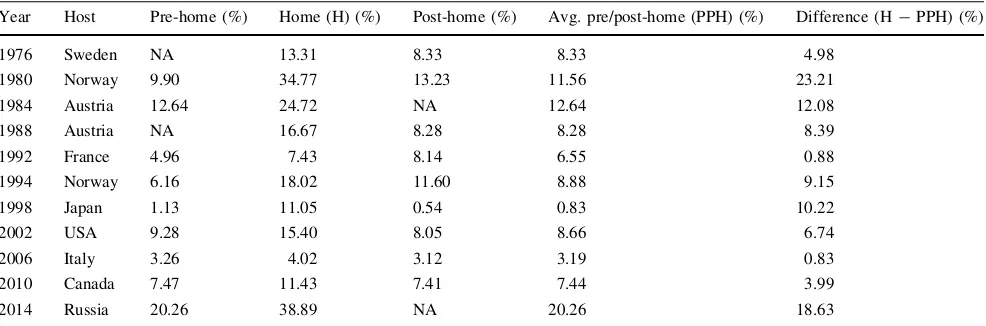
For each host nation, we also compared its home market share with its average market share in the editions imme-diately before hosting and immeimme-diately after hosting. For example, Italy’s market share in 2002 (pre-home) and 2010 (post-home) was 3.26 and 3.12%, respectively—an average of 3.19%. Therefore, its performance at home in 2006 was 0.83% points better than its average pre/post-home per-formance (i.e. 4.02 minus 3.19%). In instances where there was no valid pre-home or post-home data (i.e. pre-1976 for Sweden; post-1984 and pre-1988 for Austria; post-2014 for Russia), only the available away (pre or post) data point is utilised in the home advantage calculation. The number of countries included in the analysis varied for each sport, since not all sports have been contested in each edition of the Winter Paralympic Games. For example Sweden, the 1976 host, was eliminated from the biathlon analysis because biathlon was introduced in 1988 and hence there was no home data point to compare with away data points. Selected comparisons at country level and sport-specific level are also drawn with the Winter Olympic Games. The results of the Winter Olympic Games were obtained from https://www.olympic.org/olympic-results and the time period chosen for this analysis was 1992–2014. The rationale for this restriction was that 1992 was the point from which both the Winter Olympic Games and the Winter Paralympic Games have been hosted by the same nations and in the same years. For this comparative anal-ysis, the data for the sports of alpine skiing, cross country skiing and biathlon are based on six observations each (1992–2014) whereas the scores for ice hockey (1996–2014), curling (2006–2014) and speed skating (1994–1998) are based on five, three and two data points respectively, based on the availability of matched pairs.
In consideration of the limited number of observations available, a Wilcoxon signed rank test was used to deter-mine whether there was a genuine difference in nations’ performance under host and non-host conditions. A Spear-man’s rank-order correlation was run to assess the
relationship between team quality and home advantage at country level.
Results
Performance of host nations in the Winter Paralympic Games
The overall market share of the nine host nations in the Winter Paralympic Games from 1976 to 2014 is presented in Fig. 1. The overall level of success achieved in this time frame varies considerably by nation. The data in Fig.1do not differentiate between home and away performances. This differentiation is shown in Fig.2, which compares the home market share performance with the away market share performance.
The key point from Fig.2 is that each nation’s average home market share exceeds its average away market share. The magnitude of the difference ranges between 2.17% points in the case of Italy to 27.49% points for Russia. Using a Wilcoxon signed rank test on two sets of nine observations, the difference between nations’ home and away performance was found to be significantly greater than zero (z= -2.666, p=0.008), which suggests that there is a genuine home advantage effect.
[image:5.595.177.545.60.213.2]Because we are comparing performance typically in a single home edition (two in the case of Norway and Sweden) with pooled data for multiple away editions (be-tween five and ten) over a long time period (nearly four decades), it is possible that the estimates of home advan-tage in Fig.2 might be somewhat biased. To account for any fluctuations in performance of nations over time, Table4 compares the home market share of each host nation in every edition to its own away market share in the editions immediately before (pre-home) and after (post-home) hosting the competition. There is no away com-parator for Sweden pre-1976 and for Russia post-2014. Table 3 Valid home and away
observations for each host nation in the Winter Paralympic Games
Country Home Away
Number Years Number Years
Sweden 1 1976 10 1980–2014
Norway 2 1980, 1994 9 1976, 1984–1992, 1998–2014
Austria 2 1984–1988 9 1976, 1992–2014
France 1 1992 10 1976–1988, 1994–2014
Japan 1 1998 10 1976–1994, 2002–2014
USA 1 2002 10 1976–1998, 2006–2014
Italy 1 2006 9 1980–2002, 2010–2014
Canada 1 2010 10 1976–2006, 2014
Russia 1 2014 5 1994–2010
Fig. 1 Overall market shares of host nations in the Winter Paralympic Games 1976–2014
[image:6.595.87.511.59.336.2] [image:6.595.85.512.369.647.2]Austria hosted two consecutive editions in 1984 and 1988—hence there are no valid post-home and pre-home (away) data points respectively in these instances.
When comparing the market share of host nations at home with their average performance in the immediate pre-home and post-pre-home (away) editions, we found that all previous host nations performed better at home. The dif-ference between the mean home market share (17.79%) and the mean away market share (8.78%) using this approach was 9.01% points, which is slightly less than the mean differential obtained by comparing nations’ home performances with all their away performances (10.01% points). However, our results still suggest that when nations compete on home soil in the Winter Paralympic Games, their performance in terms of market share improves. The Wilcoxon signed rank test confirms that the observed dif-ference between home and away performances was sig-nificant (z= -2.934, p=0.003). If we accept away performance to be a reliable indicator of team quality, then there is a strong positive correlation between host nations’ average away market share and the size of the home advantage effect (rs=0.691, p=0.019).
Sport-specific findings
Table5 shows the differences between nations’ mance at home and their average pre/post-home perfor-mance for each Winter Paralympic sport. Only alpine skiing (z= -2.395, p=0.017) and cross country skiing (z= -2.401, p=0.016) returned statistically significant differences between home and away performances.
Comparison with the Winter Olympic Games
Table6 compares the magnitude of the home advantage effect in the Winter Paralympic Games with the Winter Olympic Games for the seven nations that have hosted the
competitions between 1992 and 2014. The average home advantage effect in this time frame for the Winter Para-lympic Games is 7.20% points compared with 3.71% points in the case of the Winter Olympic Games. The difference between the scores for the Winter Paralympic Games and the Winter Olympic Games is not significant (z= -1.690, p=0.091).
Figure3shows the direction and magnitude of the home advantage effect in the Winter Olympic Games and Winter Paralympic Games by sport. With the exception of ice hockey, the difference between home performance and average pre/post-home performance is greater in the case of the Winter Paralympic Games. However, given the small sample sizes involved none of these differences were found to be statistically significant (p[0.05).
Discussion
The academic literature on home advantage in sport can be categorised along two broad lines: (1) descriptive research, which focuses on investigating the prevalence and magni-tude of home advantage in different sporting contexts; (2) explanatory research that examines the factors that con-tribute to home advantage. While home advantage is known to exist in professional team sports [4] and, to a lesser extent in individual sports [5], the extent to which home advantage exists in para sports is not known. With this in mind, our study was concerned primarily with the determination of home advantage in para sports. With reference to the theoretical model for home advantage research advanced by Courneya and Carron [1] and its refinement by Carron et al. [2] in Table1, we considered the impact of game location on performance outcomes in the Winter Paralympic Games between 1976 and 2014.
[image:7.595.52.545.72.235.2]Our analysis shows that host nations in the Winter Paralympic Games performed considerably better at home Table 4 Pre-home, home and post-home market shares of host nations in the Winter Paralympic Games 1976–2014
Year Host Pre-home (%) Home (H) (%) Post-home (%) Avg. pre/post-home (PPH) (%) Difference (H-PPH) (%)
1976 Sweden NA 13.31 8.33 8.33 4.98
1980 Norway 9.90 34.77 13.23 11.56 23.21
1984 Austria 12.64 24.72 NA 12.64 12.08
1988 Austria NA 16.67 8.28 8.28 8.39
1992 France 4.96 7.43 8.14 6.55 0.88
1994 Norway 6.16 18.02 11.60 8.88 9.15
1998 Japan 1.13 11.05 0.54 0.83 10.22
2002 USA 9.28 15.40 8.05 8.66 6.74
2006 Italy 3.26 4.02 3.12 3.19 0.83
2010 Canada 7.47 11.43 7.41 7.44 3.99
2014 Russia 20.26 38.89 NA 20.26 18.63
than away from home and that the difference between home and away performances was statistically significant (p\0.05). In other words, strong evidence of a home advantage effect was identified. This finding resonates with previous research in the context of the Winter Olympic Games between 1908 and 1998 [13]. Pettigrew and Reiche [12] also examined home advantage in the Winter Olympic Games between 1952 and 2014, although they reported that the home advantage effect at country level in this time frame was not statistically significant. We found that the size of the home advantage effect is significantly correlated with the quality of the host nation. This finding indicates that home advantage is typically larger in the case of stronger nations.
Our analysis also points to sport-specific variations in home advantage in the Winter Paralympic Games. Across the six sports to be held in the Winter Paralympic Games to date, only alpine skiing and cross country skiing exhibited a significant home advantage effect (p\0.05). The prevalence of home advantage in alpine skiing in our study is in line with previous evidence from the Winter Olympic Games [13] and World Cups [18]. In contrast, while cross country skiing exhibited a significant home advantage
effect in our study, a previous study did not find any evi-dence of home advantage in this sport among able-bodied athletes [13]. Building on recent research [19,20] future studies should attempt to better understand the relative importance of game location within particular competition phases of these sports to provide more technical and tac-tical references for coaches, who regularly try to benefit from valuable information in planning training and com-petition. Evidence of home advantage in the remaining Winter Paralympic sports of biathlon, curling, ice sledge hockey and ice sledge speed skating was either weak or inconclusive.
[image:8.595.51.545.72.247.2]Home advantage in some international multi-sport events has been documented in sports that require subjec-tive judgments [13,16,17]. However, neither cross country skiing nor alpine skiing are reliant on subjective scoring by judges and none of the other four para sports that have featured at the Winter Paralympic Games were found to have a significant home advantage. Therefore, future research should investigate the game location factors that influence home advantage in the competition and how they affect the psychological, physiological and behavioural states of competitors and coaches. Based on previous Table 5 Difference between home and average pre/post home performances of host nations in the Winter Paralympic Games by sport
Year Host Alpine skiing (%)
Cross country skiing (%)
Ice sledge speed skating (%)
Biathlon (%)
Ice sledge hockey (%)
Wheelchair curling (%)
1976 Sweden 0.00 9.85 NA NA NA NA
1980 Norway 5.00 14.29 23.00 NA NA NA
1984 Austria -2.07 20.26 2.15 NA NA NA
1988 Austria 12.09 2.82 NA 11.11 NA NA
1992 France -0.38 1.70 NA -6.67 NA NA
1994 Norway 3.35 7.00 62.50 12.22 -16.67 NA
1998 Japan 1.95 1.02 64.58 6.94 0.00 NA
2002 USA 5.51 1.87 NA 0.00 41.67 NA
2006 Italy 6.34 -4.06 NA -1.39 0.00 0.00
2010 Canada 9.49 0.83 NA -2.07 -33.33 0.00
2014 Russia 17.80 16.67 NA 13.80 33.33 33.33
Table 6 Home advantage in the Winter Paralympics versus the Winter Olympics 1992–2014
Host Winter Paralympics Winter Olympics
Home (%) Avg. pre/post-home (%) Difference (%) Home (%) Avg. pre/post-home (%) Difference (%)
France 7.43 6.55 0.88 5.83 1.54 4.29
Norway 18.02 8.88 9.15 15.57 13.10 2.47
Japan 11.05 0.83 10.22 5.11 1.55 3.56
USA 15.40 8.66 6.74 14.26 8.57 5.69
Italy 4.02 3.19 0.83 4.17 3.43 0.73
Canada 11.43 7.44 3.99 11.80 9.42 2.38
[image:8.595.51.545.279.409.2]research, potential factors that may elevate the perfor-mance of competitors when competing at home include: learning factors (i.e. familiarity with the venue), particu-larly in alpine skiing [13, 18]; higher testosterone levels [21]; the absence of jet lag associated with travel [22].
When comparing home advantage in the Winter Para-lympic Games with the Winter OPara-lympic Games for the last seven host nations (1992–2014), we found that host nations typically performed better at home in both competitions in this time frame and that home advantage was generally more pronounced (albeit not a statistically significant dif-ference) in the case of the Winter Paralympic Games. The reasons underpinning the differences in the magnitude of home advantage between the two competitions at both country level and sport-specific level are worthy of further investigation.
Conclusion
This research has extended the evidence base of home advantage in international multi-sport events and, to the best of our knowledge, is the first formal attempt to examine home advantage in the context of a para sport competition. In summary, there is clear evidence of a home advantage effect in the Winter Paralympic Games at country level and its magnitude appears to be greater than in the Winter Olympic Games. In addition to investigating
the factors that contribute to these findings, future research should apply similar methods to the Summer Paralympic Games, which incorporates more sports and events.
Compliance with ethical standards
Conflict of interest The authors declare that they have no conflict of interest.
Ethical approval The study utilises secondary data, which is open-access and available freely from the internet. There are no ethical issues involved in the analysis of the data as they were not gathered from participants.
Informed consent For this type of study formal consent is not required.
Open Access This article is distributed under the terms of the Creative Commons Attribution 4.0 International License (http://crea tivecommons.org/licenses/by/4.0/), which permits unrestricted use, distribution, and reproduction in any medium, provided you give appropriate credit to the original author(s) and the source, provide a link to the Creative Commons license, and indicate if changes were made.
References
1. Courneya KS, Carron AV (1992) The home advantage in sport competitions: a literature review. J Sport Exerc Psychol 14:13–27 2. Carron AV, Loughhead TM, Bray SR (2005) The home advan-tage in sport competitions: Courneya and Carron’s (1992) con-ceptual framework a decade later. J Sports Sci 23:395–407
[image:9.595.85.508.57.336.2]3. Jamieson J (2010) The home field advantage in athletics: a meta-analysis. J Appl Soc Psychol 40:1819–1848. doi: 10.1111/j.1559-1816.2010.00641.x
4. Pollard R, Pollard G (2005) Long-term trends in home advantage in professional team sports in North America and England (1876–2003). J Sports Sci 23:337–350. doi:10.1080/ 02640410400021559
5. Jones MB (2013) The home advantage in individual sports: an augmented review. Psychol Sport Exerc 14:397–404. doi:10. 1016/j.psychsport.2013.01.002
6. Balmer NJ, Nevill AM, Williams M (2003) Modelling home advantage in the Summer Olympic Games. J Sports Sci 21:469–478. doi:10.1080/0264041031000101890
7. Nevill AM, Balmer NJ, Winter EM (2009) Why Great Britain’s success in Beijing could have been anticipated and why it should continue beyond 2012. Br J Sports Med 43:1108–1110. doi:10. 1136/bjsm.2008.057174
8. Nevill AM, Balmer NJ, Winter EM (2012) Congratulations to team GB, but why should we be so surprised? Olympic medal count can be predicted using logit regression models that include ‘‘home advantage’’. Br J Sports Med 46:958–959. doi:10.1136/ bjsports-2012-091719
9. Shibli S, Bingham J (2008) A forecast of the performance of China in the Beijing Olympic Games 2008 and the underlying performance management issues. Manag Leisure 13:272–292. doi:10.1080/13606710802200977
10. Shibli S, Gratton C, Bingham J (2012) A forecast of the perfor-mance of Great Britain and Northern Ireland in the London 2012 Olympic Games. Manag Leisure 17:274–290. doi:10.1080/ 13606719.2012.674399
11. Franchini E, Takito MY (2016) Home advantage in combat sports during the Olympic Games. Sport Sci Health 12:287. doi:10. 1007/s11332-016-0286-9
12. Pettigrew S, Reiche D (2016) Hosting the Olympic Games: an overstated advantage in sports history. Int J Hist Sport 33:635–647. doi:10.1080/09523367.2015.1132201
13. Balmer NJ, Nevill AM, Williams M (2001) Home advantage in the Winter Olympics (1908–1998). J Sports Sci 19:129–139. doi:10.1080/026404101300036334
14. Koning RH (2005) Home advantage in speed skating: evidence from individual data. J Sports Sci 23:417–427. doi:10.1080/ 026404104-00021625
15. Ramchandani G, Wilson D (2010) Home advantage in the Commonwealth Games. S Afr J Sports Med 22:8–11
16. Ramchandani G, Wilson D (2011) Do differences in gender and sport affect home advantage? A case study of the Commonwealth Games. Int J Perform Anal Sport 11:510–521
17. Ramchandani G, Wilson D (2012) India’s performance in the Delhi 2010 Commonwealth Games: expected or otherwise? Manag Leisure 17:257–273. doi:10.1080/13606719.2012.674398
18. Bray SR, Carron AV (1993) The home advantage in alpine ski-ing. Aust J Sci Med Sport 25:76–81
19. Go´mez MA, DelaSerna A, Lupo C, Sampaio J (2014) Effects of situational variables and starting quarter score in the outcome of elite women’s water polo game quarters. Int J Perform Anal Sport 14:73–83
20. Ruano MA, DelaSerna A, Lupo C, Sampaio J (2016) Effects of game location, quality of opposition and starting quarter score in the outcome of elite water polo quarters. J Strength Cond Res 30:1014–1020
21. Neave N, Wolfson S (2003) Testosterone, territoriality, and the ‘home advantage’. Physiol Behav 78:269–275. doi:10.1016/ S0031-9384(02)00969-1