organic papers
o822
Srinivas Basavojuet al. C7H7NO2S doi:10.1107/S1600536805005568 Acta Cryst.(2005). E61, o822–o823
Acta Crystallographica Section E Structure Reports Online
ISSN 1600-5368
2-(Methylsulfanyl)nicotinic acid
Srinivas Basavoju, C. Malla Reddy and Gautam R. Desiraju*
School of Chemistry, University of Hyderabad, Hyderabad 500 046, India
Correspondence e-mail: gautam_desiraju@yahoo.com
Key indicators
Single-crystal X-ray study
T= 298 K
Mean(C–C) = 0.005 A˚
Rfactor = 0.071
wRfactor = 0.177
Data-to-parameter ratio = 13.9
For details of how these key indicators were automatically derived from the article, see http://journals.iucr.org/e.
#2005 International Union of Crystallography Printed in Great Britain – all rights reserved
The title compound, C7H7NO2S, forms centrosymmetric acid
dimers which are connected through weak C—H O
inter-actions to form a tape. Adjacent tapes are arranged in a zigzag fashion with weak methyl–methyl interactions.
Comment
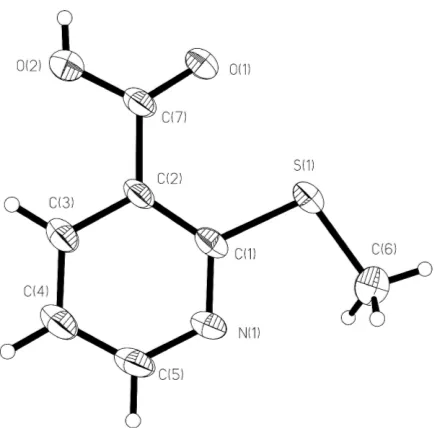
In the course of our research on intermolecular interactions, the crystal structure of 2-(methylsulfanyl)nicotinic acid, (I) (Fig. 1), was undertaken. Coordination polymers of (I) with SnIIand CuIIhave been reported (Gielenet al., 1992; Mikloset al., 2001; Segl’aet al., 2004). The acid group of (I) binds to the
central Sn atom in
2O,O0)tin(II) as a bidentate ligand (Gielen et al., 1992).
Compound (I) acts as a counter-ion in diaqua(diethylenetri-amine)copper(II) bis(2-methylthionicotinate), (Miklos et al., 2001), while in diaquabis(2-methylthionicotinato-2O,O0
)-dipyridylcopper(II), it acts as a monodentate ligand (Segl’aet al., 2004).
The molecule is nearly planar and forms centrosymmetric acid dimers via O2—H1 O1i hydrogen bonds [1.85 (5) A˚ and 169 (5); symmetry code: (i) x, 1y, 1z]. These
dimers are connected via weak C3—H3 O2ii [2.63 A˚ and
141; symmetry code: (ii) 1x, 1y, z] and C4—
H4 O1iii [2.70 A˚ and 157; symmetry code: (iii) 1 +x, y,
1 +z] interactions parallel to the (272) or (272) planes to form tapes (Fig. 2). Translation-related tapes are stacked along [100] (Fig. 3). Adjacent tapes are arranged in a zigzag fashion with weak methyl–methyl interactions (Fig. 3). Surprisingly, the pyridine group is not intermolecularly bonded to the carboxylic acid groupviaO—H N hydrogen bonds, because of steric hindrance created by the presence of the SMe group. There are no short contacts to the S and N atoms.
Crystal data
C7H7NO2S
Mr= 169.20
Monoclinic,P21=c
a= 3.9834 (10) A˚
b= 25.373 (7) A˚
c= 7.465 (2) A˚ = 101.380 (4)
V= 739.7 (3) A˚3
Z= 4
Dx= 1.519 Mg m3
MoKradiation Cell parameters from 1108
reflections = 3.2–26.5 = 0.38 mm1
T= 298 (2) K Block, colourless 0.200.130.10 mm
Data collection
Bruker SMART APEX CCD area-detector diffractometer ’and!scans
Absorption correction: multi-scan (SADABS; Sheldrick, 2003)
Tmin= 0.943,Tmax= 0.960 4393 measured reflections
1462 independent reflections 1181 reflections withI> 2(I)
Rint= 0.040 max= 26.1
h=4!4
k=31!28
l=9!8
Refinement
Refinement onF2
R[F2> 2(F2)] = 0.071
wR(F2) = 0.177
S= 1.10 1462 reflections 105 parameters
H atoms treated by a mixture of independent and constrained refinement
w= 1/[2(F
o2) + (0.0967P)2
+ 0.4717P]
whereP= (Fo2+ 2Fc2)/3
(/)max< 0.001
max= 0.95 e A˚3
min=0.38 e A˚3
The carboxylic acid H atom was located in a difference map and refined freely. Other H atoms were positioned geometrically (C—H = 0.93–0.96 A˚ ) and allowed to ride on their parent atoms, withUiso(H) =
1.2 (aromatic) or 1.5 (methyl) timesUeq(H).
Data collection:SMART(Bruker, 1997); cell refinement:SAINT
(Bruker, 1997); data reduction:SAINT; program(s) used to solve structure:SHELXS97(Sheldrick, 1990); program(s) used to refine structure: SHELXL97 (Sheldrick, 1997); molecular graphics:
SHELXTL (Bruker, 2000); software used to prepare material for publication:SHELXTL.
BS and CMR thank the CSIR for Senior Research Fellowships. Financial assistance from the DST (IRPHA) and the UGC (UPE) is acknowledged.
References
Bruker (1997).SMART(Version 5.054) andSAINT(Version 6.02). Bruker AXS Inc., Madison, Wisconsin, USA.
Bruker (2000). SHELXTL. Version 6.12. Bruker AXS Inc., Madison, Wisconsin, USA.
[image:2.610.63.280.71.285.2]Gielen, M., Khloufi, A. E., Biesemans, M. & Willem, R. (1992).Polyhedron, 11, 1861–1868.
Figure 2
[image:2.610.47.296.333.504.2]The zigzag arrangement of molecules in (I), showing O—H O and C— H O hydrogen bonds (dashed lines) parallel to the (272) or (272) plane forming tapes.
Figure 3
The stacking of dimers in (I).
Figure 1
[image:2.610.45.298.557.660.2]supporting information
sup-1 Acta Cryst. (2005). E61, o822–o823
supporting information
Acta Cryst. (2005). E61, o822–o823 [https://doi.org/10.1107/S1600536805005568]
2-(Methylsulfanyl)nicotinic acid
Srinivas Basavoju, C. Malla Reddy and Gautam R. Desiraju
2-(methylsulfanyl)nicotinic acid
Crystal data C7H7NO2S
Mr = 169.20
Monoclinic, P21/c
Hall symbol: -P 2ybc a = 3.9834 (10) Å b = 25.373 (7) Å c = 7.465 (2) Å β = 101.380 (4)° V = 739.7 (3) Å3
Z = 4
F(000) = 352 Dx = 1.519 Mg m−3
Melting point: 489(1) K Mo Kα radiation, λ = 0.71073 Å Cell parameters from 1108 reflections θ = 3.2–26.5°
µ = 0.38 mm−1
T = 298 K Plate, colourless 0.20 × 0.13 × 0.10 mm
Data collection
Bruker APEX CCD area-detector diffractometer
Radiation source: fine-focus sealed tube Graphite monochromator
φ and ω scans
Absorption correction: multi-scan (SADABS; Sheldrick, 2003) Tmin = 0.943, Tmax = 0.960
4393 measured reflections 1462 independent reflections 1181 reflections with I > 2σ(I) Rint = 0.040
θmax = 26.1°, θmin = 1.6°
h = −4→4 k = −31→28 l = −9→8
Refinement Refinement on F2
Least-squares matrix: full R[F2 > 2σ(F2)] = 0.071
wR(F2) = 0.177
S = 1.10 1462 reflections 105 parameters 0 restraints
Primary atom site location: structure-invariant direct methods
Secondary atom site location: difference Fourier map
Hydrogen site location: inferred from neighbouring sites
H atoms treated by a mixture of independent and constrained refinement
w = 1/[σ2(F
o2) + (0.0967P)2 + 0.4717P]
where P = (Fo2 + 2Fc2)/3
(Δ/σ)max < 0.001
Δρmax = 0.95 e Å−3
Special details
Experimental. Crystals were grown by slow evaporation from CH2Cl2.
Geometry. All e.s.d.'s (except the e.s.d. in the dihedral angle between two l.s. planes) are estimated using the full covariance matrix. The cell e.s.d.'s are taken into account individually in the estimation of e.s.d.'s in distances, angles and torsion angles; correlations between e.s.d.'s in cell parameters are only used when they are defined by crystal symmetry. An approximate (isotropic) treatment of cell e.s.d.'s is used for estimating e.s.d.'s involving l.s. planes.
Refinement. Refinement of F2 against ALL reflections. The weighted R-factor wR and goodness of fit S are based on F2,
conventional R-factors R are based on F, with F set to zero for negative F2. The threshold expression of F2 > σ(F2) is used
only for calculating R-factors(gt) etc. and is not relevant to the choice of reflections for refinement. R-factors based on F2
are statistically about twice as large as those based on F, and R- factors based on ALL data will be even larger.
Fractional atomic coordinates and isotropic or equivalent isotropic displacement parameters (Å2)
x y z Uiso*/Ueq
S1 0.3813 (2) 0.34163 (4) 0.37952 (12) 0.0363 (3) O1 0.1700 (7) 0.44260 (11) 0.4572 (3) 0.0447 (8) O2 −0.2128 (8) 0.49028 (13) 0.2688 (4) 0.0484 (8) N1 0.1442 (9) 0.33262 (12) 0.0244 (4) 0.0374 (8) C2 −0.0170 (9) 0.41345 (14) 0.1509 (4) 0.0283 (8) C3 −0.1943 (10) 0.42809 (16) −0.0213 (5) 0.0356 (9)
H3 −0.3120 0.4599 −0.0362 0.043*
C1 0.1507 (8) 0.36425 (15) 0.1674 (5) 0.0288 (8) C7 −0.0112 (9) 0.44975 (15) 0.3054 (5) 0.0312 (8) C4 −0.1972 (10) 0.39582 (17) −0.1699 (5) 0.0420 (10)
H4 −0.3102 0.4054 −0.2865 0.050*
C6 0.5264 (11) 0.27830 (17) 0.3177 (6) 0.0461 (10)
H6A 0.3325 0.2559 0.2761 0.069*
H6B 0.6711 0.2626 0.4222 0.069*
H6C 0.6531 0.2826 0.2218 0.069*
C5 −0.0258 (11) 0.34893 (17) −0.1380 (5) 0.0417 (10)
H5 −0.0283 0.3267 −0.2374 0.050*
H1 −0.186 (11) 0.513 (2) 0.344 (7) 0.051 (14)*
Atomic displacement parameters (Å2)
U11 U22 U33 U12 U13 U23
supporting information
sup-3 Acta Cryst. (2005). E61, o822–o823
Geometric parameters (Å, º)
S1—C1 1.763 (4) C2—C7 1.473 (5)
S1—C6 1.798 (4) C3—C4 1.378 (6)
O1—C7 1.231 (4) C3—H3 0.9300
O2—C7 1.300 (4) C4—C5 1.369 (6)
O2—H1 0.79 (5) C4—H4 0.9300
N1—C1 1.332 (5) C6—H6A 0.9600
N1—C5 1.332 (5) C6—H6B 0.9600
C2—C3 1.389 (5) C6—H6C 0.9600
C2—C1 1.410 (5) C5—H5 0.9300
C1—S1—C6 101.38 (19) O2—C7—C2 114.6 (3)
C7—O2—H1 115 (3) C5—C4—C3 116.8 (4)
C1—N1—C5 117.9 (3) C5—C4—H4 121.6
C3—C2—C1 117.6 (3) C3—C4—H4 121.6
C3—C2—C7 118.9 (3) S1—C6—H6A 109.5
C1—C2—C7 123.5 (3) S1—C6—H6B 109.5
C4—C3—C2 120.6 (4) H6A—C6—H6B 109.5
C4—C3—H3 119.7 S1—C6—H6C 109.5
C2—C3—H3 119.7 H6A—C6—H6C 109.5
N1—C1—C2 122.0 (3) H6B—C6—H6C 109.5
N1—C1—S1 116.6 (3) N1—C5—C4 125.1 (4)
C2—C1—S1 121.4 (3) N1—C5—H5 117.5
O1—C7—O2 122.4 (3) C4—C5—H5 117.5