Complex magnetic ordering in the oxide selenide
Sr2Fe3Se2O3
CASSIDY, Simon J., ORLANDI, Fabio, MANUEL, Pascal, HADERMANN,
Joke, SCRIMSHIRE, Alex <http://orcid.org/0000-0002-6828-3620>,
BINGHAM, Paul <http://orcid.org/0000-0001-6017-0798> and CLARKE,
Simon J.
Available from Sheffield Hallam University Research Archive (SHURA) at:
http://shura.shu.ac.uk/22028/
This document is the author deposited version. You are advised to consult the
publisher's version if you wish to cite from it.
Published version
CASSIDY, Simon J., ORLANDI, Fabio, MANUEL, Pascal, HADERMANN, Joke,
SCRIMSHIRE, Alex, BINGHAM, Paul and CLARKE, Simon J. (2018). Complex
magnetic ordering in the oxide selenide Sr2Fe3Se2O3. Inorganic Chemistry, 57 (16),
10312-10322.
Copyright and re-use policy
See
http://shura.shu.ac.uk/information.html
S1
Complex magnetic ordering in the oxide selenide
Sr
2
Fe
3
Se
2
O
3
Simon J Cassidy,
1Fabio Orlandi,
2Pascal Manuel,
2Joke Hadermann,
3Alex Scrimshire,
4Paul A Bingham
4and Simon J Clarke
1*1
Department of Chemistry, University of Oxford, Inorganic Chemistry Laboratory, South Parks Road, Oxford, OX1 3QR, UK. 2ISIS Facility, STFC Rutherford Appleton Laboratory, Harwell Oxford, Didcot OX11 0QX, United Kingdom. 3Electron Microscopy for Materials Science (EMAT), University of Antwerp, Groenenborgerlaan 171, B-2020 Antwerp, Belgium.,
4
Materials and Engineering Research Institute, Faculty of Arts, Computing, Engineering and Sciences, Sheffield Hallam University, City Campus, Howard Street, Sheffield, S1 1WB,UK.
Supplementary Material
*Corresponding author
S2
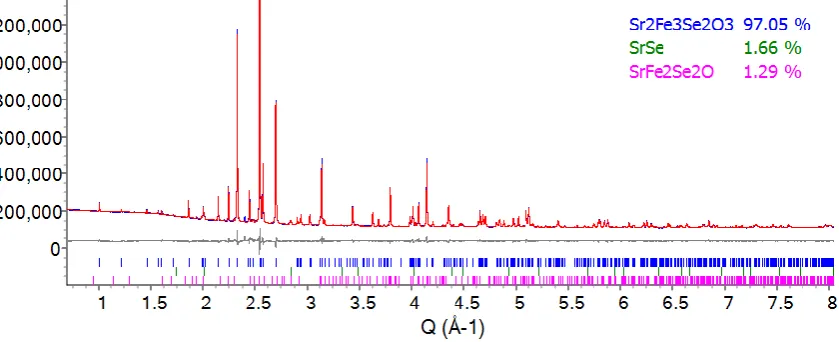
Figure S1 Rietveld refinement against PXRD pattern of Sr2Fe3Se2O3 sample A taken at room temperature using the
Mythen detector of the I11 diffractometer at Diamond Light Source.
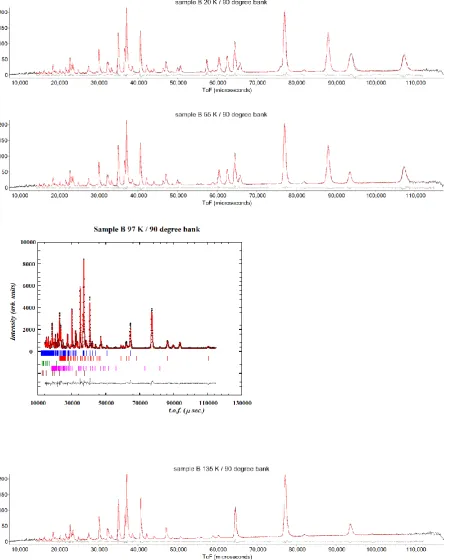
Figure S2 Rietveld refinement of Sr2Fe3Se2O3 sample A at 92 K showing the coexistence of the commensurate and
incommensurate magnetic phases at TINC. The material shows only the commensurate magnetic structure at and
[image:3.595.45.485.269.592.2]S3 Description of the magnetic models using ISODISTORT
As described in the main text, between 55 (TN2) and 91 K (TINC), one of the two Fe sites shows commensurate
magnetic order with k-point U (½, 0, ½). The neutron diffraction data may be described with either the Fe2 sites; using mU2(a,0) modes with mU2[Fe2:h:mag]A’_1(a) constrained to be equal to minus mU2[Fe2:h:mag]A’_2(a), or the Fe1 sites; using the mU1(a,0) mode [Fe1:a:mag]mU1Ag(a). Equivalent fits can be achieved with either site, however using the Fe1 sites gives an ordered moment at 55K of 4.75 µB which is unrealistic for an Fe2+ ion. The
conclusion that it is the Fe2 sites ordering in this regime is consistent with the Mössbauer data, which show the more abundant site to be the one that is ordered. An equivalent case occurs in the incommensurate region between
TINCand 118K (TN1), in which the magnetic scattering occurs with k-point A (a, 0, ½) and can be described by either
the Fe2 site with mA2 modes or Fe1 site with mA1 modes.
Below TN2 the Fe1 sites order, with k point S (k=½, ½, 0). In determining the model, the six ordering modes
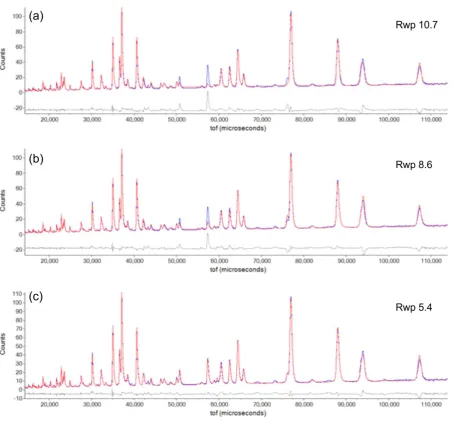
associated with this k-point for the Fe1 sites were tried: mS3+S4+ [Fe1:a:mag]Bg_1(a), mS3+S4+ [Fe1:a:mag]Bg_1(b), mS3+S4+ [Fe1:a:mag]Bg_2(a), mS3+S4+ [Fe1:a:mag]Bg_2(b), mS1+S2+ [Fe1:a:mag]Ag(a) and mS1+S2+ [Fe1:a:mag]Ag(b). Of these six, a combination of the four mS3+4+ modes: Bg_1(a,a) and Bg_2(a,a) gives a reasonable model, but does not give a satisfactory fit to the data, shown in Figure S3(a). The fit can be improved slightly by allowing all six terms to refine freely {mS3+S4+ Bg_1(a,b), mS3+S4+ Bg_2(a,b), mS1+S2+ Ag(a,b)} but even this gives a poor statistical and visual fit, which indicates that the data cannot be fitted with these modes alone, as shown in Figure S3(b). Inclusion of the Fe2 sites in the model was carried out by refining the combinations of the twelve modes associated with the S k-point for the Fe2 sites alongside those of the Fe1 sites. Of these twelve, only a combination of the mS3+S4+[Fe2:h:mag] modes gave significant improvement to the fit: refining mS3+S4+[Fe2:h:mag]A’’_1(a,a) and mS3+S4+[Fe2:h:mag]A’’_2(a,a) as well as mS3+S4+ [Fe1:a:mag]Bg_1(a,a) and mS3+S4+ [Fe1:a:mag]Bg_2(a,a). This produces a good statistical and visual fit, shown in Figure S3(c), with a reasonable magnetic model. If all 18 terms are allowed to refine freely of one another and produce a nonsensical model, only a minimal improvement in the agreement factor can be achieved (5.4 % vs 5.2 %), indicating the model represents a global minimum in the refinement.
The overall magnetic model uses five parameters to describe the ordering of the 32 Fe2 and 16 Fe1 atoms in the 2anucl × 2bnucl × 2cnucl magnetic cell: one for the major component of the Fe2 ordering (described by
S4
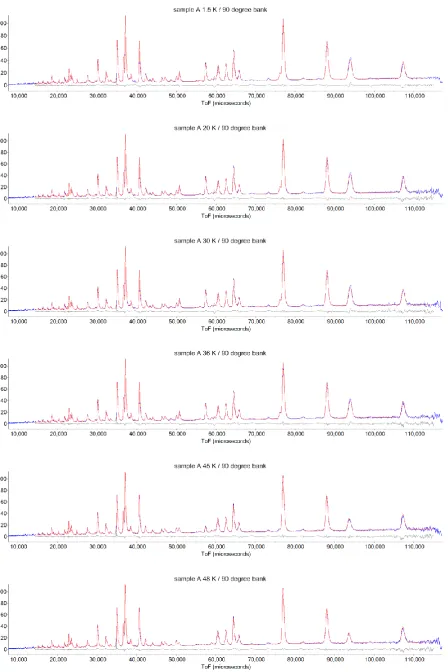
Figure S3 WISH bank 3/8 of a Rietveld refinement of the neutron diffraction pattern of sample A at 1.5K. (a) refinement of the model using only the Fe1 sites to account for the S-point magnetic scattering with all Fe1 atoms carrying the same moment. (b)
Refinement of the model using only the Fe1 sites to account for the S-point magnetic scattering but allowing the free refinement of the parameters such that different atoms can have different moments. (c) Refinement of the model using both the Fe1 and
S5
Figure S4 X-ray diffraction patterns of Sample A taken using the MAC detector of the ID22 diffractometer at the ESRF. The red pattern was taken at room temperature and the blue pattern at 5 K. No evidence of splitting in the
strongest structural peaks is observed.
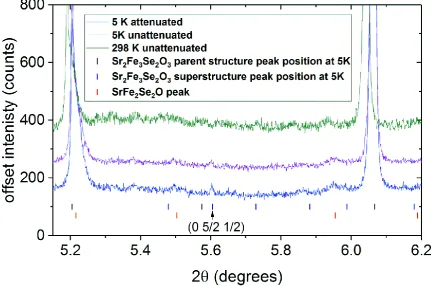
Figure S5 Powder X-ray diffraction of sample A taken at ID22 (λ=0.35440(Å)). The data taken at 5K (blue line) show the presence of a very weak peak at 5.6° coincident with the position of the 0 5/2 ½ reflection expected from the magnetic structure and symmetry analysis. This peak appears weaker in the pattern taken with the unattenuated beam (purple line), which while measured in the cryostat at 5K is estimated to be between 30 and 60 K based on the
[image:6.595.81.513.250.536.2]S6
[image:7.595.32.482.134.431.2]Tables of unit cell information in the paramagnetic regime.
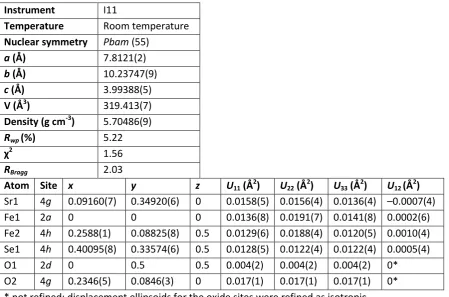
Table S1 Refined atomic parameters against synchrotron powder diffraction data for sample B, corresponding to the data in Table 1 in the main paper. Peakshape asymmetry was observed in this high resolution data. Attempting to refine the asymmetry as 2 phases with different lattice parameters produced an improved fit, but no differences in the occupancies or positions of the atoms could be discerned between the phases. Since no physical origin for this asymmetry could be established, it was instead handled with an arbitrary asymmetric peakshape function.
Instrument I11
Temperature Room temperature
Nuclear symmetry Pbam (55)
a (Å) 7.8121(2)
b (Å) 10.23747(9)
c (Å) 3.99388(5)
V (Å3) 319.413(7)
Density (g cm-3) 5.70486(9)
Rwp (%) 5.22
χ2 1.56
RBragg 2.03
Atom Site x y z U11 (Å2) U22 (Å2) U33 (Å2) U12 (Å2)
S7
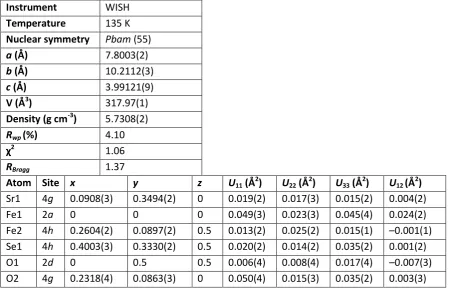
Table S2 refinement parameters from WISH at 135K for sample B, corresponding to the data in Table 1 in the main paper.
Instrument WISH
Temperature 135 K
Nuclear symmetry Pbam (55)
a (Å) 7.8003(2)
b (Å) 10.2112(3)
c (Å) 3.99121(9)
V (Å3) 317.97(1)
Density (g cm-3) 5.7308(2)
Rwp (%) 4.10
χ2 1.06
RBragg 1.37
Atom Site x y z U11 (Å2) U22 (Å2) U33 (Å2) U12 (Å2)
S8
Tables of structural information in the Fe2 ordered regime
Table S3 refinement parameters from WISH at 55K for the nuclear cell of sample B, corresponding to the data in Table 1 in the main paper.
Instrument WISH
Temperature 55 K
Nuclear symmetry Pbam (55)
a (Å) 7.7963(2)
b (Å) 10.2008(3)
c (Å) 3.98951(9)
V (Å3) 317.18(1)
Density (g cm-3) 5.7452(2)
Rwp (%) 4.55
χ2 1.17
RBragg 1.55
Atom Site x y z U11 (Å2) U22 (Å2) U33 (Å2) U12 (Å2)
[image:9.595.33.482.94.393.2]Sr1 4g 0.0889(3) 0.3519(2) 0 0.019(2) 0.018(3) 0.019(2) –0.001(2) Fe1 2a 0 0 0 0.057(4) 0.015(3) 0.056(4) 0.023(2) Fe2 4h 0.2569(2) 0.0893(2) 0.5 0.020(2) 0.027(2) 0.012(1) 0.003(2) Se1 4h 0.4000(3) 0.3327(2) 0.5 0.021(2) 0.030(3) 0.030(2) –0.008(2) O1 2d 0 0.5 0.5 0.001(4) 0.002(4) 0.008(4) 0.001(3) O2 4g 0.2278(3) 0.0862(3) 0 0.038(4) 0.009(3) 0.051(3) –0.001(3)
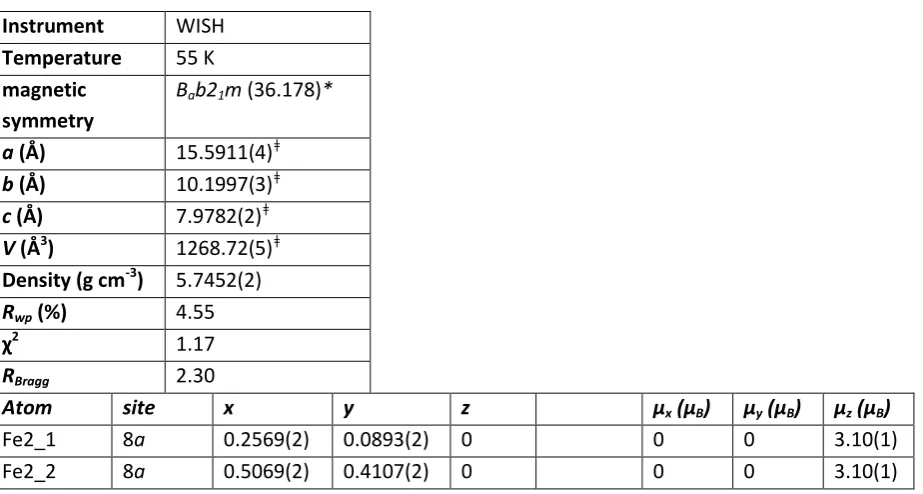
Table S4 refinement parameters from WISH at 55K for the magnetic cell of sample B, corresponding to the data in Table 1 in the main paper.
Instrument WISH
Temperature 55 K
magnetic symmetry
Bab21m (36.178)*
a (Å) 15.5911(4)ǂ
b (Å) 10.1997(3)ǂ
c (Å) 7.9782(2)ǂ
V (Å3) 1268.72(5)ǂ
Density (g cm-3) 5.7452(2)
Rwp(%) 4.55
χ2 1.17
RBragg 2.30
Atom site x y z µx (µB) µy (µB) µz (µB)
Fe2_1 8a 0.2569(2) 0.0893(2) 0 0 0 3.10(1) Fe2_2 8a 0.5069(2) 0.4107(2) 0 0 0 3.10(1)
*This is a non standard setting of Camc21, used in order maintain the same axis orientation as used for the nuclear
[image:9.595.35.497.452.699.2]S9
Tables of structural information in the Fe1 and Fe2 ordered regime
Table S5 refinement parameters from WISH at 20K for the nuclear cell of sample B, corresponding to the data in Table 1 in the main paper.
Instrument WISH
Temperature 20 K
Nuclear symmetry Pbam (55)
a (Å) 7.7945(2)
b (Å) 10.1979(3)
c (Å) 3.9893(1)
V (Å3) 317.10(1)
Density (g cm-3) 5.7465(3)
Rwp (%) 4.61
χ2 1.21
RBragg 1.99
Atom Site x y z U11 (Å2) U22 (Å2) U33 (Å2) U12 (Å2)
S10
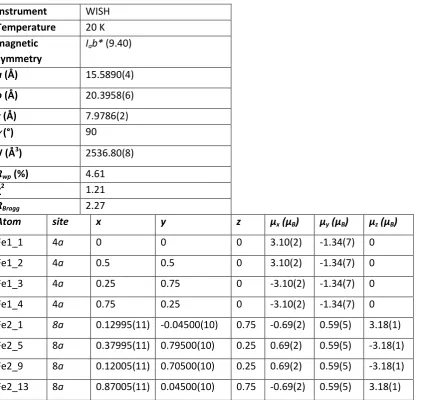
Table S6 refinement parameters from WISH at 20K for the magnetic cell of sample B, corresponding to the data in Table 1 in the main paper.
Instrument WISH
Temperature 20 K
magnetic symmetry
Iab* (9.40)
a (Å) 15.5890(4)
b (Å) 20.3958(6)
c (Å) 7.9786(2)
(°) 90
V (Å3) 2536.80(8)
Rwp (%) 4.61
χ2 1.21
RBragg 2.27
Atom site x y z µx (µB) µy (µB) µz (µB)
Fe1_1 4a 0 0 0 3.10(2) -1.34(7) 0 Fe1_2 4a 0.5 0.5 0 3.10(2) -1.34(7) 0 Fe1_3 4a 0.25 0.75 0 -3.10(2) -1.34(7) 0 Fe1_4 4a 0.75 0.25 0 -3.10(2) -1.34(7) 0 Fe2_1 8a 0.12995(11) -0.04500(10) 0.75 -0.69(2) 0.59(5) 3.18(1) Fe2_5 8a 0.37995(11) 0.79500(10) 0.25 0.69(2) 0.59(5) -3.18(1) Fe2_9 8a 0.12005(11) 0.70500(10) 0.25 0.69(2) 0.59(5) -3.18(1) Fe2_13 8a 0.87005(11) 0.04500(10) 0.75 -0.69(2) 0.59(5) 3.18(1)
*This is a non standard setting of space group Ccc (9.40 in BNS notation), used in order maintain the same axis
S11
S16
S17
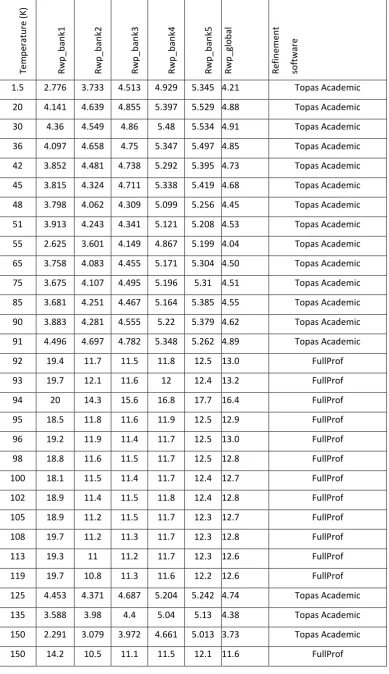
Table S7. Agreement factors for modelling of the neutron diffraction data of sample A
Te m p era tu re ( K) Rw p _b an k1 Rw p _b an k2 Rw p _b an k3 Rw p _b an k4 Rw p _b an k5 Rw p _glob al Re fin em en t so ftwar e
1.5 2.776 3.733 4.513 4.929 5.345 4.21 Topas Academic
20 4.141 4.639 4.855 5.397 5.529 4.88 Topas Academic
30 4.36 4.549 4.86 5.48 5.534 4.91 Topas Academic
36 4.097 4.658 4.75 5.347 5.497 4.85 Topas Academic
42 3.852 4.481 4.738 5.292 5.395 4.73 Topas Academic
45 3.815 4.324 4.711 5.338 5.419 4.68 Topas Academic
48 3.798 4.062 4.309 5.099 5.256 4.45 Topas Academic
51 3.913 4.243 4.341 5.121 5.208 4.53 Topas Academic
55 2.625 3.601 4.149 4.867 5.199 4.04 Topas Academic
65 3.758 4.083 4.455 5.171 5.304 4.50 Topas Academic
75 3.675 4.107 4.495 5.196 5.31 4.51 Topas Academic
85 3.681 4.251 4.467 5.164 5.385 4.55 Topas Academic
90 3.883 4.281 4.555 5.22 5.379 4.62 Topas Academic
91 4.496 4.697 4.782 5.348 5.262 4.89 Topas Academic
92 19.4 11.7 11.5 11.8 12.5 13.0 FullProf
93 19.7 12.1 11.6 12 12.4 13.2 FullProf
94 20 14.3 15.6 16.8 17.7 16.4 FullProf
95 18.5 11.8 11.6 11.9 12.5 12.9 FullProf
96 19.2 11.9 11.4 11.7 12.5 13.0 FullProf
98 18.8 11.6 11.5 11.7 12.5 12.8 FullProf
100 18.1 11.5 11.4 11.7 12.4 12.7 FullProf
102 18.9 11.4 11.5 11.8 12.4 12.8 FullProf
105 18.9 11.2 11.5 11.7 12.3 12.7 FullProf
108 19.7 11.2 11.3 11.7 12.3 12.8 FullProf
113 19.3 11 11.2 11.7 12.3 12.6 FullProf
119 19.7 10.8 11.3 11.6 12.2 12.6 FullProf
125 4.453 4.371 4.687 5.204 5.242 4.74 Topas Academic
135 3.588 3.98 4.4 5.04 5.13 4.38 Topas Academic
150 2.291 3.079 3.972 4.661 5.013 3.73 Topas Academic
S18
[image:19.595.173.422.125.738.2]