Water deficit is a stress factor whose implications very often lead towards the decrease in agriculture production. Current climatic changes induce not only dramatic fluctuations of the temperature, but as well as relatively non-uniform, irregular and random distribution of precipitation during the growing season. Considering these facts, a longer period of drought cannot be omitted either. Along with the increasing atmospheric CO2 concentration and raising temperature in continental regions, water deficit is one of the most discussed elements of global climatic changes.
Data obtained from meteorological stations in south Moravia from 1961 to 1990 aiming at the fre-quency of dry periods were analysed by Rožnovský (1998). He indicates that dry periods were found in more than 20% of the growing seasons. Thus we have to take into consideration that each two years from ten, precipitation sums in April and May will not exceed 20 mm. If we consider as-sumed climatic changes, an increasing number of dry periods can be envisioned. To complete these data, results from observations of the meteorologi-cal station at Kroměříž for the period of 1996–2003
can be added. The periods without precipitation longer than 6 days in April and May were found almost in each of these years (and more than once), periods longer than 11 days in three years.
Effects of water deficit on plants were studied at various levels (structural and functional) from ecophysiology up to cell metabolism. In cereal crops, a number of research studies have dealt with responses and adaptations of wheat and barley genotypes (for instance, Zemánek 1991, Švihra et al. 1996), others focused rather on the effect of water shortage than on plant growth and development, and yield formation. The effects of water deficit on plants depend on the stage of its ontogenetic devel-opment and duration of this stress factor. As Brestič (1996) reports, alleviation of drought implications can be highly effective for grain yield, nevertheless, possibilities of improving the status of the plants under water stress are limited. Of yield elements, the water stress before wheat anthesis causes the highest decrease in grain number per spike (Ali et al. 1999, Foulkes et al. 2002), and reduction in a number of developed tillers (Cabeza et al. 1993). In spring barley, drought affects a spike number
Effect of drought stress on the formation of yield elements
in spring barley and the potential of stress expression
reduction by foliar application of fertilizers
and growth stimulator
I. Svobodová, P. Míša
Agricultural Research Institute Kroměříž, Ltd., Czech Republic
ABSTRACT
Spring barley plants were exposed to water stress at different growth stages – from the period a�er emergence to the beginning of stem elongation, from emergence to the end of anthesis and from the beginning of stem elongation to the end of anthesis in pot experiments. In variants exposed to water deficit from emergence to the end of anthesis and from the beginning of stem elongation to the end of anthesis, effects of foliar fertilizers and Atonik preparation (ap-plied before the growth stage DC 30 or at DC 33) to lower the stress impacts were tested. During the growing season, formation and reduction of tillers, florets per spike and the yield structure at full ripeness were investigated. The wa-ter deficit at stem elongation caused a withering out of the established tillers, drought during the formation of the flo-rets reduced their number as well as their development into grains. In the variant where water stress was present to the beginning of stem elongation, the plants were able to compensate for stress implications by productive tillers that developed later (at stem elongation). The previous water deficit did not decrease 1000-grain weight, however protein content in grain increased due to low grain yield per pot. If foliar fertilizers and Atonik were applied before DC 30, a reduction of fertile florets decreased, which led to slight increase in a grain number per spike.
Keywords: spring barley; water stress; tillers; florets; yield; yield structure; yield elements; protein content; foliar fertilizers; Atonik
per plant or unit area more than a grain number per spike (Gonzales et al. 1999). Impacts of water stress on malting quality of spring barley were investigated, for example, by de Ruiter (1999).
The objective of pot experiments conducted at Kroměříž in 2002 and 2003 was to quantify the impact of water stress on yield, yield structure and formation of yield elements and to verify pos-sibilities of reducing it by application of the Atonik preparation or foliar fertilizers. Possibilities of af-fecting the water regime in cereals using growth regulators were investigated earlier. Recently, the anti-stress effects of foliar fertilizers in spring barley have been studied, for example, by Hudec et al. (2001), the stimulative effects of Atonik are exploited mostly in garden husbandry, at sugar-beet, poppy or oil-seed rape growing.
MATERIAL AND METHODS
The experiments were conducted in pots placed in a vegetation hall. The pots were filled with a mix-ture of 4 kg of soil (taken after the preceding crop sugar beet in the spring when spring barley was planted), 2 kg of sand and 6 g of NPK fertilizer (in 2003, the rate was reduced to 4 g due to a high protein content in grain in the previous year). Thirty grains of spring barley variety Kompakt were sown in every pot and after emergence, they were thinned to 15 plants per pot. Each of eight variants was carried out in 12 replications (pots).
The pots with the plants were placed on trol-leys outside the hall during the day. They were hidden under the roof for night and against rain. During the growing season, the plants were ex-posed to drought in some periods and effects of
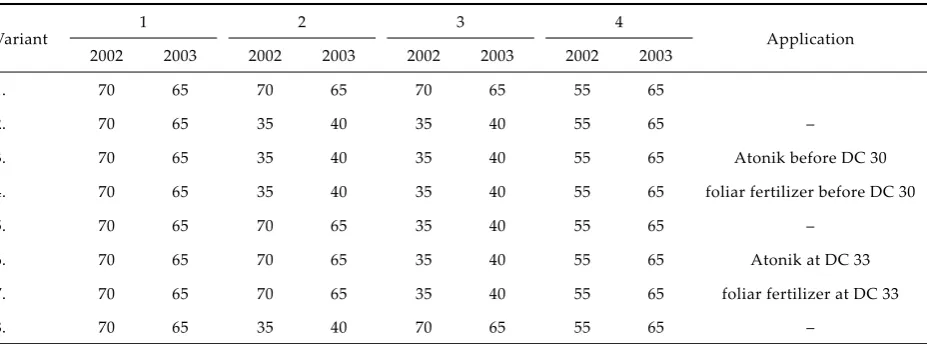
Atonik and/or foliar fertilizers (2002 – Campofort Garant P and Campofort Plus Mg; 2003 – Campofort Fortestim-alfa) aiming at lowering the effect of this stress were examined. The variants are listed in Table 1. When water regime was adjusted, those variants were selected which were supposed to show the highest effect on formation and reduction of yield elements. The Atonik preparation (sodium 2-nitrophenolate, 2 g/l; sodium 4-nitrophenolate, 3 g/l; sodium 5-nitroguaiacolate, 1 g/l) was ap-plied at the rate of 0.6 l/ha (0.1% solution, i.e. 600 l of water per hectare), foliar fertilizers Campofort Garant P and Campofort Plus Mg at rates of 5 kg/ha (2% solution), Campofort Forestim-alfa at the rate of 7 l/ha (2.5% solution).
In 2002, the optimum water supply was set up at a level of 70% of the holding water capacity (HWC) and stress was induced by its decrease to 35% of HWC. The influence of the stress was too strong and the measures to reduce its impacts showed to be ineffective. Therefore, in 2003 the level of holding water capacity was increased in stressed variants to 40% of HWC and at the same time, the holding water capacity in non-stressed variants was adjusted to 65% of HWC. The required water capacity was maintained by regular water supply based on the pot weight.
[image:2.595.67.531.560.732.2]During the growing season, a tiller number per plant was determined at DC 30 and DC 33, plants from three replications were taken at DC 33 to as-sess a number of initiated florets per spike (three single-flowered spikelets and/or their primordia at each node of the rachis were considered to be one floret) and dry weight of the above-ground part, and at DC 73 to determine a number of fertile florets per spike and dry weight of the above-ground part. In four replications at the stage of full ripeness,
Table 1. Experiment variants; periods with a certain water capacity (% of HWC – holding water capacity)
Variant 1 2 3 4 Application
2002 2003 2002 2003 2002 2003 2002 2003
1. 70 65 70 65 70 65 55 65
2. 70 65 35 40 35 40 55 65 –
3. 70 65 35 40 35 40 55 65 Atonik before DC 30
4. 70 65 35 40 35 40 55 65 foliar fertilizer before DC 30
5. 70 65 70 65 35 40 55 65 –
6. 70 65 70 65 35 40 55 65 Atonik at DC 33
7. 70 65 70 65 35 40 55 65 foliar fertilizer at DC 33
8. 70 65 35 40 70 65 55 65 –
grain yield per pot, spike and tiller numbers per plant and pot, grain numbers per spike and pot, 1000-grain weight, spike productivity, straw weight per pot, dry weight of the above-ground part, grain fraction above 2.5 mm and protein content in the grain fraction above 2.5 mm (in a bulk sample of all replications) were determined.
Since the experiments were focused on model-ling stress conditions in the period of formation and reduction particularly of tillers and florets per spikes (it corresponds to April and May under field conditions). From the anthesis the water rates for all variants were uniformly adjusted to 55 and 65% of HWC in 2002 and 2003, respectively, in order to affect the final yield by differences in grain weight at the lowest level.
Statistical assessments were carried out using STATGRAPHICS software, version 5.0 by analysis of variance (ANOVA) and the significance of the differences was tested by Tukey-test at 0.05 and 0.10.
RESULTS AND DISCUSSION
The obtained results (Tables 2–7) confirmed that spring barley plants exposed to a water deficit at earlier growth stages (from emergence to the beginning of stem elongation, variant 8) were able to compensate for the stress by the increase in a productive tiller number, if they came un-der favourable conditions. According to Brestič (1996), water deficits affecting plants at earlier stages of organogenesis can be compensated for by an activity of the root system and adaptation and rehydration support functions of self-regulat-ing systems. The acute water deficit in plants that were not adapted to drought and exposed to the stressor in a later period (from stem elongation to anthesis, variant 5) was much worse and tillers withered away. Similarly, a series of other studies (Cherry 1989, Calhoun et al. 1994, and Jamieson et al. 1995) report that if the stress is present at early growth stages only, its implications are smaller than those at later growth stages.
The formation and reduction of yield elements were similar in both years. Differences between the years are apparently caused by adjustments of water regimes in individual variants (reduction of water saturation from 70% of HWC in 2002 to 65% of HWC in 2003 in non-stressed variants, in-crease in soil water saturation from 35% of HWC in 2002 to 40% of HWC in 2003 in variants exposed to stress). Till DC 33, variants 1 and 8 established high tiller numbers, their reduction was low and a final spike number was higher than that in the other variants. Later tillers (after DC 33) devel-oped at a limited extent. In variants 2, 3 and 4,
where holding water capacity was lowered at the beginning of tillering, and in variants 5, 6 and 7, where holding water capacity was reduced at the beginning of stem elongation, spikes were mostly formed on main stems only. These vari-ants responded to the increased water supply in the period after anthesis by strong formation of later tillers, however the productive stems were not formed due to their delay in development. Reduction in a tiller number is considered as one of the implications of adaptation responses to the different water supply in plants of spring cereals as well as their growth regeneration after stress abating (Cabezza et al. 1993 and others).
A number of initiated florets per spike corre-sponded with a level of holding water capacity till the stage DC 31. Their reduction was highest in variant 2, which was exposed to the stress in the period after emergence up to the end of anthesis. However, the level of reduction of florets in indi-vidual variants was influenced also by a number of initiated florets, different holding water capacity between years, compensation relations to a spike number per pot and a level of assimilate sources. Brestič (1996) indicates that the development of florets into grains is decreased most considerably by the reduction of initiated florets under stress at the stem elongation stage as compared to stresses acting in the period of anthesis or grain filling only. Also Briggs et al. (1999) reported that water deficit in the period before anthesis induces increased sterility of florets in spike.
The water deficit in the period until the begin-ning of stem elongation in spring barley in 2002 positively affected the plant adaptation to drought. The yield in variant 2 was slightly higher than that in variant 5 due to a higher spike number. In 2003, higher yield was obtained in variant 5 (a high number of fertile florets developed into grains) in comparison with variant 2 at a basically identical spike number per pot. The different results in both years were obviously caused by differences in a water level between these years.
The protein content in grain negatively correlated with the total grain yield per pot (the higher yield – the lower protein content). By contrast, based on experiments conducted in New Zealand, de Ruiter (1999) states that nitrogen content in spring bar-ley grain was not affected by the different water supply, however he points out the negative effects of drought on some other parameters of malting quality.
Table 2. Quantification of water stress effects on yield elements formation and reduction, verification of potential reduction of stress impact – summarized results of pot experiments, 2002
Variant 1 2 3 4 5 6* 7
DC 30 DC 33 DC 91 DC 91 DC 91 DC 33 DC 73 DC 33 DC 73 DC 91 Water regime
1 2.74 4.37 3.06 0.63 44.6 36.2 19.5 13.79 44.38 52.07 2 1.00 1.69 1.34 2.64 16.8 30.1 16.6 4.37 12.25 23.68 5 2.74 3.15 1.10 2.30 13.6 34.5 19.8 8.87 17.37 25.89 8 1.00 3.70 3.22 0.29 39.5 30.9 17.2 4.72 26.91 40.44 α = 0.05 0.49 0.63 0.69 0.49 9.4 1.3 2.3 2.66 5.55 4.80 Application before DC 30
2 1.00 1.69 1.34 2.64 16.8 30.1 16.6 4.37 12.25 23.68 3 1.00 1.67 1.05 1.85 13.4 30.8 16.6 4.65 12.20 22.37 4 1.00 1.86 1.05 2.08 14.9 30.3 16.7 4.36 12.51 22.04
α = 0.05 0.50 0.37 0.51 3.51 1.8 2.1 0.73 1.47 1.95
Application at DC 33
5 2.74 3.15 1.10 2.30 13.6 34.5 19.8 8.87 17.37 25.89 6 2.74 3.15 1.17 2.32 15.1 34.5 19.1 8.87 17.08 27.73 7 2.74 3.15 1.33 2.23 14.1 34.5 19.6 8.87 16.80 27.33
α = 0.05 0.28 0.69 4.0 2.1 3.62 4.35
*three single-flowered spikelets and/or their primordia at each node of the rachis were considered to be one floret 1 = tiller number/plant, 2 = spike number/plant, 3 = tiller number/plant, 4 = grain number/plant,
5 = initiated floret number/spike, 6 = fertile floret number/spike, 7 = dry weight of above-ground part (g)
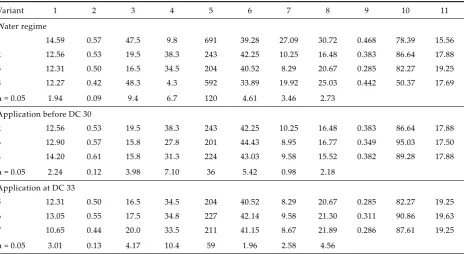
Table 3. Quantification of water stress effects on grain yield and quality, verification of potential reduction of stress impact – summarized results of pot experiments, 2002
Variant 1 2 3 4 5 6 7 8 9 10 11
Water regime
1 14.59 0.57 47.5 9.8 691 39.28 27.09 30.72 0.468 78.39 15.56 2 12.56 0.53 19.5 38.3 243 42.25 10.25 16.48 0.383 86.64 17.88 5 12.31 0.50 16.5 34.5 204 40.52 8.29 20.67 0.285 82.27 19.25 8 12.27 0.42 48.3 4.3 592 33.89 19.92 25.03 0.442 50.37 17.69 α = 0.05 1.94 0.09 9.4 6.7 120 4.61 3.46 2.73
Application before DC 30
2 12.56 0.53 19.5 38.3 243 42.25 10.25 16.48 0.383 86.64 17.88 3 12.90 0.57 15.8 27.8 201 44.43 8.95 16.77 0.349 95.03 17.50 4 14.20 0.61 15.8 31.3 224 43.03 9.58 15.52 0.382 89.28 17.88 α = 0.05 2.24 0.12 3.98 7.10 36 5.42 0.98 2.18
Application at DC 33
5 12.31 0.50 16.5 34.5 204 40.52 8.29 20.67 0.285 82.27 19.25 6 13.05 0.55 17.5 34.8 227 42.14 9.58 21.30 0.311 90.86 19.63 7 10.65 0.44 20.0 33.5 211 41.15 8.67 21.89 0.286 87.61 19.25 α = 0.05 3.01 0.13 4.17 10.4 59 1.96 2.58 4.56
[image:4.595.67.532.469.723.2]Table 4. Quantification of water stress effects on yield elements formation and reduction, verification of potential reduction of stress impact – summarized results of pot experiments, 2003
Variant 1 2 3 4 5 6* 7
DC 30 DC 33 DC 91 DC 91 DC 91 DC 33 DC 73 DC 33 DC 73 DC 91 Water regime
1 3.07 3.69 2.72 0.75 51.58 35.0 19.1 9.34 40.27 53.55 2 1.54 2.86 1.02 3.92 12.10 32.6 15.4 5.82 15.98 27.30 5 3.07 3.21 1.04 2.83 19.30 34.3 18.6 7.94 20.43 32.23 8 1.54 3.87 3.42 0.38 51.28 30.6 17.3 6.80 37.93 51.46 α = 0.05 0.35 0.42 0.22 0.93 2.35 1.0 2.0 1.96 2.59 2.37 Application before DC 30
2 1.54 2.86 1.02 3.92 12.10 32.6 15.4 5.82 15.98 27.30 3 1.54 2.69 1.00 3.70 13.32 32.8 14.0 5.59 15.36 28.23 4 1.54 2.90 1.00 4.05 13.00 32.6 15.2 5.55 15.42 28.49
α = 0.05 0.49 0.04 1.07 1.80 0.9 2.7 1.16 1.27 1.55
Application at DC 33
5 3.07 3.21 1.03 2.83 19.30 34.3 18.6 7.94 20.43 32.23 6 3.07 3.21 1.05 2.50 19.03 34.3 18.8 7.94 20.49 31.59 7 3.07 3.21 1.00 2.54 18.95 34.3 18.0 7.94 20.81 31.67
α = 0.05 0.06 0.57 1.59 0.9 2.55 2.89
*three single-flowered spikelets and/or their primordia at each node of the rachis were considered to be one floret 1 = tiller number/plant, 2 = spike number/plant, 3 = tiller number/plant, 4 = grain number/plant,
5 = initiated floret number/spike, 6 = fertile floret number/spike, 7 = dry weight of above-ground part (g)
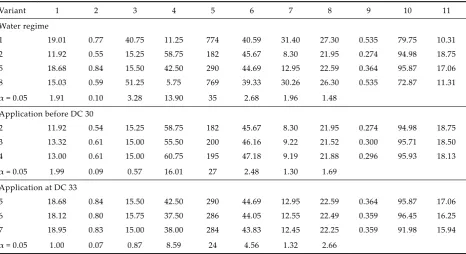
Table 5. Quantification of water stress effects on grain yield and quality, verification of potential reduction of stress impact – summarized results of pot experiments, 2003
Variant 1 2 3 4 5 6 7 8 9 10 11
Water regime
1 19.01 0.77 40.75 11.25 774 40.59 31.40 27.30 0.535 79.75 10.31 2 11.92 0.55 15.25 58.75 182 45.67 8.30 21.95 0.274 94.98 18.75 5 18.68 0.84 15.50 42.50 290 44.69 12.95 22.59 0.364 95.87 17.06 8 15.03 0.59 51.25 5.75 769 39.33 30.26 26.30 0.535 72.87 11.31 α = 0.05 1.91 0.10 3.28 13.90 35 2.68 1.96 1.48
Application before DC 30
2 11.92 0.54 15.25 58.75 182 45.67 8.30 21.95 0.274 94.98 18.75 3 13.32 0.61 15.00 55.50 200 46.16 9.22 21.52 0.300 95.71 18.50 4 13.00 0.61 15.00 60.75 195 47.18 9.19 21.88 0.296 95.93 18.13 α = 0.05 1.99 0.09 0.57 16.01 27 2.48 1.30 1.69
Application at DC 33
5 18.68 0.84 15.50 42.50 290 44.69 12.95 22.59 0.364 95.87 17.06 6 18.12 0.80 15.75 37.50 286 44.05 12.55 22.49 0.359 96.45 16.25 7 18.95 0.83 15.00 38.00 284 43.83 12.45 22.25 0.359 91.98 15.94 α = 0.05 1.00 0.07 0.87 8.59 24 4.56 1.32 2.66
[image:5.595.65.532.469.723.2]Table 6. Quantification of water stress effects on yield elements formation and reduction, verification of potential reduction of stress impact – summarized results of pot experiments, mean of 2002 and 2003
Variant 1 2 3 4 5 6* 7
DC 30 DC 33 DC 91 DC 91 DC 91 DC 33 DC 73 DC 33 DC 73 DC 91 Water regime
1 2.91 4.03 2.89 0.69 48.20 35.60 19.30 11.57 42.33 52.81 2 1.27 2.28 1.19 3.28 14.50 31.32 16.00 5.09 14.12 25.49 5 2.91 3.18 1.07 2.57 16.46 34.42 19.20 8.41 18.90 29.06 8 1.27 3.79 3.32 0.33 45.38 30.67 17.27 5.76 32.42 45.95 α = 0.05 0.26 0.67 0.36 0.58 6.15 1.45 1.32 2.69 5.47 7.25 α = 0.10 0.23 0.59 0.31 0.51 5.41 1.27 1.16 2.35 4.78 3.10 Application before DC 30
2 1.27 2.28 1.19 3.28 14.50 31.32 16.00 5.09 14.12 25.49 3 1.27 2.18 1.03 2.77 13.36 31.80 15.28 5.12 13.78 25.30 4 1.27 2.38 1.03 3.07 13.97 31.48 15.93 4.96 13.96 25.27 α = 0.05 0.28 0.19 0.55 2.16 0.82 1.44 0.57 0.82 1.36 α = 0.10 0.24 0.16 0.47 1.86 0.70 1.23 0.49 0.70 1.17 Application at DC 33
5 2.91 3.18 1.07 2.57 16.46 34.42 19.20 8.41 18.90 29.06 6 2.91 3.18 1.11 2.41 17.09 34.42 18.93 8.41 18.79 29.66 7 2.91 3.18 1.17 2.39 16.49 34.42 18.78 8.41 18.81 29.50
α = 0.05 0.15 0.40 1.90 1.03 1.78 2.36
α = 0.10 0.13 0.34 1.64 0.87 1.52 2.03
*three single-flowered spikelets and/or their primordia at each node of the rachis were considered to be one floret 1 = tiller number/plant, 2 = spike number/plant, 3 = tiller number/plant, 4 = grain number/plant,
5 = initiated floret number/spike, 6 = fertile floret number/spike, 7 = dry weight of above-ground part (g)
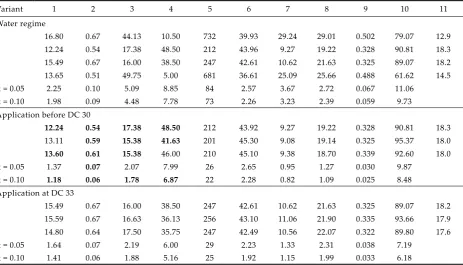
Table 7. Quantification of water stress effects on grain yield and quality, verification of potential reduction of stress impact – summarized results of pot experiments, mean of 2002 and 2003
Variant 1 2 3 4 5 6 7 8 9 10 11
Water regime
1 16.80 0.67 44.13 10.50 732 39.93 29.24 29.01 0.502 79.07 12.9 2 12.24 0.54 17.38 48.50 212 43.96 9.27 19.22 0.328 90.81 18.3 5 15.49 0.67 16.00 38.50 247 42.61 10.62 21.63 0.325 89.07 18.2 8 13.65 0.51 49.75 5.00 681 36.61 25.09 25.66 0.488 61.62 14.5 α = 0.05 2.25 0.10 5.09 8.85 84 2.57 3.67 2.72 0.067 11.06
α = 0.10 1.98 0.09 4.48 7.78 73 2.26 3.23 2.39 0.059 9.73 Application before DC 30
2 12.24 0.54 17.38 48.50 212 43.92 9.27 19.22 0.328 90.81 18.3
3 13.11 0.59 15.38 41.63 201 45.30 9.08 19.14 0.325 95.37 18.0
4 13.60 0.61 15.38 46.00 210 45.10 9.38 18.70 0.339 92.60 18.0
α = 0.05 1.37 0.07 2.07 7.99 26 2.65 0.95 1.27 0.030 9.87 α = 0.10 1.18 0.06 1.78 6.87 22 2.28 0.82 1.09 0.025 8.48 Application at DC 33
5 15.49 0.67 16.00 38.50 247 42.61 10.62 21.63 0.325 89.07 18.2 6 15.59 0.67 16.63 36.13 256 43.10 11.06 21.90 0.335 93.66 17.9 7 14.80 0.64 17.50 35.75 247 42.49 10.56 22.07 0.322 89.80 17.6 α = 0.05 1.64 0.07 2.19 6.00 29 2.23 1.33 2.31 0.038 7.19
α = 0.10 1.41 0.06 1.88 5.16 25 1.92 1.15 1.99 0.033 6.18
[image:6.595.68.532.462.727.2]The Atonik application before DC 30 (variant 3) lowered the reduction of fertile florets per spike in both years. The grain number per spike increased, and thus spikes productivity also increased. Additional tillering after anthesis was limited. The increase in spike productivity and decrease in additional tillering were significant at α = 0.10.
During the application of foliar fertilizers be-fore DC 30 (variant 4), a larger development of fertile florets into grains led to the increase in grain number per spike (significant at α = 0.10) and spike productivity. The application of foliar fertilizers at DC 33 (variant 7) limited additional tillering after anthesis.
Even though the effect of the above-mentioned measures on some partial elements was found nei-ther the application of foliar fertilizers nor Atonik were of practical importance to the final grain yield. There is a question to what level the effects of the applied agents could express considering the set up intensity and duration of the stressor. If the plant develops under unfavourable conditions for a longer time, the maintenance of higher yield potential at earlier growth stages can result in its higher reduction at later stages. Attention should also be paid to the investigations into anti-stress effects of other biologically active substances, for example, brassinosteroids.
REFERENCES
Ali M., Jensen C.R., Mogensen V.O., Andersen M.N., Henson I.E. (1999): Root signalling and osmotic adjustment during intermittent soil drying sustain grain yield of field grown wheat. Field Crops Res.,
62: 35–52.
Brestič M. (1996): Vodný režim, rastové a akumulačné procesy jarného jačmeňa. Rostl. Výr., 42: 481–487. Briggs K.G., Kiplagat O.K., Johnsonflanagan A.M. (1999):
Floret sterility and out crossing in two spring wheat cultivars. Can. J. Plant Sci., 79: 321–328.
Cabezza C., Kin A., Ledent J.F. (1993): Effect of water shortage on main shoot development and tillering of common and spelt wheat. J. Agron. Crop Sci., 170: 243–250.
Calhoun D.S., Gebeyehu G., Miranda A., Rajaram S., Vanginkel M. (1994): Choosing evaluation environ-ments to increase wheat grain yield under drought conditions. Crop Sci., 34: 673–678.
Cherry J.H. (1989): Environmental stress in plants. Biochemical and physiological mechanisms. Springer Verlag, Berlin: 27–37.
de Ruiter J.M. (1999): Yield and quality of malting barley (Hordeum vulgare L. Valetta) in response to irrigation and nitrogen fertilisation. New Zeal. J. Crop Hort. Sci., 27: 307–317.
Foulkes M.J., Scott R.K., Sylvester-Bradley R. (2002): The ability of wheat cultivars to withstand drought in UK conditions: formation of grain yield. J. Agr. Sci., 138: 153–169.
Gonzales A., Martin I., Ayerbe L. (1999): Barley yield in water-stress conditions. The influence of precocity, osmotic adjustment and stomatal conductance. Field Crops Res., 62: 23–34.
Hudec J., Bystrická J., Kobida Ľ., Brestič M., Olšovská K. (2001): Morforegulačné a antistresové účinky or-ganominerálneho kvapalného hnojiva AVIT-35. Poľnohospodárstvo, 47: 923–940.
Jamieson P.D., Martin R.J., Francis G.S., Wilson D.R. (1995): Drought effects on biomass production in barley. Field Crops Res., 43: 77–86.
Rožnovský J. (1998): Dynamics of occurrence of dry periods in the region of south Moravia and possible reduction of the effect of drought in agriculture. Acta Univ. Agr. Silvicult. Mendel. Brun., 46: 63–68. Švihra J., Brestič M., Olšovská K. (1996): Vplyv vodného
a teplotného stresu na produktivitu odrôd ozimnej pšenice. Rostl. Výr., 42: 425–429.
Zemánek M. (1991): Produktivita, adaptace a výnosová stabilita jarního ječmene v modelovém zásobení vo-dou. Rostl. Výr., 37: 799–808.
Received on April 29, 2004
ABSTRAKT
Vliv stresu ze sucha na utváření prvků výnosu jarního ječmene a možnosti zmírnění projevu stresu aplikací listových hnojiv a růstového stimulátoru
(ve sloupkování) následky stresu vykompenzovat. Hmotnost tisíce zrn předchozí nedostatek vody nesnížil, zvýšil se však obsah bílkovin v zrně vlivem nízkého výnosu zrna na nádobu. Při aplikaci listových hnojiv i Atoniku před DC 30 byla zaznamenána snížená míra redukce fertilních kvítků, což vedlo k mírnému zvýšení počtu zrn v klase.
Klíčová slova: jarní ječmen; vláhový stres; odnože; kvítky; výnos; struktura výnosu; výnosové prvky; obsah bílkovin; listová hnojiva; Atonik
Corresponding author:
RNDr. Ilona Svobodová, Zemědělský výzkumný ústav Kroměříž, s. r. o., Havlíčkova 2787, 767 01 Kroměříž, Česká republika