Elemental Analysis of Coffee: a Comparison of ICP-MS
and AAS Methods
Monika Jarošová, David MilDe and Martin Kuba
regional Centre of advanced Technologies and Materials, Department of analytical Chemistry, Faculty of Science, Palacký university in olomouc, Czech republic
Abstract
Jarošová M., Milde D., Kuba M. (2014): Elemental analysis of coffee: a comparison of ICP-MS and AAS methods. Czech J. Food Sci., 32: 354–359.
We determined the mineral nutrients and toxic elements (Ca, Cu, Fe, Mg, Zn, Cd, Cr, Mn, Ni, and Pb) in five types of coffee by atomic absorption spectrometry and inductively coupled plasma mass spectrometry. The decomposition of the samples took place in a microwave digestion system with HNO3 and H2O2 reagents. Partial validation of the method was performed by using the certified reference material (NCS ZC 73014). Univariate and multivariate statisti-cal methods were used to compare both the coffee samples and the techniques used. No significant differences were found between two used methods. Significant differences occurred between the coffee samples but only the application of multivariate statistics helps to distinguish among samples from different locations.
Keywords: coffea Arabica; atomic absorption spectrometry; inductively coupled plasma mass spectrometry metals; univariate statistics; multivariate statistics
Coffee is one of the most important agricultural products in the international business. Coffee, in terms of international trade, is the second product in value which, putting into motion approximately US$ 35 bil-lion per year and is comparable only to petroleum. The determination of mineral nutrients and toxic elements that are contained in it is of great interest due to its large consumption by millions of people around the world (dos Santos & de Oliveira 2001).
Nowadays, many people are interested in healthy food. The analysis of individual components of raw and processed products is necessary in the food in-dustry mainly to control the food safety (Sádecká & Polonský 1999). At present, essential and toxic metals in food and beverages are qualitatively and quantitatively studied by using mainly atomic absorp-tion spectrometry (AAS) (dos Santos et al. 2009; Jalbani et al. 2010; Kazi et al. 2010), inductively coupled plasma mass spectrometry (ICP-MS) (Roy-chowdhury et al. 2003; Nardi et al. 2009; Kaňa
2010) and inductively coupled plasma optical emission spectrometry (Lara et al. 2005; Oleszczuk et al. 2007; Santos et al. 2008). Other techniques include X-ray fluorescence spectrometry (Jastrzebska et al. 2003), electromigration techniques (Sadecka & Polonsky 1999; Szlyk et al. 2004), and some electrochemical techniques (Karadjova et al. 2000; Abbasi et al. 2010; Alghamdi 2010).
The objective of the articles mentioned was mainly the analysis of mineral nutrients and toxic elements in order to verify the quality of coffee and to determine its origin (dos Santos et al. 2001; Oleszczuk et al. 2007). The aim of this work was to compare ICP-MS and AAS for the determination of mineral nutrients and toxic elements (Ca, Cu, Fe, Mg, Zn, Cd, Cr, Mn, Ni, and Pb) in five types of coffee. Both methods were compared not only by the method performance criteria but also by the economic criteria and time-consumption of analysis. This article also presents the possibilities of applying univariate and multivariate statistics.
MAtErIAl And MEthodS
Apparatus. The material under study was digested in diffused microwave system (MLS 1200 Mega; Milestone S.r.L., Sorisole, Italy) using polytetra-fluoroethylene digestion vessels.
An ICP-MS spectrometer (Agilent 7700x; Agilent Technologies, Tokyo, Japan) based on quadrupole mass analyser and octapole reaction system (ORS 3) equipped with concentric nebuliser and Ni cones served for quantitative analysis of all elements. The operating conditions of ICP-MS are shown in Table 1.
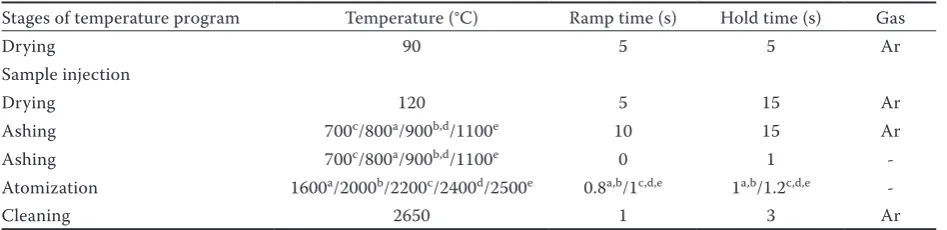
A double beam AAS spectrometer (Avanta Σ; GBC, Braeside, Australia) equipped with flame and elec-trothermal atomisation (graphite furnace atomiser GF 3000 with auto sampler PAL 3000) was used for the determination of all metals studied. Hollow cathode lamps (Photron, Narre Warren, Australia) were used as sources of radiation and the background correction was provided by a deuterium lamp. Ca, Cu, Fe, Mg, and Zn were determined by the flame atomisation technique with an acetylene-air flame. The addition of the releasing agent LaCl3 (25 g/l; Analytika Ltd., Prague, Czech Republic) diluted to 2.5 g/l was used to remove the non-spectral interferences of Ca. The determination of Cd, Cr, Mn, Ni, and Pb was carried out by electrothermal atomisation in a graphite furnace (Z-tek, Roodkaje, Netherlands). The matrix modifier, mixture in the ration 2 : 1 of Mg(NO3)2 (1 g/l) and Pd(NO3)2 (2 g/l) (both Analytika Ltd., Prague, Czech Republic) was used for Cd and Pb determination. A volume of 5 µl of the matrix modifier was injected into the graphite furnace together with 20 µl of sample. The tempera-ture programs for electrothermal atomisation are described in Table 2.
The statistical software QC-Expert 3.2 (Trilobyte Ltd., Staré Hradiště u Pardubic, Czech Republic) was used for the univariate analysis (descriptive statistics, hypothesis testing, and analysis of vari-ance) and principal component analysis, and NCSS 2007 (NCSS LLC, East Kaysville, USA) was used for the cluster analysis.
[image:2.595.64.291.266.411.2]Reagents. The calibration solutions were pre-pared by diluting the single element certified ref-erence materials with 1.000 ± 0.002 g/l for each element (Analytika Ltd., Prague, Czech Republic) with deionised water (18.2 MW∙cm, Direct-Q; Mil-lipore, Molsheim, France). The internal standard for ICP-MS was prepared by diluting the commercially available ICP-INT-MIX1 (Analytika Ltd., Prague,
Table 1. ICP-MS conditions
Parameter Value
RF power (W) 1550
Sampling depth (mm) 8
Cool gas flow rate (l/min) 14.95 Auxiliary gas flow rate (l/min) 0.9 Nebulizer gas flow rate (l/min) 1.09
He flow rate (ml/min) 4.3
Energy discrimination voltage (V) 5 Nebulizer pump speed (rps) 0.1
Chamber temperature 2°C
Table 2. Temperature program parameters
Stages of temperature program Temperature (°C) Ramp time (s) Hold time (s) Gas
Drying 90 5 5 Ar
Sample injection
Drying 120 5 15 Ar
Ashing 700c/800a/900b,d/1100e 10 15 Ar
Ashing 700c/800a/900b,d/1100e 0 1
-Atomization 1600a/2000b/2200c/2400d/2500e 0.8a,b/1c,d,e 1a,b/1.2c,d,e
-Cleaning 2650 1 3 Ar
acadmium; blead; cmanganese; dnickel; echromium
[image:2.595.63.537.620.735.2]Czech Republic) which contains Bi, In, Sc, Tb, and Y, to the concentration of 100 µg/l.
Samples and reference material. Five coffee sam-ples (Coffea Arabica L.) coming from India, Kenya, Honduras, Colombia, and Ethiopia were obtained from local coffee shops and from each sample 6 sub-samples were taken for analysis. The certified refer-ence material NCS ZC 73014 Tea (China National Analysis Centre for Iron & Steel, Beijing, China) was used for method validation.
Sample preparation. The samples (about 0.2 g) were weighed using an analytical balance into pol-ytetrafluoroethylene vessels and 3 ml of HNO3 (67%, analpure) and 1 ml of H2O2 (30%, analytical grade) (both Analytika Ltd., Prague, Czech Republic) were added. The time program used was as follows: 2 min at 250 W, 2 min at 0 W, 5 min using 400 W, 2 min at 0 W, 2 min at 400 W and finally 7 min using 600 W. After the digestion, each solution was diluted to 25 ml in a volumetric flask with deionised water and then the analytes were determined by AAS and ICP-MS.
rESultS And dISCuSSIon
Method validation. Both methods were partially validated by the following parameters:
– The limit of detection (LOD) was calculated by Kaiser’s approach (Price 1979). LODs (Table 3) are about two orders of magnitude better for ICP-MS than for AAS. The higher value of LOD for Pb de-termined by AAS is ascribed to a low stability of radiation coming from the hollow cathode lamp at the wavelength used.
– Linearity was tested by the observation of the calibration curves and statistical testing of the cor-relation coefficients for linear and polynomial de-pendence (Meloun & Militky 2011). The linearity for AAS was above two orders of magnitude and for ICP-MS five orders of magnitude.
[image:3.595.65.533.101.272.2]– The intermediate precision was evaluated as the relative standard deviation from 34 (the number obtained by CRM analysis during the development and measuring) repeated measurements of CRM
Table 3. Values of limit of detection (LOD), precision and uncertainty
LOD (mg/kg) Precision (%) Relative uncertainty (%)
ICP-MS AAS ICP-MS AAS ICP-MS AAS
Ca 0.055 1.75 3.01 3.38 6.22 7.20
Cu 0.018 2.25 2.29 3.93 6.87 11.37
Fe 0.082 13.75 3.39 4.99 7.91 24.78
Mg 0.063 2.75 2.97 4.87 5.51 8.73
Zn 0.058 1.38 2.85 4.14 6.11 10.03
Cd 0.003 0.01 7.68 12.06 17.01 25.67
Cr 0.010 0.16 3.49 11.90 13.82 33.70
Mn 0.004 0.04 2.61 5.83 6.28 13.15
Ni 0.013 0.17 5.70 12.44 15.64 28.50
Pb 0.003 1.03 5.41 10.87 16.53 34.07
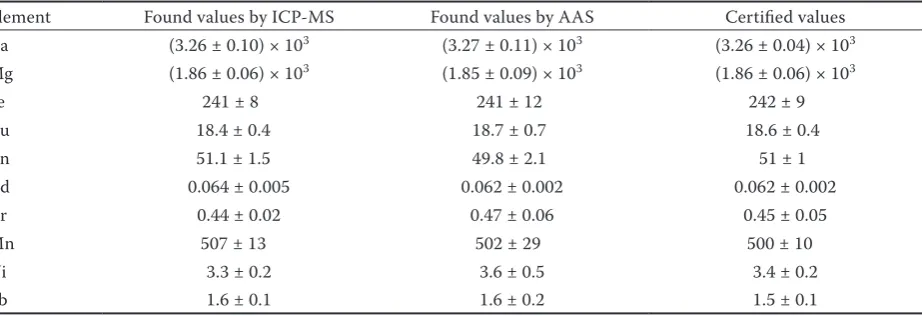
Table 4. Analysis of CRM for elements determination (mg/kg), expressed as mean value ± standard deviation
Element Found values by ICP-MS Found values by AAS Certified values Ca (3.26 ± 0.10) × 103 (3.27 ± 0.11) × 103 (3.26 ± 0.04) × 103
Mg (1.86 ± 0.06) × 103 (1.85 ± 0.09) × 103 (1.86 ± 0.06) × 103
Fe 241 ± 8 241 ± 12 242 ± 9
Cu 18.4 ± 0.4 18.7 ± 0.7 18.6 ± 0.4
Zn 51.1 ± 1.5 49.8 ± 2.1 51 ± 1
Cd 0.064 ± 0.005 0.062 ± 0.002 0.062 ± 0.002
Cr 0.44 ± 0.02 0.47 ± 0.06 0.45 ± 0.05
Mn 507 ± 13 502 ± 29 500 ± 10
Ni 3.3 ± 0.2 3.6 ± 0.5 3.4 ± 0.2
[image:3.595.70.532.598.756.2]for all elements. The results are summarised in Ta-ble 3 and they are satisfactory both as for flame and electrothermal atomisation in AAS and for ICP-MS. – Uncertainty was calculated from the analysis of CRM according to NORDTEST Technical Report 537 (Magnuson et al. 2004) and expressed as ex-panded uncertainty U with coverage factor k = 2. The higher uncertainty for the elements determined by electrothermal atomisation in AAS was caused by the poorer repeatability of this technique.
– Trueness was tested by the evaluation of the results from the repeated analysis (n = 34) of CRM. The measured concentrations of all elements were inside the expanded uncertainties of the certified values of CRM as can be seen in Table 4.
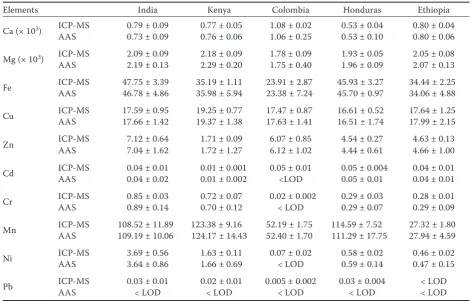
Comparison of samples and methods. The results obtained for mineral nutrients and toxic elements expressed as the mean and standard deviations of six replicates are presented in Table 5. The concen-trations of all studied elements from ICP-MS and AAS determinations were compared using Student’s
t-test (P = 0.05), no significant differences between the methods having been found.
Considering the time consumption when analys-ing 10 elements in 25 samples, we can come to the
conclusion that ICP-MS analysis is five times faster then AAS method. The time for the sample prepara-tion is the same for both methods but the analysis on AAS (both flame and electrothermal atomisation) takes approximately 15 h while that on ICP-MS takes approximately 3 hours.
The economic aspects are nowadays of great im-portance. In this work, we compared the running costs of the analysis of 10 elements in 25 samples. The price of the calibration solutions and reagents (matrix modifiers + releasing agents for AAS; and internal standards and tuning solutions for ICP-MS) is the same. The consumption of Ar is similar, in both methods. AAS needs graphite tubes and acety-lene (for flame atomisation), on the other hand high purity helium is needed for ICP-MS. In conclusion, the running costs for AAS are slightly higher than those for ICP-MS.
Statistical analysis. The application of univariate and multivariate statistical methods to the results obtained is shown. Using the descriptive statistics was the first step. We obtained and compared different mean values (arithmetic mean, median, pivot half sum from the order statistics procedure introduced by Horn (Meloun & Militky 2011)). The
assump-Table 5. Mineral and toxic elements (mg/kg) present in coffee
Elements India Kenya Colombia Honduras Ethiopia
Ca (× 103) ICP-MS 0.79 ± 0.09 0.77 ± 0.05 1.08 ± 0.02 0.53 ± 0.04 0.80 ± 0.04
AAS 0.73 ± 0.09 0.76 ± 0.06 1.06 ± 0.25 0.53 ± 0.10 0.80 ± 0.06
Mg (× 103) ICP-MS 2.09 ± 0.09 2.18 ± 0.09 1.78 ± 0.09 1.93 ± 0.05 2.05 ± 0.08
AAS 2.19 ± 0.13 2.29 ± 0.20 1.75 ± 0.40 1.96 ± 0.09 2.07 ± 0.13
Fe ICP-MSAAS 47.75 ± 3.3946.78 ± 4.86 35.19 ± 1.1135.98 ± 5.94 23.91 ± 2.8723.38 ± 7.24 45.93 ± 3.27 45.70 ± 0.97 34.44 ± 2.2534.06 ± 4.88
Cu ICP-MSAAS 17.59 ± 0.9517.66 ± 1.42 19.25 ± 0.7719.37 ± 1.38 17.47 ± 0.8717.63 ± 1.41 16.61 ± 0.52 16.51 ± 1.74 17.64 ± 1.2517.99 ± 2.15
Zn ICP-MSAAS 7.12 ± 0.647.04 ± 1.62 1.71 ± 0.09 1.72 ± 1.27 6.07 ± 0.856.12 ± 1.02 4.54 ± 0.274.44 ± 0.61 4.63 ± 0.134.66 ± 1.00
Cd ICP-MSAAS 0.04 ± 0.010.04 ± 0.02 0.01 ± 0.001 0.01 ± 0.002 0.05 ± 0.01<LOD 0.05 ± 0.0040.05 ± 0.01 0.04 ± 0.010.04 ± 0.01
Cr ICP-MSAAS 0.85 ± 0.030.89 ± 0.14 0.72 ± 0.07 0.70 ± 0.12 0.02 ± 0.002< LOD 0.29 ± 0.030.29 ± 0.07 0.28 ± 0.010.29 ± 0.09
Mn ICP-MSAAS 108.52 ± 11.89109.19 ± 10.06 123.38 ± 9.16124.17 ± 14.43 52.19 ± 1.7552.40 ± 1.70 114.59 ± 7.52111.29 ± 17.75 27.32 ± 1.8027.94 ± 4.59
Ni ICP-MSAAS 3.69 ± 0.563.64 ± 0.86 1.63 ± 0.11 1.66 ± 0.69 0.07 ± 0.02< LOD 0.58 ± 0.020.59 ± 0.14 0.46 ± 0.020.47 ± 0.15
Pb ICP-MSAAS 0.03 ± 0.01< LOD 0.02 ± 0.01< LOD 0.005 ± 0.002< LOD 0.03 ± 0.004< LOD < LOD< LOD
[image:4.595.61.535.100.401.2]tion of normality of the data was also tested and confirmed for all data sets. No significant differences were found between arithmetic means, median and pivot half sums, even though we have a small number of repeated measurements (n = 6) for each coffee sample taken into statistical evaluation. To compare the concentrations of the analysed metals between locations, one way analysis of variance was utilised. Statistically significant differences (P = 0.05) were found for all metals. Scheffé procedure for multiple comparison revealed that the greatest differences in the metal levels were for Cr, Mn, and Fe while the smallest differences were for Mg, Pb, and Cu.
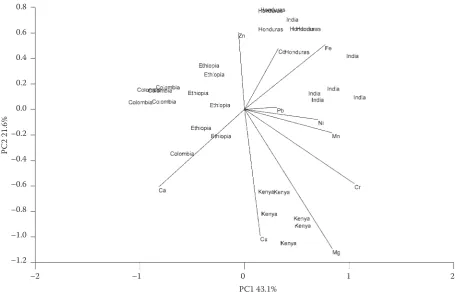
Principal component analysis (PCA) as one of the widely used techniques of multivariate statistics was applied on our data. The coffee samples were analysed by PCA using ten element concentra-tions as variables. Kaiser criterion (eigenvalues of PC should be above 1) was used to choose the appropriate number of the extracted PCs. Thus, no more than three principal components should be extracted (eigenvalues PC1: 4.73; PC2: 1.95; PC3: 1.13) that explain 79.3% of variability hidden in the original data. The results from PCA can be graphically shown on biplot (Figure 1), where PC1 and PC2 are depicted. Almost perfect separation into clusters according to the country of origin is
seen. One result of the repeated analysis of cof-fee from India was classified into the cluster of Honduras samples. Also, the separation between Colombia and Ethiopia samples into clusters is not ideal either. The length of the radius vectors shows the influence of individual elements when creating the principal components. It can be seen that the least significant elements are Pb and Ni, while the most significant ones are Mg, Cu, and Cr.
ConCluSIonS
[image:5.595.63.529.82.375.2]Both methods described in this article were suc-cessfully validated and are applicable to the analysis of plant samples like coffee. ICP-MS is, of course, less time consuming than AAS, because ICP-MS allows simultaneous analysis. When the laboratory is equipped with both instruments, it is cheaper (capital costs are not compared) to use ICP-MS for the analysis if the determination of more than five or six elements is required. The use of suitable statistical procedures can help to reveal relations in the data sets that are not obvious. Detailed evaluation of the analysis of variance showed between which elements exist the greatest and the smallest differences. When several analytes are measured in each sample, it is useful to apply the multivariate statistical method.
Figure 1. Biplot from PCA 0.8
0.6
0.4
0.2
0.0
–0.2
–0.4
–0.6
–0.8
–1.0
–1.2
–2 –1 0 1 2 PC1 43.1%
The utilisation of PCA confirmed the potential of the localisation of the coffee samples origin.
references
Alghamdi A.H. (2010): Aplications of stripping voltamet-ric techniques. Arabian Journal of Chemistry, 3: 1–7. Abbasi S., Khani H., Tabaraki R. (2010): Determination
of ultra trace levels of copper in food samples by a highly sensitive adsorptive stripping voltammetric method. Food Chemistry, 123: 507–512.
dos Santos E.J., de Oliveira D. (2001): Determination of mineral nutrients and toxic elements in Brazilian soluble coffee by ICP-AES. Journal of Food Composition and Analysis,14: 523–531.
dos Santos J.S., Santos M.L.P., Conti M.M., dos San-tos S.N., de Oliveira E. (2009): Evaluation of some metals in Brazilian coffees cultivated during the process of conversion from conventional to organic agriculture. Food Chemistry, 115: 1405–1410.
Jalbani N., Ahmed F., Kazi T.G., Rashid U., Munshi A.B., Kandhro A. (2010): Determination of essential elements (Cu, Fe and Zn) in juices of commercially available in Pakistan. Food and Chemical Toxicology, 48: 2737–2740. Jastrzebska A., Brudka B., Szymanski T., Szlyk E.
(2003): Determination of phosphorus in food samples by X-ray fluorescence spectrometry and standard spec-trophotometric method. Food Chemistry, 83: 463–467. Kaňa A. (2010): Determination of phosphorus by mass
spectrometry with inductively coupled plasma. Chemické listy, 104: 20–22.
Karadjova I., Girousi S., Iliadou E., Stratis I. (2000): Determination of Cd, Co, Cr, Cu, Fe, Ni and Pb in milk, cheese and chocolate.Mikrochimica Acta, 134: 185–191. Kazi T.G., Jalbani N., Baig J.A., Arain M.B., Afridi H.I., Jamali M.K., Shah A.Q., Memon A.N. (2010): Evaluation of toxic elements in baby foods commercially available in Pakistan. Food Chemistry, 119: 1313–1317. Lara R., Cerutti S., Salonia J.A., Olsina R.A., Mar-tinez L.D. (2005): Trace element determination of Ar-gentine wines using ETAAS and USN-ICP-OES. Food and Chemical Toxicology, 43: 293–297.
Magnusson B., Näykki T., Hovind H., Krysell M. (2004): Handbook for Calculation of Measurment Un-certainty in Environmental Laboratories. Nordtest Report TR 537, Espo.
Meloun M., Militky J. (2011): Statistical Data Analysis. Woodhead Publishing, New Delhi.
Nardi E.P., Evangelista F.S. Tormen L., Saint’Pierre T.D., Curtius A.J., de Souza S.S., Barbosa F. Jr. (2009): The use of inductively coupled plasma mass spectrometry (ICP-MS) for the determination of toxic and essential ele-ments in different types of food samples. Food Chemistry, 112: 727–732.
Oleszczuk N., Castro J.T., da Silva M.M, Korn M.D.A., Welz B., Vale M.G.R. (2007): Method development for the determination of manganese, cobalt and copper in green coffee comparing direct solid sampling electro-thermal atomic absorption spectrometry and inductively coupled plasma optical emission spectrometry. Talanta, 73: 862–869.
Price W.J. (1979): Spectrochemical Analysis by Atomic Absorption. Hyden, London.
Roychowdhury T., Tokunaga H., Ando M. (2003): Sur-vey of arsenic and other heavy metals in food composites and drinking water and estimation of dietary intake by the villagers from an arsenic-affected area of West Bengal, India.Science of the Total Environment, 308: 15–35. Sádecká J., Polonský J. (1999): Determination of
inorgan-ic ions in food and beverages by capillary electrophoresis. Journal of Chromatography A,834: 401–417.
Santos W.P.C., Hatje V., Lima L.N., Trignano S.V., Bar-ros F., Castro J.T., Korn M.G.A. (2008): Evaluation of sample preparation (grinding and sieving) of bivalves, coffee and cowpea beans for multi-element analysis. MicrochemicalJournal, 89: 123–130.
Szlyk E., Jastrzebska A., Brudka B. (2004): Determina-tion of total phosphorus in soya food samples by capillary isotachophoresis (cITP). Talanta, 63: 575–580.
Received for publication August 22, 2013 Accepted after corrections November 18, 2013
Corresponding author: