Mechanical Properties and Shape Memory Behavior of Ti-Mo-Ga Alloys
Hee Young Kim
1, Yoshinori Ohmatsu
1, Jae Il Kim
1, Hideki Hosoda
2and Shuichi Miyazaki
1;* 1Institute of Materials Science, University of Tsukuba, Tsukuba 305-8573, Japan2Precision and Intelligence Laboratory, Tokyo Institute of Technology, Yokohama 226-8503, Japan
Mechanical properties and shape memory behavior of Ti-Mo-Ga alloys were investigated in order to develop Ni-free biomedical shape memory alloys. The Ti-Mo-Ga alloys were fabricated by arc melting method. The ingots were cold-rolled up to 95% reduction in thickness. The cold-rolled specimens were heat treated in the temperature range 673–1273 K for 60 s–3.6 ks. The martensitic transformation temperature decreased with increase in Mo and Ga content. The maximum shape recovery strain was obtained in a solution treated Ti-6 at%Mo-3 at%Ga alloy. Mechanical properties and shape memory behavior strongly depend on heat treatment condition in the Ti-6 at%Mo-3 at%Ga. Premature failure was observed in specimens heat treated in the temperature range 673–773 K. Ultimate tensile strength decreased and fracture strain increased with increasing heat treatment temperature. Shape memory effect was obtained in specimens heat treated in the temperature range 1073–1273 K. The shape memory effect was due to the stress induced martensitic transformation yielding tensile deformation and the reverse transformation upon heating after unloading. The martensitic transformation start temperature increased and the yield stress decreased with increasing heat treatment temperature and time. Stable superelastic behavior was obtained in a Ti-7 at%Mo-4 at%Ga alloy at room temperature by cyclic tensile tests. The recovery strain exceeding 4% was achieved in the pre-strained Ti-7 at%Mo-4 at%Ga alloy.
(Received November 28, 2003; Accepted January 7, 2004)
Keywords: shape memory alloy, superelasticity, biomaterial, smart material, titanium based alloy
1. Introduction
Ti-Ni shape memory alloys have been used successfully as biomedical materials owing to their superior shape memory
property and superelasticity.1–3) However, the
Ni-hypersen-sitivity and toxicity of Ni has been pointed out in Ti-Ni
alloys.4) Although the Ti-Ni alloys have been successfully
applied for many medical products, the development of Ni-free shape memory alloys is on the other hand strongly required in order to pursue absolute safety.
The -type Ti alloys reveal a martensitic transformation
from (disordered BCC) to two metastable martensite
structures, either hexagonal martensite (0) or orthorhombic
martensite (00), by quenching. The martensite structure
changes from 0 to00 above a critical alloying content.5–7)
Transformation strains from the to 00 is accommodated
primarily by internal twinning. The reversion of00 to is
related to the shape memory effect in -type Ti alloys.
Although the shape memory effect has been reported in
Ti-Mo alloys,8–11) Ti-Nb alloys12–14) and Ti-V alloys,15) the
fundamental understanding is still insufficient in Ti-based shape memory alloys.
In this study, mechanical properties and shape memory behavior of Ti-Mo-Ga alloys were investigated in order to develop Ni-free biomedical shape memory alloys. The effects of heat treatment temperature and time on mechanical properties and shape memory behavior were investigated by tensile testing at various temperatures.
2. Experimental Procedures
The Ti-(5–7)at%Mo-(1–8)at%Ga alloys were prepared by an Ar arc melting method. Hereafter, Ti-xat%Mo-yat%Ga is
abbreviated to Ti-xMo-yGa. The ingots were cold-rolled up
to 95% reduction in thickness. The cold-rolled sheets were cleaned with ethanol, wrapped in Ti foil and encapsulated in
quartz tubes under a 25 torr partial pressure of high-purity Ar, and then heat treated in the temperature range 673–1273 K for 60 s-3.6 ks. The sheets were quenched into water by breaking the quartz tubes. Specimens for the mechanical tests were cut by an electro-discharge machine. The damaged surface was removed by mechanical polishing and eletro-polishing. Bending tests were carried out at room temperature where the specimens were deformed in a round shape and heated up to approximately 500 K. Tensile tests were carried
out under a strain rate of1:67104s1at various
temper-atures. The gage length of specimens was 20 mm. XRD measurements were conducted at room temperature with
CuKto determine the constituent phases. Si was used as a
reference.
3. Results and Discussion
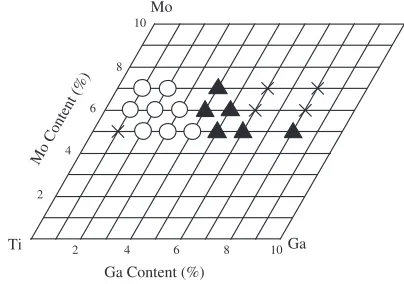
The shape memory effect of Ti-Mo-Ga alloys was investigated by bending tests. Thin plates were bent at room temperature and then heated up to 500 K. Before bending the plates were solution treated at 1273 K for 3.6 ks. The results are summarized in Fig. 1. Open circles denote that shape
Ti Ga
Mo
2 2
6
4 8 10
4 6
8 10
Ga Content (%) Mo Content (%)
Fig. 1 Composition dependence of shape memory effect at room temper-ature. : shape memory effect, : superelastic behavior.
[image:1.595.323.525.617.759.2]memory effect was observed on heating after bending. Superelastic behavior was observed at composition marked by solid triangle. Neither shape memory effect nor
supere-lastic behavior was observed at compositions marked by.
Shape memory effect was obtained in 5Mo-(2–4)Ga, Ti-6Mo-(1–3)Ga and Ti-7Mo-(1–2)Ga alloys. And superelastic behavior was obtained in Ti-5Mo-(5–8)Ga, Ti-6Mo-(4–5)Ga and Ti-7Mo-4Ga at room temperature. Figure 1 indicates that the martensitic transformation temperature decreased with increasing Mo and Ga contents. This means that the shape memory effect or superelastic behavior is achievable at body temperature by controlling Mo and Ga contents.
Figure 2(a) shows the stress-strain curves of Ti-6Mo-Ga alloys obtained by tensile tests at room temperature after the heat treatment at 1273 K for 3.6 ks. The elongation decreased with increasing Ga content. The Ti-6Mo-3Ga alloy exhibits double yielding including strain plateau with a low work hardening rate. The yield stress was evaluated using these stress-strain curves of Ti-6Mo-Ga alloys as shown in Fig. 2(b) as a function of Ga content. A minimum in yield stress was observed around 3% Ga, and then the yield stress increased rapidly between 3% and 5% Ga. It is supposed that
the martensitic transformation start temperature (Ms) of
Ti-6Mo-3Ga is close to room temperature.
Figure 3 shows the stress-strain curves obtained at room temperature for the Ti-6Mo-3Ga alloy after annealing in the temperature range 673–1273 K for 3.6 ks. Premature failure was observed in the specimen annealed in the temperature
range 673–773 K. The specimen annealed at 873 K fractured immediately after yielding. The specimens annealed in the temperature range 1073–1273 K exhibited a strain plateau with a low work hardening rate. Also a shape memory effect was obtained in the specimens annealed in the temperature range 1073–1273 K. Figure 4 shows the ultimate tensile strength (UTS) and fracture strain evaluated using the stress-strain curves obtained in Fig. 3. The UTS decreased with increasing annealing temperature followed by saturation at 1073 K. The fracture strain steeply increased with increasing annealing temperature from 873 to 1173 K.
Figure 5 shows the X-ray diffraction patterns obtained at
0 200 600 800 1000 1200
0 2 4 6 10
Stress,
σ
/ MPa
Strain, ε (%)
8Ga 5Ga
400
8 4Ga
1Ga 3Ga
Yield Stress,
σ
y
/ MPa
0 200 600 800 1000
400
0 2 4 6 8 10
Ga Content (%) (a)
(b)
Fig. 2 Stress-strain curves (a) and yield stress (b) obtained at room temperature in the Ti-6Mo-(1–8)Ga alloys heat-treated at 1273 K for 3.6 ks.
1173K 1273K 1073K
1173K 1273K
973K 873K
673K 773K
Stress,
σ
/ MPa
Strain, ε (%)
2 4 6 8 10 16 18 20 22 24 26 0
0 200 400 600 800 1000
Fig. 3 Effect of heat treatment temperature on stress-strain curve of the Ti-6Mo-3Ga alloy.
Fracture Strain,
ε
f
(%)
UTS,
σ
UTS
/ MPa
(a)
300 500 700 900 1100
600 700 800 900 1000 1100 1200 1300
(
( ) )
Heat treatment temperature, T / K
600 700 800 900 1000 1100 1200 1300
0 5 10 15 20 30
25 (b)
Heat treatment temperature, T / K
[image:2.595.70.275.73.383.2] [image:2.595.319.536.77.205.2] [image:2.595.325.530.267.586.2]room temperature for the Ti-6Mo-3Ga alloy after annealing in the temperature range 673–1273 K for 3.6 ks. The broad
peaks corresponding to and 00 were observed after
annealing at 673 K. This indicates that the deformed structure
and the stress induced00remained after annealing at 673 K.
Figure 5 indicates that the specimens consist ofandafter
annealing in the temperature range 773–973 K. The peak
corresponding (110) ofbecame sharp after annealing above
873 K. In addition, it has been known that the ! phase is
formed during annealing in the temperature range 373–
773 K.16)It is supposed that the deformed structure and the
formation of!phase resulted in the premature failure after
[image:3.595.59.278.69.398.2]annealing in the temperature range 673–773 K as shown in
Fig. 3. The peaks corresponding to disappeared after
annealing at 1073 K. Thus, the =transformation
temper-ature is between 973 K and 1073 K for Ti-6Mo-3Ga. This result corresponds to the stress-strain curves that show the steep increase of a fracture strain after the annealing above
1073 K. It is noted that the peaks from00were detected after
annealing in the temperature range 1073–1273 K. This means
that the Ms temperatures are higher than 298 K for the
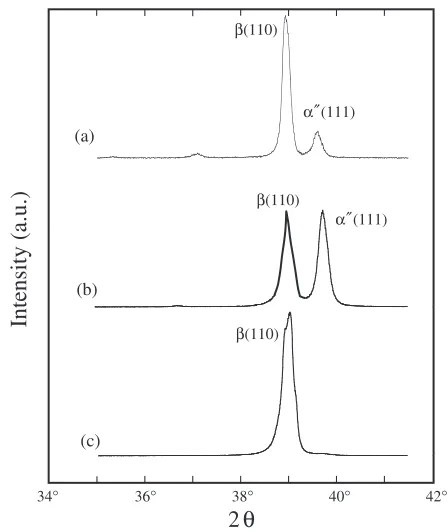
specimens annealed in the temperature range 1073–1273 K. The strain plateau was observed during tensile tests at room temperature in the specimens annealed in the temper-ature range 1073–1273 K. This strain plateau is associated with the formation of stress induced martensites or reor-ientation of pre-existing martensites. Figure 6 shows the XRD patterns obtained from undeformed, deformed and
shape recovered specimens in the solution treated condition of 1273 K for 3.6 ks. The diffraction profile from the
undeformed specimen exhibits the parent phase. Peaks
corresponding to the00martensite were also observed. After
the deformation at room temperature, the intensity of (110)
line of decreased and the reflections from 00 increased.
After heating up to 500 K, the reflections from 00
disap-peared and intensity of (110) line of increased. These
results indicate that the shape memory effect in this case was due to mainly the stress induced martensitic transformation and partially the rearrangement of martensite variants during tensile deformation followed by the reverse transformation during heating.
Figure 7 shows the stress-strain curves obtained at room temperature for the Ti-6Mo-3Ga alloy after annealing at 1073 K for 60 s–3.6 ks. The UTS and fracture stain were plotted as a function of annealing time in Fig. 8. Fracture 973K
1073K 773K
873K 673K
1273K
34° 36° 38° 40° 42°
β (110)α" (111)
α (100) α (002)
α (101) β (110)
α (100) α (002)
α (101) β (110)
β (110) α (101) α (100) α (002)
β (110)
α" (111) α" (020)
β (110)
α" (111) α" (020)
at 298K
2
θ
Intensity (a.u.)
Fig. 5 X-ray diffraction patterns obtained at 298 K in the Ti-6Mo-3Ga alloy heat-treated in the temperature range 673–1273 K for 3.6 ks.
β(110)
(a)
α(111)
β(110) β(110)
α(111)
Intensity (a.u.)
(b)
(c)
34° 36° 38° 40° 42°
2
θ
Fig. 6 X-ray diffraction patterns obtained from undeformed (a), deformed (b) and shape recovered (c) condition in the Ti-6Mo-3Ga alloy solution treated at 1273 K for 3.6 ks.
Stress,
σ
/ MPa
Strain, ε (%)
120s
600s 1.8ks 3.6ks
60s
0 200 400 600
6 8 10 12 14 16 18 20 22 800
1000
As-rolled
2 4
[image:3.595.313.537.70.336.2] [image:3.595.319.535.630.757.2]strain increased to 8–10% by annealing at 1073 K for 30– 120 s due to recovery of cold-worked microstructure. The UTS decreased and the fracture strain increased remarkably after annealing for 1.8 ks because of recrystallization and grain growth.
Figures 9 and 10 show the series of stress-strain curves for the Ti-6Mo-3Ga alloys which were annealed at 1273 K for 3.6 ks and annealed at 1073 K for 120 s, respectively. The residual strain after unloading was recovered by heating at about 500 K: broken lines with arrows indicate the shape recovery by heating. The critical stresses for apparent yield are plotted in Fig. 11. The stress-strain curves may be divided mainly into two temperature regions according to the temperature dependence of the critical stress. In the region
T >Tm, where Tm indicates the temperature showing the
minimum of the critical stress, the critical stress increases with increasing temperature. The parent phase is more stable at higher temperatures, and thus higher stress is required for inducing the martensitic transformation, which is in accord-ance with the Clausius-Clapeyron relationship. In the region
T <Tm, the critical stress decreases with increasing
temper-ature. This is because the stress for the rearrangement of martensite variants increases with decreasing temperature.
The minima of the critical stress are observed at 295 K and 328 K in the specimens annealed at 1073 K for 120 s and at
1273 K for 3.6 ks, respectively. This indicates that theMsis
lower in the specimen annealed at 1073 K for 120 s, because of higher density of dislocations suppressing the martensitic transformation. As shown in Figs. 9 and 10, in the vicinity of the minima, the maximum shape recovery strain about 2.5% was obtained. The recovery strain decreased with increasing and decreasing temperature from the minimum stress point.
In the region T >Tm, the critical stress to induce the
martensite increases with increasing temperature, while the
100 1000 10000
400 500 600 700 800 900 1000 UTS 0 5 10 15 20 25 Fracture strain 0 Fracture Strain, ε f (%)
Heat treatment time, t / s
UTS,
σ
UTS
/ MPa
Fig. 8 Effect of heat treatment time on UTS (a) and fracture strain (b) of the Ti-6Mo-3Ga alloy.
0 600 400 200 236K 0 600 400 200 270K 0 600 400 200 295K 0 600 400 200 328K 0 600 400 200 348K 0 600 400 200 365K 0 600 400 200 382K Stress, σ / MPa
Strain, ε (%) 3
1 2 1 2 3
3
1 2 1 2 3
3
1 2 1 2 3
3 1 2
Fig. 9 Stress-strain curves obtained at various temperatures for the Ti-6Mo-3Ga alloy annealed at 1273 K for 3.6 ks.
0 600 400 200 236K 0 600 400 200 270K 0 600 400 200 295K 0 600 400 200 326K 0 600 400 200 348K 0 600 400 200 365K 3
1 2 1 2 3
3
1 2 1 2 3
3
1 2 1 2 3
Strain, ε (%)
Stress,
σ
[image:4.595.316.535.73.300.2]/ MPa
Fig. 10 Stress-strain curves obtained at various temperatures for the Ti-6Mo-3Ga alloy annealed at 1073 K for 120 s.
0 100 200 300 400 500 1073K/120s 1273K/3.6ks
200 250 300 350 400
Yield Stress,
σ
y
/ MPa
[image:4.595.66.279.75.215.2]Temperature,
T
/ K
[image:4.595.63.279.269.559.2] [image:4.595.323.529.354.502.2]critical stress for slip decrease with increasing temperature. Slip occurs if the stress level for slip becomes lower than the stress to induce the martensite. Thus, the strain by slip increases with increasing temperature, causing the recover-able strain to decrease. The recoverrecover-able strain also decreases with decreasing temperature because the stress for the rearrangement of martensite variants increases above the critical stress for slip.
Figure 12 shows stress-strain curves of the Ti-6Mo-3Ga specimens annealed at 1073 K and 1273 K: they were obtained from cyclic deformation at room temperature to various strains followed by heating to 500 K for each cycle. Both specimens show the almost perfect shape memory effect at the first cycle. The shape recovery strain was about 2.5% for both cases. At the second cycle, residual strain was also recovered completely by heating in the specimen annealed at 1073 K, whereas only 0.2% of recovery strain was obtained due to the permanent deformation by slip in the specimen annealed at 1273 K. It obviously indicates that the critical stress to induce the martensite is higher when the specimen has been annealed at 1073 K. The remained plastic strain is plotted as a function of applied stress in Fig. 13. The critical stress for slip was defined as a stress inducing 0.5% plastic strain. Thus, the critical stresses for slip were obtained as 460 MPa and 660 MPa for the specimens annealed at 1273 K and 1073 K, respectively. As a result, a higher critical stress for slip resulted in the larger shape recovery strain and more stable shape memory effect when annealed at 1073 K for 120 s.
In order to obtain superelasticity at body temperature, the
reverse martensitic transformation finish temperature (Af)
should be below body temperature. The Af temperature
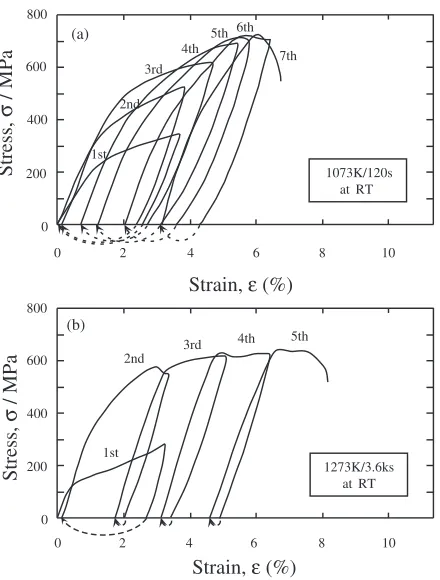
decreased with increasing Mo and Ga content. Ti-7Mo-4Ga was selected using the result of bending test as shown in Fig. 1. Cyclic tensile tests by repeated loading and unloading were carried out at room temperature by using a specimen annealed at 1073 K for 120 s. The results are shown in Fig. 14. At the first cycle, the stress-strain curve exhibited incomplete superelastic behavior with a small amount of remained strain. After the 4th cycle, the complete superelastic behavior with the recovery strain of about 4% was obtained. The curves show that the critical stress for inducing martensite decreases with increasing cycle number. It is also noted that the stable superelastic curve was obtained after the 10th cycle. It is concluded that Ti-Mo-Ga alloys are promising for the biomedical shape memory and superelastic alloys. Further research on the effect of thermo-mechanical treatment on mechanical properties is needed to enhance the shape memory and superelastic properties of Ti-Mo-Ga alloy.
1st 2nd
3rd
6th
7th
0 200 400 600 800
0 2 4 6 8 10
4th 5th
1073K/120s at RT
(a)
Strain, ε (%)
Stress,
σ
/ MPa
1st 2nd
3rd
0 200 400 600 800
0 2 4 6 8 10
4th 5th
1273K/3.6ks at RT
(b)
Stress,
σ
/ MPa
Strain, ε (%)
Fig. 12 Stress-strain curves obtained by cyclic loading-unloading tensile tests for the Ti-6Mo-3Ga alloy annealed at (a)1073 K for 120 s and (b)1273 K for 3.6 ks.
0 1 2 3 4 5 6
200 300 400 500 600 700 800
Plastic Strain (%)
Stress, σ / MPa
[image:5.595.323.527.72.240.2]1073K/120s 1273K/3.6ks
Fig. 13 Remained plastic strain after cyclic loading-unloading tensile tests for the Ti-6Mo-3Ga alloy annealed at 1073 K for 120 s and 1273 K for 3.6 ks.
0 600
400
200 800
2%
1st 2nd 4th 5th
0 600
400
200
800 10th 20th 50th 100th
Strain, ε (%)
Stress,
σ
/ MPa
[image:5.595.321.533.315.505.2]4. Conclusion
(1) The martensitic transformation temperature decreased with increasing Mo and Ga content. The shape memory effect and superelastic behavior can be obtained at body temper-ature by controlling Mo and Ga contents. The martensitic
transformation start (Ms) temperature of Ti-6Mo-3Ga is close
to room temperature.
(2) The work-hardened structure and the formation of !
phase resulted in the premature failure in the Ti-6Mo-3Ga alloy which was annealed in the temperature range 673– 773 K. Ultimate tensile strength decreased and fracture strain increased with increasing heat treatment temperature due to recrystallization of cold-worked structure. Shape memory effect was obtained in the specimens heat-treated in the temperature range 1073–1273 K. The shape memory effect was due to the stress induced martensitic transformation during tensile deformation and the following reverse trans-formation during heating.
(3) The critical stress for slip decreased andMstemperature
increased with increasing heat treatment temperature and with decreasing heat treatment time. The higher critical stress for slip resulted in the larger shape recovery strain and more stable shape memory effect in the Ti-6Mo-3Ga alloy annealed at 1073 K for 120 s.
(4) The superelastic behavior with the recovery strain of 4% was obtained in Ti-7Mo-4Ga alloy. Ti-Mo-Ga alloys can be prospect biomedical shape memory and superelastic alloys at room temperature.
Acknowledgments
This work was partially supported by the 21 Century
Center of Excellence Program and the Grants-in-Aid for Fundamental Scientific Research(Kiban A(1999–2001), Ki-ban A(2002–2004)) from the Ministry of Education, Culture, Sports, Science and Technology, Japan.
REFERENCES
1) Y. Oshida and S. Miyazaki: Corros. Eng.40(1991) 1009–1025. 2) S. Miyazaki:Engineering Aspects of Shape Memory Alloys, Ed. by
T. W. Dueriget al., (Butterworth-Heineman, 1990) pp. 452–469. 3) S. Miyazaki and K. Otsuka: ISIJ Int.,29(1989) 353–377.
4) S. Shabalovskaya, J. Cunnick, J. Anderegg, B. Harmon and R. Sachdeva:Proc. First Inter. Conf. Shape Memory and Superelastic Technologies, (SMST, 1994) pp 209–215.
5) R. Davis, H. M. Flower and D. R. F. West: Acta Metall.27(1979) 1041–1052.
6) T. Ahmed and H. J. Rack: J. Mater. Sci.31(1996) 4267–4276. 7) R. Davis, H. M. Flower and D. R. F. West: J. Mater. Sci.31(1979) 712–
722.
8) W. F. Ho, C. P. Ju and J. H. Chern Lin: Biomaterials20(1999) 2115– 2122.
9) T. Grosdidier and M. J. Philippe: Mater. Sci. Eng.A291(2000) 218– 223.
10) H. Hosoda, Y. Ohmatsu and S. Miyazaki: Trans. MRS-J.,26(2001) 235–237.
11) H. Hosoda, N. Hosoda and S. Miyazaki: Trans. MRS-J.,26(2001) 243– 246.
12) C. Baker: Metal Sci. J.5(1971) 92–100.
13) K. Nitta, S. Watanabe, N. Masahashi, H. Hosoda and S. Hanada: Structural Biomaterials for the 21st Century, (TMS, 2001) pp. 25–34. 14) H. Hosoda, Y. Fukui, T. Inamura, K. Wakashima and S. Miyazaki and
K. Inoue: Mater. Sci. Forum426–432(2003) 3121–3125.
15) T. W. Duerig, J. Albrecht, D. Richter and P. Fischer: Acta Metall.30 (1982) 2161–2172.