Phase Transitions and Low-temperature Structure
of Lithium Manganese Oxide Spinel
Masao Yonemura,
1;2Takashi Kamiyama,
3Yoji Kawamoto
2and Ryoji Kanno
1* 1Department of Electronic Chemistry, Interdisciplinary Graduate School of Science and Engineering, Tokyo Institute of Technology, Yokohama 226-8502, Japan
2Department of Chemistry, Faculty of Science, Kobe University, Kobe 657-8501, Japan
3Neutron Science laboratory, Institute of Materials Structure Science, High Energy Accelerator Research Organization,
Tsukuba 305-0801, Japan
Low-temperature structures of the lithium manganese spinels were determined using TOF neutron Rietveld analysis. The spinels LiMn2O4with differentvalues, (0.016, 0.040, and 0.132) showed the cubic-orthorhombic phase transitions, and the lattice distortion decreased with decreasing. Although no anomaly corresponding to the cubic-orthorhombic phase transition was observed in the DSC curve for the spinel with0:016, the transition was observed by the structure analysis, which is consistent with the broadCpanomaly at 250 K. The cubic-orthorhombic phase transition is closely correlated to the existence of the vacancy. The charge disproportionation into trivalent and tetravalent state proceeds gradually with decreasing temperature, and the extent of the disproportionation is dependent on the vacancy. Based on the structure analysis, the phase transitions in the spinel are discussed.
(Received February 4, 2004; Accepted April 15, 2004)
Keywords: lithium manganese spinel, phase transition, charge-ordering
1. Introduction
Lithium manganese oxide spinels are a promising candi-date as cathodes in rechargeable lithium batteries because of their low cost and higher voltages than the layered rocksalt cathodes, LiMO2 (M=Co, Ni).1)Cathodic properties of the
lithium manganese spinels were influenced by synthesis conditions.2) Although many studies have been tried to
clarify the cathodic properties and to optimize the synthesis conditions, the dominant factors that determine their charac-teristics have remained obscure.
Another important aspect of the spinel is the phase transition associated with the Jahn-Teller trivalent manga-nese ion. Lattice distortion in the spinel is caused by the cooperative interaction of the Jahn-Teller Mn3þ ion on the
octahedral site. Three types of phases related to co-operative Jahn-Teller ordering were reported; (i) the tetragonal phase synthesized at high-temperatures and quenched to liq N2, (ii)
the tetragonal phase appeared during lithium intercalation from LiMn2O4, and (iii) the low-temperature phase appeared
around room temperature. The tetragonal phase (i) observed at high-temperature was stabilized at room temperature by quenching from 920C.3) Its structure has a cooperative
ordered arrangement of trivalent manganese ions.4,5) The
tetragonal phase (ii) appeared during the lithium intercalation has been studied in detail to clarify the charge-discharge characteristics of the 3 V region. The ordered arrangement of the elongated axis of the MnO6octahedra was similar to the
tetragonal Mn3O4 spinel. These types of ordering in the
tetragonal phases (i) and (ii) are well known to the spinels with Jahn-Teller ions. Low-temperature phase (iii) was first reported by Yamadaet al.6,7) to be a tetragonal phase. The transition proceeds gradually from the high-temperature cubic phase to the low-temperature tetragonal phase through
two-phase region with decreasing temperature. Later, the low-temperature structure was indicated to be orthorhombic with superlattice reflections,8) and the superstructure was solved by the 3a3a1a lattice.9) However, tetragonal symmetry was indicated again for the low-temperature phase,10) and more recently, the mixed two-phase region was again indicated by synchrotron X-ray diffraction study.11)
Considerable confusion in understanding the spinel is partly due to the sample dependence of their physical properties. The transition behavior changed with the compo-sitions which are dependent on synthesis procedures of each research groups. Significant discrepancy in understanding the spinel from the standpoint of solid-state chemistry is the presence of oxygen vacancy. The oxygen vacancy was indicated first by the thermogravimetry measurements.3,12,13)
Two structure models were proposed for the ‘‘oxygen vacancy’’ phase: vacancy at the oxygen site corresponding to the formula LiMn2O4, and excess cations at the
interstitial site with the formula, Li1þxMn2þyO4. These
models were, in fact, claimed by experimental results; the oxygen deficient spinel LiMn2O4 with vacancy clustering
based on the NMR data,13) oxygen vacancy indicated by
chemical analysis,14) and interstitial cations at the 16c
octahedral site in Fd33mspace group determined by density measurement.15)
Recently, we studied the structures of the spinels synthe-sized at temperatures over a range of750t900C with
Li/Mn ratios between 0.5 and 0.55 and various starting materials.20)The neutron Rietveld analysis of these samples
indicated that the oxygen vacancy exits at the oxygen 32e
site, and the spinels with nearly stoichiometric composition was difficult to obtain. The system was divided into three categories: oxygen deficient spinels, LiMn2O4, lithium
substituted spinels, Li1þxMn2xO4, and the stoichiometric
spinel, LiMn2O4. The ideal composition of Li1Mn2O4,
*Corresponding author, E-mail: kanno@echem.titech.ac.jp
Special Issue on Grain Boundaries, Interfaces, Defects and Localized Quantum Structures in Ceramics
however, could not be obtained. Oxygen vacancy in the spinel affects their electrochemical and phase transition properties. The magnetic measurements also indicated several anomalies corresponding to the transition around room temperature, long-range magnetic ordering due to anti-ferromagnetic interaction near 50 K, and short-range mag-netic ordering (spin-glass-like behavior) around 10 K. These transitions shift systematically with the amount of vacan-cy.19)
Based on our systematic characterization of the lithium manganese oxides spinel, re-examination of the charge-ordering phase transition is necessary. In the present study, we determined their structures at low-temperatures. Neutron diffraction is expected to be a powerful means to clarify structural details, because of the difference in the coherent scattering lengths of Li, Mn and O atomsðbcðLiÞ ¼ 1:900, bcðMnÞ ¼ 3:730, bcðOÞ ¼5:803fm). We confirmed the
orthorhombic structure for the low-temperature phase, and the orthorhombic distortion decreased with decreasing oxy-gen vacancy, . The relationship between the composition, structure, phase transitions is discussed.
2. Experimental
Three different samples were synthesized and used for low-temperature structure analysis. Table 1 summarizes the synthesis condition and room temperature structure param-eters for the samples used in the present study. The synthesis procedure of these samples are as follows.
Sample A: The lithium manganese spinel was prepared by heating appropriate molar ratios of Li2CO3 and Mn2O3
(Li2CO3: Nacalai tesque, >99:9% purity; Mn2O3: High
Purity Chemicals Laboratory Co., Ltd., >99:9% purity). They were mixed, pelleted, and then heated at 900C in an
oxygen atmosphere and a cooling rate of 100C/h. No
impurity phase was observed. In the oxygen32esite, a small amount of vacancy was observed with a value of occupation parameter,g¼0:9666(16) at 325 K. The composition deter-mined by the structure analysis was LiMn2O3:868.
Sample B: The spinels close to the stoichiometric compo-sition were synthesized from starting materials of the manganese oxide obtained by thermal decomposition of manganese oxalate at 400C (Manganese oxide: Toda Kogyo
Co., Ltd.). The appropriate molar ratio of LiOHH2O
[image:2.595.44.549.391.469.2](LiOHH2O: Nacalai tesque) and the manganese oxide were
Table 1 Rietveld refinement results for samples mesured by neutron diffraction experiments.
Sample Mixing Lattiec pa- Starting Synthesis condition Cooling rate Impurty Measurement label Composition g(O) Li/Mn rameters materials Temperature Atomsphare t/C h1 phase temperature
ration a/nm t/C T/K
A LiMn2O4 ¼0:132 0.9666(16) 0.5 0.824609(14) Li2CO3,Mn2O3 900 O2 100 no 325
B LiMn2O4 ¼0:040 0.990(7) 0.5 0.823803(8) LiOH,MnOx 470(1)/750 Air/O2 60 no 300
C LiMn2O4 ¼0:016 0.996(7) 0.5 0.823785(13) LiOH,MnOx 470(3)/750 Air/O2 60 no 300
Intensity 47 46 45 44 43 42
2θ / °
300K 290K 280K 270K 240K 210K 180K 150K 120K 110K 100K 90K 80K 70K 60K 50K 40K 30K 20K 11K (a) Sample A
Intensity 47 46 45 44 43 42
2θ / °
300K 290K 280K 270K 240K 210K 180K 150K 120K 110K 100K 90K 80K 70K 60K 50K 40K 30K 20K 10K (b) Sample B
Intensity 47 46 45 44 43 42
2θ / °
300K 290K 280K 270K 240K 210K 180K 150K 120K 110K 100K 90K 80K 70K 60K 50K 40K 30K 20K 10K (c) Sample C
Fig. 1 (a) X-ray diffraction patterns of LiMn2O3:868(sample A) between 10 and 300 K. (b) X-ray diffraction patterns of LiMn2O3:960
[image:2.595.57.540.495.755.2]mixed with a Li/Mn ratio of 1/2, pelletized, and heated at 470C for 6 h in air. The samples were then ground with
pestle and mortar, and made pellets again. After the pre-heating process, these pellets were heated at 750C for 24 h
with a heating and cooling rate of 60Ch1. The neutron
diffraction measurements indicated that the occupation parameter at the oxygen 32e site was 0.990(7) at 300 K. The composition determined was LiMn2O3:960.
Sample C: The sample C was synthesized by the same starting materials as the sample B. The starting materials were mixed with a Li/Mn ratio of 1/2, pelletized, and heated at 470C for 6 h in air. The samples were then ground with
pestle and mortar, and made pellets again. The pre-heating process was repeated by 3 times. After the pre-heating process, these pellets were heated at 750C for 24 h with a
heating and cooling rate of 60Ch1. The room temperature
structure analysis indicated that the amount of oxygen at the
32e oxygen site was 0.998(6) at 300 K. The composition determined was LiMn2O3:984.
X-Ray diffraction patterns of the powdered samples were obtained with an X-ray diffractometer (Rigaku RAD-C, 12 kW) with CuK radiation. The diffraction data were collected at each 0.02step width over a2range from 10 to
100. The low-temperature X-ray diffraction patterns were
taken in the temperature range between 10 and 300 K. Differential scanning calorimetry (DSC) was measured by a TAS-200 (Rigaku) between 150 and 360 K at a heating and cooling rate of 10 K/min. Neutron diffraction data for the spinels were taken between 5 and 325 K on a time-of-flight (TOF) neutron powder diffractometer, VEGA, at the KENS
Intensity
0.22
0.21
0.20
0.20
0.21
0.22
0.20
0.21
0.22
d
/ nm
Sample A
(a)
= 0.132
Sample B
= 0.040
Sample C
= 0.016
325K
260K
150K
300K
260K
150K
300K
150K
δ
δ
δ
Intensity
0.220
0.215
0.210
0.205
0.200
d
/ nm
A
B
C
(b) 150K
[image:3.595.51.535.64.568.2]pulsed spallation neutron source at the National Laboratory for High Energy Accelerator (KEK). The specimen of (ca. 5 g) was contained in a cylindrical vanadium cell of dimensions 5 mm in radius, 55 mm in height, and 200mm
in thickness. The structural parameters were refined with RIETAN-2001T.16)
3. Results and Discussion
[image:4.595.67.524.66.372.2]The structural changes with temperature were studied by X-ray diffraction and neutron diffraction measurements. Figure 1 shows the X-ray diffraction patterns for the samples A, B, and C, recorded from 300 K to 10 K on cooling. Figure 2
0.828
0.826
0.824
0.822
0.820
Lattice parameters
a, b, c
/ nm
300
200
100
0
Temperature
T
/ K
c b a
Fig. 3 Temperature dependence of lattice parameters for LiMn2O3:868
(sample A) between 10 and 300 K. The data were obtained by X-ray diffraction measurements.
0.828
0.826
0.824
0.822
0.820
Lattice parameters
a, b, c
/ nm
300
200
100
0
Temperature
T
/ K
a
b
c
Fig. 4 Temperature dependence of lattice parameters for LiMn2O3:984
[image:4.595.72.267.69.346.2](sample C) between 10 and 300 K. The data were obtained by X-ray diffraction measurements.
Table 2 Neutron Rietveld refinement results at 150 K for LiMn2O4(¼0:132) (sample A).
Atom Site g x y z U/nm2
Li1 32h 1 0.289(14) 0.2869(8) 0.127(3) 0.0061(8)
Li2 16e 1 0.293(17) 5/8 1/8 =Li1(B)
Li3 8a 1 3/8 3/8 7/8 =Li1(B)
Li4 16f 1 3/8 0.547(1) 3/8 =Li1(B)
Mn1 16d 1 1/4 1/4 1/2 0.016(15)
Mn2 32h 1 0.2511(3) 0.3337(5) 0.7529(16) 0.0024(7)
Mn3 32h 1 0.3311(5) 0.2435(3) 0.7511(17) 0.0036(8)
Mn4 32h 1 0.3360(4) 0.3273(3) 0.4969(14) 0.0010(8)
Mn5 32h 1 0.3304(4) 0.5848(4) 0.7491(18) 0.0029(7)
O1 32h 1 0.2561(3) 0.2585(2) 0.7560(7) 0.0100(10)
O2 32h 1 0.2565(2) 0.3279(2) 0.5170(6) 0.0056(7)
O3 32h 1 0.2479(2) 0.5897(2) 0.7332(7) 0.0061(9)
O4 32h 1 0.3267(2) 0.2452(2) 0.5237(6) 0.0022(7)
O5 32h 1 0.3330(2) 0.3252(2) 0.7370(6) 0.0040(7)
O6 32h 1 0.3252(2) 0.5871(2) 0.5137(6) 0.0064(8)
O7 32h 0.78(1) 0.3372(3) 0.3334(3) 0.2698(7) 0.0035(8)
O8 32h 1 0.3392(2) 0.50965(12) 0.7601(6) 0.0024(7)
O9 32h 1 0.3372(3) 0.5844(2) 0.9872(7) 0.014(1)
[image:4.595.334.524.72.346.2] [image:4.595.48.551.434.667.2]shows the neutron diffraction (400)c peaks at low
temper-atures. The samples A and B show the peak splittings at 270 K, corresponding to the orthorhombic symmetry, and the sample C shows only peak broadening at 150 K. The peak splittings at 150 K shown in Fig. 2(b) indicates that the orthorhombic distortion decreased with decreasing from 0.132 to 0.006.
The peak splittings below 280 K for the sample A were indexed by an orthorhombic cell. There are also small diffraction peaks corresponding to the superlattice reflec-tions. The electron diffraction measurements indicated the
cubic symmetry witha0:824nm at 300 K. At 120 K, the superlattice reflections were observed and indexed by the
3a3aa cell based on the parent cubic cell of a. The orthorhombic lattice of space group Fddd9)is used for our
structure refinement. Figure 3 shows the temperature depend-ence of the lattice parameters of the sample A. With decreasing temperature from 300 K, the orthorhombic dis-tortion appeared at 290 K and the disdis-tortion decreased gradually with decreasing temperature. Around 40 K, theb
[image:5.595.49.548.84.317.2]axis increases, and the a andb axes become close to each other. This anomaly corresponds to the anti-ferromagnetic
Table 3 Neutron Rietveld refinement results at 200 K for LiMn2O4(¼0:132) (sample A).
Atom Site g x y z U/nm2
Li1 32h 1 0.2905(14) 0.2884(11) 0.123(4) 0.0075(8)
Li2 16e 1 0.2901(17) 5/8 1/8 =Li1(U)
Li3 8a 1 3/8 3/8 7/8 =Li1(U)
Li4 16f 1 3/8 0.5452(16) 3/8 =Li1(U)
Mn1 16d 1 1/4 1/4 1/2 0.0016(13)
Mn2 32h 1 0.2513(3) 0.3329(5) 0.7561(15) 0.0018(8)
Mn3 32h 1 0.3309(5) 0.2436(3) 0.7497(17) 0.0048(9)
Mn4 32h 1 0.3372(4) 0.3279(3) 0.4968(14) 0.0012(9)
Mn5 32h 1 0.3304(4) 0.5848(4) 0.7491(18) 0.0029(7)
O1 32h 1 0.2558(3) 0.2575(3) 0.7553(7) 0.0097(12)
O2 32h 1 0.2557(2) 0.3270(2) 0.163(7) 0.0016(7)
O3 32h 1 0.2479(2) 0.5897(2) 0.7333(7) 0.0047(9)
O4 32h 1 0.3268(2) 0.2456(2) 0.5233(6) 0.0015(7)
O5 32h 1 0.3331(2) 0.3245(2) 0.7375(7) 0.0044(8)
O6 32h 1 0.3252(2) 0.5868(2) 0.5138(7) 0.0047(7)
O7 32h 0.788(13) 0.3376(3) 0.3332(3) 0.2699(8) 0.0056(9)
O8 32h 1 0.3387(3) 0.50966(17) 0.7609(7) 0.0024(7)
O9 32h 1 0.3371(3) 0.5841(3) 0.9868(8) 0.0127(11)
Space groupFddd,a¼2:47438(6) nm,b¼2:48352(6) nm,c¼0:819577(18) nm,Rwp¼6:31,Rp¼4:64,S¼Rwp=Re¼1:0499,RI¼1:73,RF¼2:06.
Table 4 Neutron Rietveld refinement results at 260 K for LiMn2O4(¼0:132) (sample A).
Atom Site g x y z U/nm2
Li1 32h 1 0.2896(14) 0.2869(11) 0.128(4) 0.0075(8)
Li2 16e 1 0.2934(17) 5/8 1/8 =Li1(U)
Li3 8a 1 3/8 3/8 7/8 =Li1(U)
Li4 16f 1 3/8 0.5474(16) 3/8 =Li1(U)
Mn1 16d 1 1/4 1/4 1/2 0.0016(13)
Mn2 32h 1 0.2511(3) 0.3337(5) 0.7530(15) 0.0018(8)
Mn3 32h 1 0.3311(5) 0.2435(3) 0.7512(17) 0.0048(9)
Mn4 32h 1 0.3360(4) 0.3274(3) 0.4969(14) 0.0012(9)
Mn5 32h 1 0.3304(4) 0.5848(4) 0.7491(18) 0.0029(7)
O1 32h 1 0.2561(3) 0.2585(3) 0.7561(7) 0.0097(12)
O2 32h 1 0.2565(2) 0.3279(2) 0.5170(7) 0.0016(7)
O3 32h 1 0.2479(2) 0.5897(2) 0.7333(7) 0.0047(9)
O4 32h 1 0.3268(2) 0.2453(2) 0.5237(6) 0.0067(9)
O5 32h 1 0.3330(2) 0.3252(2) 0.7370(7) 0.0047(9)
O6 32h 1 0.3252(2) 0.5871(2) 0.5137(6) 0.0059(9)
O7 32h 0.790(13) 0.3372(3) 0.3335(3) 0.2699(7) 0.0035(9)
O8 32h 1 0.3393(2) 0.50965(17) 0.7602(7) 0.0030(8)
O9 32h 1 0.3372(3) 0.5845(2) 0.9872(8) 0.0117(11)
[image:5.595.50.548.384.617.2]12000
10000
8000
6000
4000
2000
0
Intensity
0.35
0.30
0.25
0.20
0.15
0.10
0.05
d
/ nm
30002000
1000
0
Intensity
0.14 0.13 0.12 0.11 0.10 0.09
d / nm
Fig. 5 Neutron Rietveld refinement pattern for the sample A at 150 K.
0.215
0.210
0.205
0.200
0.195
Interatomic distance
l
/ nm
300 200
100
Temperature T / K Mn1
Mn4 Mn5 0.200
0.198
0.196
0.194
0.192
Interatomic distance
l
/ nm
300 200
100
Temperature T / K AveMn1
AveMn2 AveMn3 AveMn4 AveMn5
Mn4
Mn1
Mn5
Mn3
Mn2
z - axis
y - axis
x - axis
Jahn Teller long axis
Average interatomic distance
Jahn Teller short axis
(a) (b)
[image:6.595.64.542.71.347.2] [image:6.595.109.490.414.730.2]transition, and the phase below 40 K is close to tetragonal as indicated previously.17)
For the sample C, on the other hand, the peak splittings were not clearly observed at low-temperatures. However, peak-shift to higher angles was observed from 240 to 210 K, which is the opposite direction of the shift from 290 to 240 K. Peak broadening was also observed. This indicates the phase transition around 240 K. The lattice parameter was then refined using the same symmetry as the sample A. Figure 4 shows temperature dependence of the lattice parameters for LiMn2O3:984(sample C). DSC measurements on the sample
C showed no heat anomaly corresponding to the phase transition around room temperature, while the samples A and B showed large heat anomaly due to the cubic-orthorhombic phase transition. Adiabatic calorimetry measurement on the sample C, on the other hand, indicated small anomaly in the
Cp vs. T curves around 220 K corresponding to the charge ordering phase transition.19) The lattice parameter changes
indicates the distortion below 240 K which is consistent with the calorimetry results.
Previously, the lattice symmetry of the low-temperature phases was considerably confusing. This is caused by the difference in the compositions of the spinels used for the structure determination. The charge-ordering phase transition exists for all the samples examined in the present study, and the extent of orthorhombic distortion decreased with de-creasing . The tetragonal symmetry reported previously10) corresponds to the phase with small distortion of the low-temperature phase with large amount of vacancy. We did not used the two-phase mixture model with the tetragonal and cubic phases11) for the refinement of low-temperature
structures because all the diffraction peaks were successfully indexed by the orthorhombic structure model.
The low-temperature structure of the sample A was determined using neutron diffraction data and the3a3a
alattice with oxygen vacancy in the structure. The structure model was similar to that reported previously.9)Tables 2–4
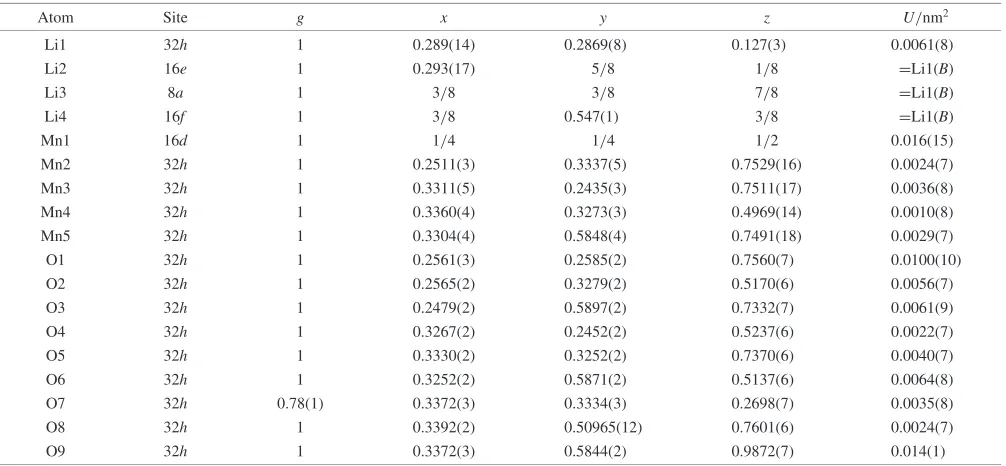
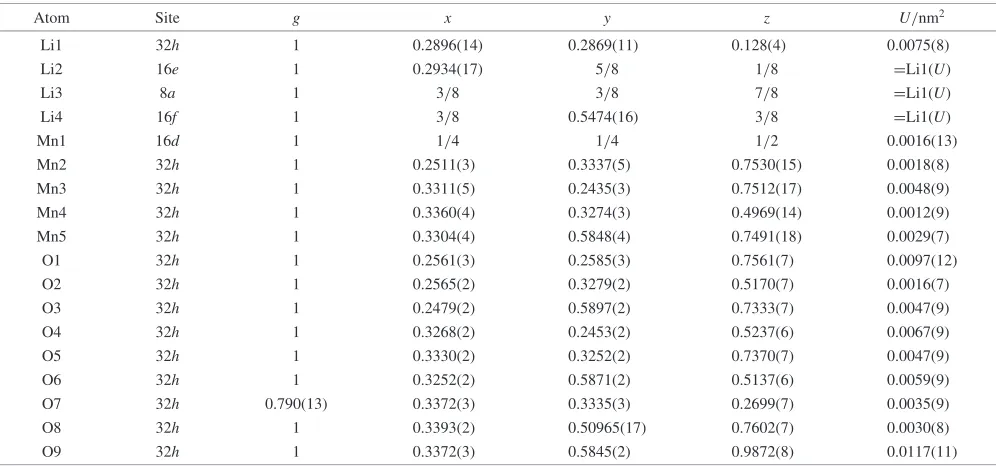
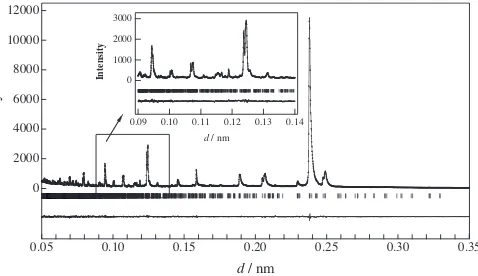
summarize the refinement results at 150, 200, and 260 K. The final R factors, lattice and structural parameters with their estimated standard deviations in parentheses are indicated. Figure 5 illustrates the profile fit and difference pattern at 150 K; the calculated pattern fits the observed one fairly well. The Li site splits from 1 to 4, the Mn ions site from 1 to 5 sites, and the O site from 1 to 9 at low temperatures. During the refinements, the O7 site was found to be different from other oxygen site. The occupation parameter was then refined. The refinement suggests the existence of oxygen vacancy at the O7 site.
Figure 6 shows the temperature dependence of the Mn-O bond distances. Two different sets of Mn-O distances are observed, three of five Mn-O distances are larger than the other set of two Mn-O distances. Longer distances of Mn4-O, Mn1-O, and Mn5-O corresponds to lower valence state(-Mnð3þÞþ), and shorter distances of Mn3-O and Mn2-O to
higher valence state(Mnð4þÞ). The elongated Jahn-Teller
axis of the trivalent manganese ions, Mn1(16d), Mn4(32h) and Mn5(32h) ordered along the z, x, and y direction, respectively. Particularly, the bond distance of the elongated axis in Mn5-O increased with decreasing temperature. This corresponds to the charge-ordering process accompanying
electron transfer from the Mn3 to Mn5 sites. Figure 7 shows schematic drawing of the MnO6 octahedra of trivalent
manganese ions. The elongated Jahn-Teller long axis of the Mn1, Mn4, and Mn5 sites ordered alongz,y, andxdirections, respectively. For the tetragonal spinel obtained by quenching from 920C, the elongated octahedral axis ordered only inz
direction, that caused the tetragonal symmetry.4)The
ortho-rhombic phase has different orientation of the elongated axis, and this gives the structure with the lattice symmetry of
Fddd. The average Mn4–O distance is larger than those of Mn1–O and Mn5–O distances, indicating smaller value in Mnð3þÞþ. The O7 site is closely situated to the Mn4 site.
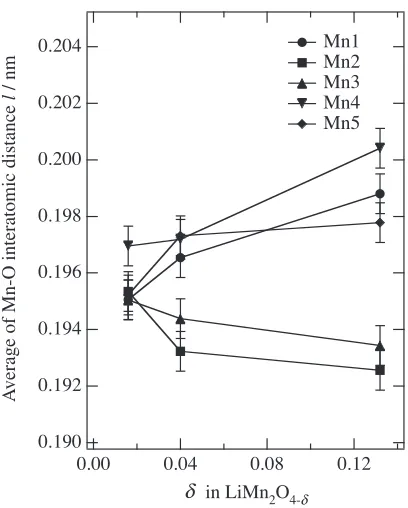
The structure parameters of the samples B and C were refined using the neutron diffraction data at 150 K and the structure model similar to the sample A at 150 K. The interatomic distances were calculated base on the refined structure parameters. Figure 8 shows the average Mn-O
O2
O4
O2 O4
O1 O1
O4
O2 O5
O7 O7
O7 O6
O6 O9
O9 O8
O3
z
y
x
(a) Mn1 (b) Mn4 (c) Mn5
Fig. 7 Schematic drawing of the MnO6octahedra of trivalent manganese
ions. The elongated axes ordered in different directions for each Mn sites.
0.204
0.202
0.200
0.198
0.196
0.194
0.192
0.190
A
verage of Mn-O interatomic distance
l
/ nm
0.12 0.08
0.04 0.00
in LiMn2O
Mn1 Mn2 Mn3 Mn4 Mn5
δ δ
[image:7.595.307.554.73.223.2] [image:7.595.326.530.501.755.2]distances for five manganese sites at 150 K as a function of oxygen vacancy. Longer Mn-O distances corresponds to the Mnð3þÞþ state, and shorter Mn-O distances to the Mnð4þÞ
state. With decreasing oxygen vacancy, the difference between the Mn-O(long) and Mn-O(short) distances become small. The charge-ordering in the spinel structure is closely correlated to the amount of oxygen vacancy.
Previously, we reported the room temperature structures of lithium manganese oxide spinels with different synthesis conditions.20)The phase transitions in LiMn
2O4depend on
the amount of oxygen vacancy: (i) the charge-ordering transition shift from 300 to 250 K, (ii) the anti-ferromagnetic transition also shift from 60 to 40 K, and (iii) the short-range magnetic ordering (spin-glass-like behavior) shifts from 20 to 40 K with decreasing. We concluded that the stoichiometric spinel LiMn2O4 was difficult to synthesize and the ideal
composition might show no charge-ordering phase transition. The present X-ray and neutron diffraction study also indicated that the extent of orthorhombic distortion is related to the amount of oxygen vacancy. The neutron diffraction study suggests the vacancy at the O7 site which situates close to the Mn4 site with the lowest charge among the five manganese sites. The transition behavior observed for the spinel is closely correlated to the existence of oxygen vacancy.
Acknowledgement
This work was supported partly by a Grant-in-Aid from The Ministry of Education, Culture and Sports, Science and Technology of Japan, and partly by Genesis Research Institute.
REFERENCES
1) M. M. Thackeray, W. I. F. David, P. G. Bruce and J. B. Goodenough:
Mater. Res. Bull.,18(1983) 461.
2) Y. Xia and M. Yoshio:J. Electrochem. Soc.,144(1997) 4186. 3) A. Yamada, K. Miura, K. Hinokuma and M. Tanaka:J. Electrochem.
Soc.,142(1995) 2149.
4) R. Kanno, A. Kondo, M. Yonemura, R. Gover, Y. Kawamoto, M. Tabuchi and T. Kamiyama, F. Izumi, C. Masquelier, and G. Rousse:J. Power Sources,81(1999) 542.
5) P. Strobel, F. L. Cras, L. Seguin, M. Anne and J. M. Tarascon:J. Solid State Chem.,135(1998) 132.
6) A. Yamada and M. Tanaka:Mater. Res. Bull.,30(1995) 715. 7) A. Yamada:J. Electrochem. Soc.,122(1996) 160.
8) K. Oikawa, T. Kamiyama, F. Izumi, B. C. Chakoumakos, H. Ikuta, M. Wakihara, J. Li and Y. Matsui:Solid State Ionics,109(1998) 35. 9) G. Rousse, C. Masquelier, J. Rodriguez-Carajal and M. Hervieu:
Eletrochem. Solid-State Lett.,2(1)(1996) 6.
10) A. S. Wills, N. P. Raju and J. E. Greedan:Chem. Mater.,11(1999) 1510.
11) X. Q. Yang, X. Sun, M. Balasubramanian, J. McBreen, Y. Xia, T. Sakai and M. Yoshio:Electrochem. Solid-State Lett.,4(2001) A117. 12) J. Sugiyama, T. Atsumi, T. Hioki, S. Noda and N. Kamegashira:
J. Power Sources.,68(1997) 641.
13) J. Sugiyama, T. Atsumi, A. Koiwai, T. Sasaki, T. Hioki, S. Noda and N. Kamegashira:J. Phys. Condens. Matter.,9(1997) 1729. 14) Y. Chida, H. Wada and K. Shizuka:J. Power Sources,81–82(1999)
454.
15) M. Hosoya, H. Ikuta, T. Uchida and M. Wakihara:J. Electrochem. Soc.,144(1997) L52.
16) F. Izumi, ‘‘The Rietveld Method,’’ ed. by R. A. Young: Oxford Univ. Press, Oxford, (1993) Chap. 13.
17) H. Hayakawa, T. Takada, H. Enoki and E. Akiba:Powder Diffraction,
15, (2000) 19.
18) G. Rousse, C. Masquelier, J. Rodriguez-Carvajal, E. Elkaim, J.-P. Lauriat and J. L. Martinez:Chem. Mater.,12(1999) 3629.
19) M. Tachibana, T. Tojo, H. Kawaji, T. Atake, H. Yonemura and R. Kanno:Phys. Rev. B,68(2003) 094421.


