Heat-emission analysis of small combustion equipments
for biomass
J. Malaťák, L. Passian
Department of Technological Equipment of Buildings, Faculty of Engineering,
Czech University of Life Sciences Prague, Prague, Czech Republic
Abstract
Malaťák J., Passian L., 2011. Heat-emission analysis of small combustion equipments for biomass. Res. Agr. Eng., 57: 37–50.
The article addresses the urgent questions regarding the use of biomass as a fuel for combustion equipment of the heat output up to 25 kW. The article is based on the determined elemental analyses of six samples of fuel taken both from the wood mass and herbaceous biomass. These samples underwent the stoichiometric analysis of fuels. After the stoi-chiometric analysis the heat-emission characteristics were determined on two combustion equipments. The results of carried out elemental and stoichiometric analyses indicate higher values of nitrogen, sulphur and chlorine concentration in herbaceous biomass from agriculture compared to the analyzed wood mass. The selection of combustion equipment is particularly influenced by increased contents of sulphur and chlorine (corrosive behaviour). The net calorific value of the analyzed samples taken from the wood mass is higher than of samples taken from the herbaceous biomass. The net calorific value of fuels from herbaceous biomass is reduced due to a higher content of ashes in the fuel. The results of thermal-emission analyses show higher values of nitrogen oxides, sulphur and chlorine concentrations in the her-baceous biomass compared to the analyzed wood mass. The emission concentrations of carbon monoxide for wood fuels and herbaceous biomass also depend on the type of combustion equipment and setting of combustion air volume. The increased emissions of hydrogen chloride generated by various combustion equipments are primarily caused by the volume of combustion air and the amount of chlorine in the fuel itself. The higher the volume of combustion air brought into the combustion chamber is, the higher the emissions of hydrogen chloride are. Based on the analyses we can also draw a conclusion that the spaces of combustion equipment during combustion should be most burdened with the herbaceous biomass.
Keywords:biomass; chemical analysis; stoichiometric analysis; net calorific value; emission
Supported by the Internal Grants Agency of the Czech University of Life Sciences Prague, Czech Republic, Project No. 20103001. In the longterm perspective of a sustainable
de-velopment it is very important to use the energy resources in the most efficient way. Of course also the use of financial “resources” should be opti-mized in order to reduce the impacts on human health and the environment as much as possible, while the created abundance is becoming more easily available to all parts of the world’s
popula-tion. In the medium-term perspective the climate changes are influenced by the emissions of green-house gases from human activities. These changes should be appropriately identified (Hedberg et al. 2002; Malaťák et al. 2007a).
conditions of sustainable development not only of agriculture, but also of the whole society. It is indi-cated that during the last twenty years the global share of herbaceous biomass from agriculture (pre-dominantly it is the wood) in the total consumption of primary energy sources increased by 8%. This increase occurs not only in developing countries where wood is often the only source of energy, es-pecially in rural areas (four fifths of timber extracted in some developing countries are consumed as fire-wood), but the consumption of wood or fuels based on wood also increases in developed countries.
The fossil fuels can be partially replaced with the solid biofuels; thereby the volumes of waste arising from fossil fuels extraction and processing are re-duced, which means a contribution to an increased efficiency of resources. It can be expected that solid fuels based on biomass will reduce the emissions of fossil carbon into the atmosphere and similarly they will be reduced the emissions of greenhouse gasses from anthropogenic activities. Therefore the solid biofuels based on biomass constitute the source of storable solar energy (Jevič et al. 2007; Malaťák, Vaculík 2008; Fiedler, Persson 2009).
If it has to be decided whether the biomass is suit-able for burning in a particular type of combustion equipment and to assess the quality of the biofuels from the phytomass in view of their use is necessary to know the properties of biofuels that characterize them sufficiently. From the energy perspective the elemental and stoichiometric analyses are crucial in assessment. The fuel characteristics are support-ed by the stoichiometric calculations of the com-bustion processes and any thermal calculation is based on them. They are particularly important for solving many problems in the design practice as well as for controlling the work of existing combus-tion plants (Jevič et al. 2007; Khor et al. 2007).
In the article other options and limit values of the utilization of solid biomass energy are defined. Therefore it is based on the chemical composition
of used fuels, ashes, stoichiometric calculations and the operational parameters of a given type of combustion equipment.
The article aims to formulate such dependencies that as much as possible judge both the combustion process and the quality of combusted fuels from biomass and the combustion equipments. In these analyses there is first of all determined the calo-rific value of fuel, volume of oxygen (air) required for a complete combustion of fuel, the quantity and composition of flue gas and specific weight of flue gas. The other aim is to determine the thermal emission characteristics and to minimize the emis-sion indicators of the combustion equipments for the utilization of solid biomass energy in accord-ance with applicable legislation and standards.
MAteriAL And MetHods
The article is mainly based on elemental and stoi-chiometric analysis. The resulting values of the sto-ichiometric analysis are inserted into the equations for pollutant concentrations conversion and into the equations for determining the coefficient of ex-cess air. From the stoichiometric analysis, the theo-retical volume concentration of carbon dioxide in dry flue gas, the theoretical volume of dry flue gas and the theoretical volume of air for complete com-bustion of fuels are inserted into these relations.
In total, 100 measurements were carried out at the combustion equipments for the solid biomass. Twelve measurements that were carried out on two combustion equipments were selected for the as-sessment of thermal-emission measurements. The analyzed woody fuels and agrofuels according to the ČSN P CEN/TS 15 234 (2007) specification are listed in Table 1.
[image:2.595.70.535.671.758.2]The determination of the chemical properties is the first task of the solution of the assessed fuel samples as follows:
Table 1. Analyzed wood fuels and herbaceous biomass from agriculture (specification according to ČSN P CEN/TS 15 234, 2007)
Wood fuels Herbaceous biomass from agriculture
Forest wood chips (spruce) pellets (Ø 10 mm) energy sorrel pellets (Ø 11 mm)
Poplar pellets (Ø 10 mm) lucerne pellets (Ø 8 mm)
the water content in the received W
• (w %, weight tr
percentage) – the method of drying in an oven – the water content in the analytical test sample (ČSN EN 14 774-3, 2010),
determination of ash content in the as received •
Ar (w %) (ČSN EN 14 775, 2010),
determination of calorific value Q (MJ/kg) (ČSN •
EN 14 918, 2010),
determination of the content of volatile matter •
V (w %) (ČSN EN 15 148, 2010),
determination of total content of carbon (C
• t),
hydrogen (Ht) and nitrogen (Nt) – instrumental methods (ČSN CEN/TS 15 104, 2006),
determination of total content of sulphur (S
• t)
and chlorine (Clt) (w %) (ČSN P CEN/TS 15 289, 2006).
The elemental analyses are developed in the form of services provided by the accredited laboratory: Institute for Research and Use of Fuels, Prague-Běchovice, Czech Republic and Institute of Chemi-cal Technology, Prague, Czech Republic. The result-ing values of the elemental analysis for individual samples of fuel taken from wood and herbaceous mass are given in Table 2.
The chemical properties are followed by the stoichiometric analysis of combustion processes that supports the characteristics of fuel and con-stitutes the basis for any thermal calculation. This analysis is particularly important for addressing a range of problems in the design practice or
control-ling the work of existing combustion equipments. This analysis will identify:
the net calorific value of the sample Q
• r
i (MJ/kg),
the oxygen (air) volume required for complete •
combustion of the sample (kg/kg), (m3N/kg),
the quantity and composition of flue gas (kg/kg), •
(m3 N/kg),
the specific volume of flue gas (V %, volume per-•
centage).
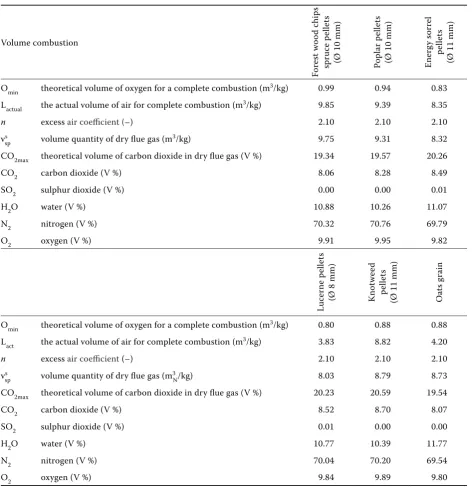
The stoichiometric analysis is converted to the standard conditions and reference oxygen content in the flue gas. Net calorific value of fuel in the cal-culations is given by the net calorific value of the original sample, i.e. when the sample in the origi-nal condition was taken. The resulting values of the stoichiometric analysis are shown in Table 3.
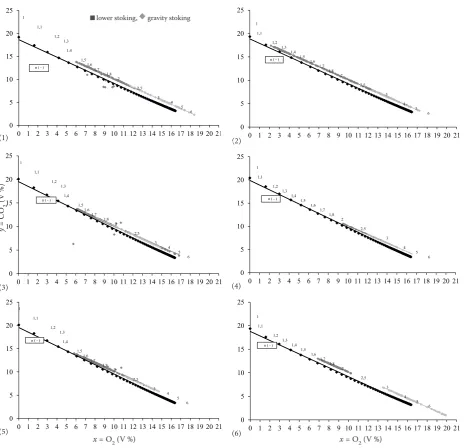
[image:3.595.64.536.531.759.2]The article aims to assess the theoretical and measured graphic dependence of the carbon diox-ide on the oxygen volume in the flue gas with the formulation of excess air coefficient on the original fuel under normal conditions. These dependencies are based on the stoichiometric analysis for the co-efficient of excess air in the range of 1–6. The oxy-gen content in flue gas (O2) is plotted to the x axis and the carbon dioxide (CO2) content is plotted to the y axis. The resulting curve shows the coefficient of excess air. Into the theoretical formulation of the carbon dioxide dependence on the oxygen volume in the flue gas with the formulation of the excess air coefficient on the original sample under normal
Table 2. Chemical analysis as received of solid fuels taken from the woody biomass and herbaceous biomass from agriculture Sample W at er c on ten
t (w %)
A
she
s (w %)
C om bu st ib le m at te r vol
atile (w %)
C om bu st ib le m at te r non-vol
atile (w %)
G ro ss c al or ifi c va lu e (M J/ kg ) N et c al or ifi c va lu e (M J/kg) C arb
on C (w %)
H
ydr
ogen H (w %)
Nitr
ogen N (w %)
Sulph
ur S (w %)
O
xy
gen O (w %)
C
hlor
ine C
l (w %)
Symbol Wr
t Ar Vr (NV)r Qrs Qri Ctr Htr Ntr Srt Ort Clrt
Forest wood chips (spruce)
pellets (Ø 10 mm) 6.79 3.02 75.55 14.64 18.74 17.18 47.37 6.40 0.19 0.01 36.20 0.04
Poplar pellets (Ø 10 mm) 6.17 4.04 75.43 14.36 18.2 16.84 46.16 5.51 0.52 0.03 32.54 0.03
Energy sorrel spruce pellets
(Ø 11 mm) 7.95 4.45 70.07 17.53 16.54 15.16 42.7 5.42 1.65 0.11 37.61 0.11
Lucerne pellets (Ø 8 mm) 11.4 8.15 65.16 15.33 16.61 15.34 41.24 4.55 2.85 0.16 31.12 0.22
Knotweed pellets
(Ø 11 mm) 5.93 3.99 72.03 18.05 17.62 16.31 45.87 5.33 0.29 0.03 38.49 0.07
conditions the actual values measured on individu-al combustion equipments are inserted.
At such defined dependencies the percentage of carbon dioxide is graphically determined when combusting the sample as well as the value of the coefficient of excess air that is contained in the flue gas. For practical purposes it is necessary to know the actual value of the oxygen (O2) content in the flue gas in the measured combustion equipment. An optimal combustion of wood fuels and
herba-ceous biomass from agriculture should run at the excess air coefficient n = 2.1 (i.e. at 11% of the oxy-gen content in the flue gas).
All volumes and weights of the combustion air and flue gas are given under so-called normal con-ditions, i.e. at t = 0°C and pressure p = 101.325 kPa and to the reference content of oxygen in the flue gas Or = 11%.
[image:4.595.63.536.110.598.2]The setting of emission concentrations of indi-vidual flue gas components is an important task.
Table 3. The stoichiometric analysis of the original fuel samples under normal conditions and reference oxygen content in the flue gas Or = 11%
Volume combustion
Fo
re
st
w
oo
d
ch
ip
s
sp
ru
ce
p
el
le
ts
(Ø 10 mm) Poplar
p
el
le
ts
(Ø 10 mm) Ener
gy
so
rr
el
pe
lle
ts
(Ø 11 mm)
Omin theoretical volume of oxygen for a complete combustion (m3/kg) 0.99 0.94 0.83
Lactual the actual volume of air for complete combustion (m3/kg) 9.85 9.39 8.35
n excess air coefficient (–) 2.10 2.10 2.10
vs
sp volume quantity of dry flue gas (m3/kg) 9.75 9.31 8.32
CO2max theoretical volume of carbon dioxide in dry flue gas (V %) 19.34 19.57 20.26
CO2 carbon dioxide (V %) 8.06 8.28 8.49
SO2 sulphur dioxide (V %) 0.00 0.00 0.01
H2O water (V %) 10.88 10.26 11.07
N2 nitrogen (V %) 70.32 70.76 69.79
O2 oxygen (V %) 9.91 9.95 9.82
Lu
ce
rn
e
pe
lle
ts
(Ø 8 mm) Kno
tw
ee
d
pe
lle
ts
(Ø 11 mm) Oat
s g
rain
Omin theoretical volume of oxygen for a complete combustion (m3/kg) 0.80 0.88 0.88
Lact the actual volume of air for complete combustion (m3/kg) 3.83 8.82 4.20
n excess air coefficient(–) 2.10 2.10 2.10
vs
sp volume quantity of dry flue gas (m3N/kg) 8.03 8.79 8.73
CO2max theoretical volume of carbon dioxide in dry flue gas (V %) 20.23 20.59 19.54
CO2 carbon dioxide (V %) 8.52 8.70 8.07
SO2 sulphur dioxide (V %) 0.01 0.00 0.00
H2O water (V %) 10.77 10.39 11.77
N2 nitrogen (V %) 70.04 70.20 69.54
The measurements must be carried out in accord-ance with ČSN 12 4070 (1990), ČSN 38 5509 (1991), ČSN 07 0240 (1993) and ČSN 44 1310 (2001).
The device Madur GA-60 (Madur Electronics, Vienna, Austria) is used for the determination of emission concentrations of individual flue gas com-ponents developed during the combustion of used herbaceous biomass from agriculture and wood mass samples. This is a multi-purpose analyzer of flue gas. Its principle is based on the use of electrochemical converters. The standard equipment includes the converters for analysis of following flue gas compo-nents: oxygen (O2), carbon monoxide (CO), nitric oxide (NO), nitrogen dioxide (NO2), sulphur dioxide (SO2) and hydrogen chloride (HCl). Technical data of the analyzer are shown in Table 4.
The resulting concentrations of flue gas in ppm from the analyzer Madur GA-60 are converted into normal conditions and into mg/m3 and the
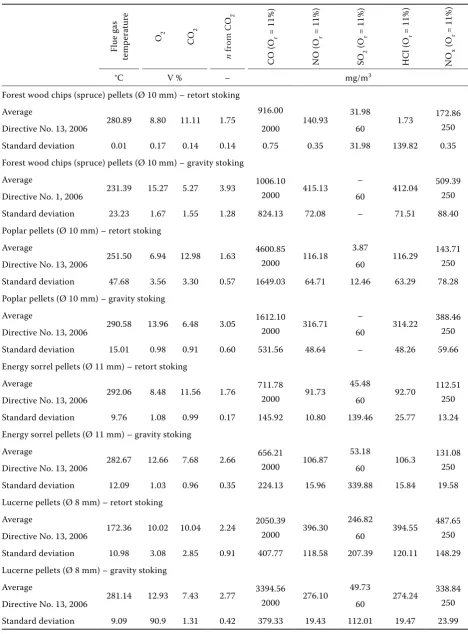
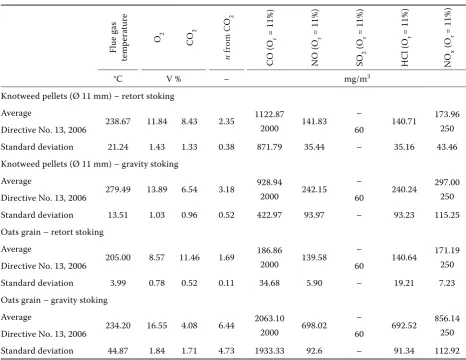
reference volume of oxygen in the flue gas that is Or = 11% for the used equipment according to the specified decree and directive. The average result-ing concentrations are shown in Table 5 and are compared with the emission limits according to the Directive No. 13, 2006 (this directive applies to appliances with the definition of the hot water boilers for combustion of biomass with manual or automatic supply of nominal output up to 300 kW according to ČSN 07 0240, 1993 and ČSN EN 303-5, 2000). These resulting average values are
determined in the whole range of measurement of individual samples.
For the actual measurements two types of repre-sentative combustion equipments were selected:
the retort stoking (lower stoking) – the pellets are •
pushed by the screw feeder through the retort (knee) into the combustion chamber (Fig. 1), the gravity stoking – the pellets are pushed by •
the screw feeder from the reservoir above the grate on which they then fall down (Fig. 2). This is automatic hot water combustion equip-ment with the heat output of 25 kW for solid fuels in the form of pellets intended primarily for heat-ing family houses, cottages, office buildheat-ings, small business premises, etc.
Twelve measurements were carried out on the se-lected combustion equipments.
the resulting values
[image:5.595.73.529.101.342.2]The resulting values from the chemical analysis of the original samples taken from woody biomass and herbaceous biomass from agriculture are given in Table 2. The values selected from the stoichiometric analysis carried out with the original samples of fuel under normal conditions and at the reference oxygen content in flue gas Or = 11% are shown in Table 3. In Table 5 the average concentrations from the ther-mal-emission measurements of analyzed samples
Table 4. Technical data of Madur GA-60 analyser (Madur Electronics, Vienna, Austria)
Value/Measurement Principle Range Resolution Sensor accuracy
Ambient temperature/sensor Pt 500 0–100°C 1°C ± 2%
Flue gas temperature 0–1,300°C 1°C ± 5%
Sensor NiCr/Ni (or PtRh/Pt) 0–1,600°C 1°C ± 2%
Electrochemical converter/oxygen (O2) 0–20.95% 0.01% ± 2%
Electrochemical converter/carbon monoxide (CO) 0–20,000 ppm 1 ppm ± 5%
Electrochemical converter/nitrogen oxide (NO) 0–5,000 ppm 1 ppm ± 5%
Electrochemical converter/nitrogen dioxide (NO2) 0–800 ppm 1 ppm ± 5%
Electrochemical converter/sulphur dioxide (SO2) 0–2,000 ppm 1 ppm ± 5%
Pressure ± 50 hPa 0.01 hPa
Soot number according to Bacharach 0–9 1
Oxides of nitrogen (NOx) as NO2/calculation of NO + NO2 0–6,000 ppm 1 ppm
Carbon dioxide (CO2)/calculation by fuel from CO2max and O2 0–25% 0.1%
Table 5. The average concentrations of the thermal-emission measurement
Fl
ue
g
as
tem
pera
tur
e
O 2 CO2
n
fr
om C
O2
C
O (O
r
= 11%)
N
O (O
r
= 11%)
SO
2
(O
r
= 11%)
H
C
l (O
r
= 11%)
NO
x
(O
r
= 11%)
°C V % – mg/m3
Forest wood chips (spruce) pellets (Ø 10 mm) – retort stoking Average
280.89 8.80 11.11 1.75 916.00 140.93 31.98 1.73 172.86
Directive No. 13, 2006 2000 60 250
Standard deviation 0.01 0.17 0.14 0.14 0.75 0.35 31.98 139.82 0.35
Forest wood chips (spruce) pellets (Ø 10 mm) – gravity stoking Average
231.39 15.27 5.27 3.93 1006.10 415.13 – 412.04 509.39
Directive No. 1, 2006 2000 60 250
Standard deviation 23.23 1.67 1.55 1.28 824.13 72.08 – 71.51 88.40
Poplar pellets (Ø 10 mm) – retort stoking Average
251.50 6.94 12.98 1.63 4600.85 116.18 3.87 116.29 143.71
Directive No. 13, 2006 2000 60 250
Standard deviation 47.68 3.56 3.30 0.57 1649.03 64.71 12.46 63.29 78.28
Poplar pellets (Ø 10 mm) – gravity stoking Average
290.58 13.96 6.48 3.05 1612.10 316.71 – 314.22 388.46
Directive No. 13, 2006 2000 60 250
Standard deviation 15.01 0.98 0.91 0.60 531.56 48.64 – 48.26 59.66
Energy sorrel pellets (Ø 11 mm) – retort stoking Average
292.06 8.48 11.56 1.76 711.78 91.73 45.48 92.70 112.51
Directive No. 13, 2006 2000 60 250
Standard deviation 9.76 1.08 0.99 0.17 145.92 10.80 139.46 25.77 13.24
Energy sorrel pellets (Ø 11 mm) – gravity stoking Average
282.67 12.66 7.68 2.66 656.21 106.87 53.18 106.3 131.08
Directive No. 13, 2006 2000 60 250
Standard deviation 12.09 1.03 0.96 0.35 224.13 15.96 339.88 15.84 19.58
Lucerne pellets (Ø 8 mm) – retort stoking Average
172.36 10.02 10.04 2.24 2050.39 396.30 246.82 394.55 487.65
Directive No. 13, 2006 2000 60 250
Standard deviation 10.98 3.08 2.85 0.91 407.77 118.58 207.39 120.11 148.29
Lucerne pellets (Ø 8 mm) – gravity stoking Average
281.14 12.93 7.43 2.77 3394.56 276.10 49.73 274.24 338.84
Directive No. 13, 2006 2000 60 250
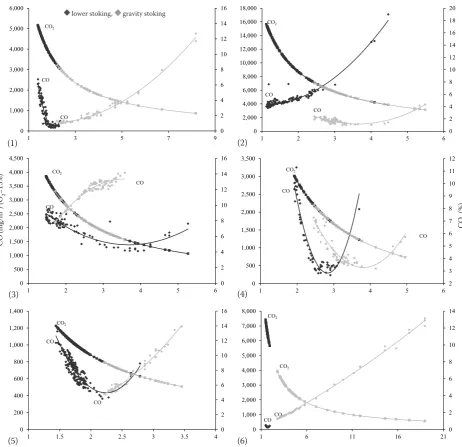
are shown that were carried out on two different types of combustion equipment with heat output of 25 kW. The graphic evaluation of carbon monoxide and carbon dioxide in dependence on the excess air coefficient for each sample is shown in Fig. 3.
resuLts
In the selected samples of fuels in terms of emis-sion concentration the quantities of sulphur, ni-trogen and chlorine are the most decisive. At the samples there is an apparent increase in nitrogen emissions since the energy plants have higher val-ues of nitrogen in the fuel (Table 3) compared to the fossil fuels. Especially by an increased content of this element the use of these fuels is restricted.
The selected samples were analysed for the quan-tity of chlorine in the original fuel. The chlorine concentration in the wood mass is at very low level compared to the vegetal biomass. Namely at the
lucerne pellets the concentrations reached above 0.2% share in the fuel. It is clear that the herbaceous biomass from agriculture cannot be assessed ac-cording to chlorine content in the wood mass.
Sulphur during the combustion largely goes over into the gas phase as SO2 and SO3. The sul-phur emissions at heat installations for the use of the solid fuels from renewable resources in terms of limit values usually do not constitute any prob-lem, which is confirmed by the selected samples (Table 3). The corrosive behaviour can constitute the decisive factor of sulphur concentration in the fuel. Other values of the elemental analysis meet the optimal parameters for the use of biofuels in the combustion equipment (Hedberg et al. 2002; Malaťák, Vaculík 2008).
The contents of water and ashes are the most de-termining for the thermic use of fuels. The range of all water content in the samples is quite low, which has a positive contribution to the net fuels calorific value. The content of ashes in the samples except
Fl
ue
g
as
tem
pera
tur
e
O 2 CO2
n
fr
om C
O2
C
O (O
r
= 11%)
N
O (O
r
= 11%)
SO
2
(O
r
= 11%)
H
C
l (O
r
= 11%)
NO
x
(O
r
= 11%)
°C V % – mg/m3
Knotweed pellets (Ø 11 mm) – retort stoking Average
238.67 11.84 8.43 2.35 1122.87 141.83 – 140.71 173.96
Directive No. 13, 2006 2000 60 250
Standard deviation 21.24 1.43 1.33 0.38 871.79 35.44 – 35.16 43.46
Knotweed pellets (Ø 11 mm) – gravity stoking Average
279.49 13.89 6.54 3.18 928.94 242.15 – 240.24 297.00
Directive No. 13, 2006 2000 60 250
Standard deviation 13.51 1.03 0.96 0.52 422.97 93.97 – 93.23 115.25
Oats grain – retort stoking Average
205.00 8.57 11.46 1.69 186.86 139.58 – 140.64 171.19
Directive No. 13, 2006 2000 60 250
Standard deviation 3.99 0.78 0.52 0.11 34.68 5.90 – 19.21 7.23
Oats grain – gravity stoking Average
234.20 16.55 4.08 6.44 2063.10 698.02 – 692.52 856.14
Directive No. 13, 2006 2000 60 250
[image:7.595.63.530.97.457.2]Standard deviation 44.87 1.84 1.71 4.73 1933.33 92.6 – 91.34 112.92
Fig. 2. Diagram of the combustion equipment – gravity stoking
[image:8.595.94.514.411.710.2]1 – ashes pan, 2 – burner chamber, 3 – grate bar, 4 – fuel fallout, 5 – fuel diffuser, 6 – vortex-generators, 7 – hopper, 8 – fire extinguish-ing equipment, 9 – transmission with an electric motor, 10 – screw conveyor, 11 – grate bar drive, 12 – ashes trough
Fig. 1. Diagram of the combustion equipment with lower stoking
the lucerne pellets was also low, which can be seen in elemental analyses of selected samples. By the content of water and ashes the thermal properties of the examined samples are significantly influenced and subsequently both the selection and configura-tion of the combusconfigura-tion equipment are influenced.
The herbaceous biomass from agriculture con-tains more ashes compared to the wood mass as it is clear from the results (Table 3), which can cause an increased emphasis on the removal of solid residues after combustion and increase in the the quantity of solid emissions.
The values resulting from the stoichiometric analysis show very good thermal-emission param-eters of examined samples. As it results from the stoichiometry of examined fuels the selection and design of the combustion equipment are influ-enced by the calorific value, water content and en-ergy density. The concentrations of nitrogen, sul-phur and chlorine in the samples are relatively very broad, which is confirmed by the analyses of sam-ples. The values resulting from the stoichiometric analysis serve for further necessary calculations of thermal efficiency and heat losses of the combus-Fig. 3. The measured emission concentrations of CO and CO2 depending on the coefficient of excess air and combustion equipment
(1) Forest wood chips (spruce) pellets(Ø 10 mm), (2) Poplar pellets (Ø 10 mm), (3) Lucerne pellets (Ø 8 mm), (4) Knotweed pellets (Ø 11 mm), (5) Energy sorrel pellets (Ø 11 mm); (6) Oats grain
0 2 4 6 8 10 12 14 16 0 1,000 2,000 3,000 4,000 5,000 6,000
1 3 5 7 9
CO2 CO CO 1) 0 2 4 6 8 10 12 14 16 18 20 0 2,000 4,000 6,000 8,000 10,000 12,000 14,000 16,000 18,000
1 2 3 4 5 6
CO2 CO CO 2) 0 2 4 6 8 10 12 14 16 0 500 1,000 1,500 2,000 2,500 3,000 3,500 4,000 4,500
1 2 3 4 5 6
CO2 CO CO 3) 2 3 4 5 6 7 8 9 10 11 12 0 500 1,000 1,500 2,000 2,500 3,000 3,500
1 2 3 4 5 6
CO2 CO CO 4) 0 2 4 6 8 10 12 14 16 0 200 400 600 800 1,000 1,200 1,400
1 1.5 2 2.5 3 3.5 4
CO2 CO 5) CO 0 2 4 6 8 10 12 14 0 1,000 2,000 3,000 4,000 5,000 6,000 7,000 8,000
1 6 11 16 21
CO2 CO CO2 CO 6) CO (mg/m
3) (O
2 =13%) (1) (3) (5) (2) (4) (6) CO 2 (%)
[image:9.595.67.530.84.531.2]tion equipments, but mainly they serve for control and optimization of the combustion equipment.
An important task consists in the assessment of the determined theoretical graphical dependence of car-bon dioxide on the volume of oxygen in the flue gas with the formulation of the coefficient of excess air on the original fuel under normal conditions. In the graphic representation of carbon dioxide dependence on the oxygen content in the flue gas with the formu-lation of the coefficient of excess air on the original sample under normal conditions there are inserted the
[image:10.595.66.531.83.531.2]actual measured values of the combustion equipment. The resulting graphical representation is shown in Fig. 4. The theoretically determined values of carbon dioxide in the graphs are plotted dark blue and real measured values are plotted green for the combus-tion equipment with lower stoking and light blue for combustion devices with gravity stoking. The statisti-cal analysis is used for further evaluation of resulting differences between the theoretical and actual values. Despite the slight deviation between the theo-retical and measured values these theotheo-retical dia-Fig. 4. Theoretical and actual , graphical dependencies of carbon dioxide on the oxygen volume in the flue gas with the formulation of the coefficient of excess air
(1) Forest wood chips spruce pellets (Ø 10 mm), (2) Poplar pellets (Ø 10 mm); (3) Lucerne pellets (Ø 8 mm), (4) Knotweed pellets (Ø 11 mm); (5) Energy sorrel pellets (Ø 11 mm), (6) Oats grain
0 1 2 3 4 5 6 7 8 9 10 11 12 13 14 15 16 17 18 19 20 21
0 1 2 3 4 5 6 7 8 9 10 11 12 13 14 15 16 17 18 19 20 21
y = CO 2 (V -%)
x = O2 (V-%) n ( - )
1) 1 1,1 1,2 1,3 1,4 1,5 1,6 1,7 1,8 2 2,5 3 4 5 6 0 5 10 15 20 25 0 1 2 3 4 5 6 7 8 9 10 11 12 13 14 15 16 17 18 19 20 21 1 1,1 1,2 1,3 1,4 1,5 1,6 1,7 1,8 2 2,5 3 4 5 6
n ( - ) 0 5 10 15 20 25 0 1 2 3 4 5 6 7 8 9 10 11 12 13 14 15 16 17 18 19 20 21 n ( - ) 1 1,1 1,2 1,3 1,4 1,5 1,6 1,7 1,8 2 2,5 3 4 5 6 0 5 10 15 20 25 0 1 2 3 4 5 6 7 8 9 10 11 12 13 14 15 16 17 18 19 20 21 n ( - ) 1 1,1 1,2 1,3 1,4 1,5 1,6 1,7 1,8 2 2,5 3 4 5 6 0 5 10 15 20 25 0 1 2 3 4 5 6 7 8 9 10 11 12 13 14 15 16 17 18 19 20 21 n ( - ) 1 1,1 1,2 1,3 1,4 1,5 1,6 1,7 1,8 2 2,5 3 4 5 6 0 5 10 15 20 25 0 1 2 3 4 5 6 7 8 9 10 11 12 13 14 15 16 17 18 19 20 21 n ( - ) 1 1,1 1,2 1,3 1,4 1,5 1,6 1,7 1,8 2 2,5 3 4 5 6 0 5 10 15 20 25 0 1 2 3 4 5 6 7 8 9 10 11 12 13 14 15 16 17 18 19 20 21 n ( - ) 1 1,1 1,2 1,3 1,4 1,5 1,6 1,7 1,8 2 2,5 3 4 5 6 y = C O2 (V %)
x = O2 (V %) x = O2 (V %)
(3)
(5) (6)
(4) (2) lower stoking, gravity stoking
grams can be used for combustion equipments to optimize the setting of combustion fan and exhaust fans. The graphic dependencies expressed in this way can serve for a quick setting of combustion air volume into the combustion chamber. In practice, this results in the optimization of combustion proc-esses especially in the optimal setting of combus-tion air volume; it may thus also increase thermal efficiencies and reduce heat losses and emissions of the combustion equipment and reduce heat losses and emissions of the combustion equipment.
The resulting average emission concentrations of carbon monoxide on combustion equipment with lower stoking according to the Directive No. 13 (2006) achieve several times higher emission con-centrations at the poplar pellets. These emissions are slightly exceeded in case of lucerne pellets. At the combustion equipment with the gravity stok-ing the emissions at the fuel samples taken from lucerne are exceeded twice and they are slightly ex-ceeded at the oats. In case of other measurements the average emission concentrations of examined samples are optimal. The resulting average emis-sion concentrations of carbon monoxide of indi-vidual samples of fuels at the combustion equip-ments are given in Table 5.
The average emission concentrations of nitrogen oxides exceeding the limits defined by the Directive No. 13 (2006) were determined in case of lucerne pellets and slightly in case of pellets of knotweed at the combustion equipment with lower stoking. Almost at all samples of fuels except the pellets of energy sorrel there are exceeded the emission con-centrations of nitrogen oxides in case of combustion equipment with gravity stoking. The fact that the lu-cerne pellets compared to other examined samples contain the maximum nitrogen in the fuel itself and that the combustion process runs with a large vol-ume of combustion air brought into the combustion chamber and the high temperature of flue gas might be the reasons of increased emissions of nitrogen oxides. The resulting average emission concentra-tions of nitrogen oxides of individual fuel samples at the combustion equipments are given in Table 5.
At the combustion equipments with the lower fuel supply and in case of lucerne pellets, multiple emissions of sulphur dioxide are measured against the emissions according to the Directive No. 13 (2006). Using this fuel for example in combustion condensing equipment with a higher concentration of sulphur in the fuel would be problematic. Other determined average flue gas emission
concentra-tions at all combustion equipments during meas-urements are optimal and do not exceed the values according to the Directive No. 13 (2006). The av-erage resulting emission concentrations of sulphur dioxide of individual fuel samples at the combus-tion equipments are shown in Table 5.
The coefficient of excess air is an important pa-rameter influencing the combustion efficiency. The combustion equipment with lower fuel supply has an optimal average coefficient of excess air in con-trast to the combustion equipment with gravity stoking that at all examined samples of fuels has a high value of the coefficient of excess air. The re-sulting average values of the coefficient of excess air of individual fuel samples at the combustion equip-ments are given in Table 5.
On combustion equipments the dependencies of carbon dioxide are defined – the product of perfect combustion – on the coefficient of excess air and these dependencies are similar in all cases. With in-creasing volume of air the concentration of carbon di-oxide decreases from the maximum to the minimum concentration, which leads to cooling the flame and dilution of flue gas with the combustion air (Fig. 3).
Carbon monoxide (Fig. 3), the product of incom-plete combustion, at every examined sample of fuel and the combustion equipment in the dependence on the coefficient of excess air at first in the area with a very low coefficient of excess air is decreas-ing down to the optimal values, but after the opti-mal values of the coefficient of excess air have been exceeded there occurs gradual increase of carbon monoxide up to the maximum concentration. This process can be observed at all fuels except for pop-lar pellets at the combustion equipment with lower fuel supply and lucerne pellets and oats at the com-bustion equipment with gravity stoking when at these measurements from the beginning the car-bon monoxide is gradually increasing. The reason why a different process of combustion occurs at the fuel samples can be attributed to multiple factors such as the calorific value, the proportion of vola-tile matter in the sample and the volume of com-bustion air brought into the comcom-bustion chamber. Also in the combustion equipment an insufficient mixing of volatile flammable substances can occur with the combustion air, and thus an insufficient fire penetration on the refractory retorts.
chemical behaviour. These groups are polychlorin-ated dibenzo-p-dioxins (PCDD) and polychlorinat-ed dibenzofurans (PCDF); the first group includes about seventy and the other about one hundred and thirty individual substances. Dioxins belong to the most toxic substances on the Earth and even at concentrations of one to a billion they are life-threatening (they are seventy times more toxic than potassium cyanide). Moreover they are the sub-stances with carcinogenic and teratogenic affects (capable to harm unborn fetus) (Nordin 1994).
The analytical determination of dioxins is a com-plex and expensive matter (in this country it only is carried out by a limited number of laboratories) and it only can be implemented by means of gas chro-matography combined with the mass spectrometry. The measurements are difficult particularly for low concentrations of dioxins (specifically for determi-nation of so called immission values), therefore in this article there only are assessed the emission con-centrations of hydrogen chloride that have a direct influence on the formation of dioxins.
At the combustion equipment with lower fuel supply and in case of lucerne pellets several times higher hy-drogen chloride emissions were measured compared to other average measured emissions. At the combus-tion equipment with gravity stoking the hydrogen chloride emissions concentrations are increased at all examined fuels except the energy sorrel pellets. The resulting average hydrogen chloride emission con-centrations of individual samples of fuels at the com-bustion equipments are given in Table 5.
The cause of increased production of hydrogen chloride emissions at individual combustion equip-ments can be attributed especially to the volume of combustion air and the quantity of chlorine in the fuel itself. The greater is the volume of brought com-bustion air (excess air coefficient, Table 5), the greater is the generation the hydrogen chloride emissions.
On the basis of analyses we can also draw a con-clusion that during the combustion the boiler spaces should be maximally burdened with the vegetal bio-mass. But it is common that within the phytomass of herbs the city and municipal heating plants are heat-ed with straw most frequently without taking into account that this heating might be inappropriate.
disCussion And ConCLusion
The results of elemental and stoichiometric analy-ses carried out show higher values of nitrogen,
sul-phur and chlorine concentrations in herbaceous biomass from agriculture compared to the analyzed wood mass. The selection of combustion equipment is particularly influenced by an increased content of sulphur and chlorine (corrosive behaviour). The net calorific value of analyzed samples taken from the wood mass is higher than the net calorific value of the samples taken from the vegetal biomass. The net calorific value of fuel from the herbaceous biomass from agriculture is reduced due to a higher content of ashes in the fuel. Due to a higher content of ashes in the fuel the requirements for removal of solid rem-nants after combustion are increased and the quan-tity of solid emissions is also increased.
The coefficient of excess air and water contained in the fuel constitutes the primary factors that signifi-cantly influence the work of the combustion equip-ment. The excess air is required in order to guarantee a perfect combustion. On the other hand it is neces-sary to take into account the harm caused by a too large air excess. The more air participates in the com-bustion, the more heat is taken away by the flue gas and consequently the combustion temperature and the efficiency of combustion equipment will decrease plus the heat losses will increase. Therefore it is nec-essary to use the optimum excess air.
The results of thermal-emission analyses show higher concentrations of nitrogen oxides, sulphur and hydrogen chloride in herbaceous biomass from agriculture compared to the analyzed wood mass. The net calorific value of analyzed samples taken from the wood mass is higher than that of samples taken from vegetal biomass. Regarding the individ-ual emission concentrations of carbon monoxide in case of wood fuels and herbaceous biomass from agriculture these concentrations also depend on the type of combustion equipment.
The cause of an increased hydrogen chloride emis-sions generated at individual combustion equip-ments primarily lies in the volume of combustion air and the chlorine content in the fuel itself. The higher volume of combustion air is brought into the combustion chamber, the higher the generation of hydrogen chloride emissions is. Based on the analyses we also can draw a conclusion that dur-ing combustion the spaces of boiler should be most burdened with the vegetal biomass.
during the washing an artificial fertilizer rich in chlorine is released (Van der Lans et al. 2000).
Based on the undertaken research of fuels from biomass they contain the trace amounts of sulphur and it is their advantage because no harmful SO2 air pollutant is generated during combustion. As a result the temperature of dew point of flue gas is reduced because its value is only a function of excess air and of water steam content in the flue gas. This means that for example when burning the wood mass the dew point temperature is significantly lower than during the coal combustion. By the appropriate so-lution of additional boiler heating surfaces the loss of chimney can be reduced to a minimum without any risk of development of low-temperature corrosion of the additional surfaces (Nordin 1994; Malaťák et al. 2007b; Malaťák, Vaculík 2008).
Therefrom result the requirements for the qual-ity of fuels from biomass. A high qualqual-ity of pellets from biomass is mainly required for combustion in small combustion equipments. For larger combus-tion equipments that are equipped with gas clean-ing and controlled combustion process, the fuel quality is not critical. It is therefore important to distinguish two types of pellet fuels; it means those for industrial and for small domestic combustion equipments (Obernbergera, Theka 2004).
The use of already available sensors for monitor-ing the carbon oxide is another way to reduce emis-sions. The use of sensors for unburnt hydrocarbons especially for carbon monoxide in combination with a lambda probe can provide the combustion equipment with an optimal performance with re-spect to emissions and the efficiency of combustion equipment regardless the changes in fuel quality and heat outputs.
references
ČSN 12 4070, 1990. Zařízení odlučovací. Metody měření veličin (Dust collecting equipment. Measuring methods of quantity features). Prague, Czech Office for Standards, Metrology and Testing.
ČSN 38 5509, 1991. Plynná paliva. Fyzikální konstanty (Gas-eous fuels. Physical constants). Prague, Czech Office for Standards, Metrology and Testing.
ČSN 07 0240, 1993. Teplovodní a nízkotlaké parní kotle. Základní ustanovení (Warm water and low-pressure steam boilers. Basic regulations). Prague, Czech Office for Stand-ards, Metrology and Testing.
ČSN EN 303-5, 2000. Kotle pro ústřední vytápění – Část 5: Kotle pro ústřední vytápění na pevná paliva, s ruční nebo
samočinnou dodávkou, o jmenovitém tepelném výkonu nejvýše 300 kW – Terminologie, požadavky, zkoušení a značení (Heating boilers – Part 5: Heating boilers for solid fuels, hand and automatically stocked, nominal heat output of up to 300 kW – Terminology, requirements, testing and marking). Prague, Czech Office for Standards, Metrology and Testing.
ČSN 44 1310, 2001. Tuhá paliva – Označování analytických ukazatelů a vzorce přepočtů výsledků na různé stavy paliva (Solid fuels – Symbols of analytical parameters and formu-lae for converting the results of analyses of different states of fuels). Prague, Czech Office for Standards, Metrology and Testing.
ČSN CEN/TS 15 104, 2006. Tuhá biopaliva – Stanovení celko-vého obsahu uhlíku, vodíku a dusíku – Instrumentální meto-dy (Solid biofuels – Determination of total content of carbon, hydrogen and nitrogen – Instrumental methods). Prague, Czech Office for Standards, Metrology and Testing. ČSN P CEN/TS 15 289, 2006. Tuhá biopaliva – Stanovení
celkového obsahu síry a chloru (Solid Biofuels – Determi-– Determi-
Determi-nation of total content of sulphur and chlorine). Prague, Czech Office for Standards, Metrology and Testing. ČSN P CEN/TS 15 234, 2007. Tuhá biopaliva – Prokazování
kvality paliva (Solid biofuels – Fuel quality assurance). Prague, Czech Office for Standards, Metrology and Testing. ČSN EN 14 774-3, 2010. Tuhá biopaliva – Stanovení obsahu
vody – Metoda sušení v sušárně – Část 3: Voda v analyt-ickém vzorku pro obecný rozbor (Solid biofuels – Deter-mination of moisture content – Oven dry method – Part 3: Moisture in general analysis sample). Prague, Czech Office for Standards, Metrology and Testing.
ČSN EN 14 775, 2010. Tuhá biopaliva – Stanovení obsahu popela (Solid biofuels – Determination of ash content). Prague, Czech Office for Standards, Metrology and Testing.
ČSN EN 14 918, 2010. Stanovení spalného tepla a výhřevnosti (Solid biofuels – Determination of calorific value). Prague, Czech Office for Standards, Metrology and Testing. ČSN EN 15 148, 2010. Tuhá biopaliva – Stanovení obsahu
prchavé hořlaviny (Solid biofuels – Determination of the
content of volatile matter). Prague, Czech Offi ce for Stand-Prague, Czech Office for
Stand-ards, Metrology and Testing.
Directive No. 13, 2006. Směrnice MŽP ČR s požadavky pro propůjčení ochranné známky – Teplovodní kotle pro ústřední vytápění na spalování biomasy (Directive from Ministry of Environment of the CR to the requirements for awarding marks – Hot water boilers for central heating systems for biomass). Prague, MŽP.
Fiedler F., Persson T., 2009. Carbon monoxide emissions of combined pellet and solar heating systems. Applied Energy, 86: 135–143.
U., Westerholm R., 2002. Chemical and physical charac-terization of emissions from birch wood combustion in a wood stove. Atmospheric Environment, 36: 4823–4837. Jevič P., Hutla P., Malaťák J., Šedivá Z., 2007. Efficiency
and gases emissions with incineration of composite and one-component biofuel briquettes in room heater. Re-search in Agricultural Engineering, 53: 94–102.
Khor A., Ryu C., Yang Y.B., Sharifi V.N., Swithenbank J., 2007. Straw combustion in a fixed bed combustor. Fuel – The Science and Technology of Fuel and Energy, 86: 152–160.
Malaťák J., Vaculík P., 2008. Biomass for production en-ergy. Prague, Powerprint Press: 206.
Malaťák J., Gurdil G.A., Jevič P., Pinar Y., Selvi K.C., 2007a. Heat-emission characteristics of some energy
plants. The Journal of Agricultural Faculty of Ondokuz Mayis University, 22: 202–206.
Malaťák J., Karanský J., Altman V., Jevič P., Gálik R., 2007b. Alternative fuels – agricultural waste material utilization. Polnohospodárstvo (Agriculture – Journal for Agricultural Sciences), 53: 38–48.
Nordin A., 1994. Chemical elemental characteristics of biomass fuels. Biomass Bioenergy, 6: 339–347.
Obernbergera I., Theka G., 2004. Physical characterisation and chemical composition of densified biomass fuels with
regard to their combustion behaviour. Biomass and Bi-Biomass and
Bi-oenergy, 27: 653–669.
Van der Lans R.P., Pedersen L.T., Jensen A., Glarborg P., Dam-Johansen K., 2000. Modelling and experiments of straw combustion in a grate furnace. Biomass and Bioenergy, 19: 199–208.
Received for publication June 22, 2010 Accepted after corrections April 7, 2011
Corresponding author:
doc. Ing. Jan Malaťák, Ph.D., Czech University of Life Sciences Prague, Faculty of Engineering,