Supported by the Ministry of Agriculture of the Czech Republic (Projects No. QJ1310002 and No. MZE RO0714).
The effect of non-phytate phosphorus and phytase levels
on performance, egg and tibia quality, and pH of the
digestive tract in hens fed higher-calcium-content diets
M. Englmaierová, V. Skřivanová, M. Skřivan
Institute of Animal Science, Prague-Uhříněves, Czech Republic
ABSTRACT: THe effect of three levels of non-phytate phosphorus (NPP) (3.0, 2.1, and 1.7 g/kg) and two levels of 3-phytase (F) (0 and 150 phytase units (FTU)/kg) together with a high dietary calcium concentration (approximately 41.0 g/kg) on the performance characteristics, egg quality, pH of the digestive tract, and tibia bone quality of ISA Brown hens housed in enriched cages was evaluated. THe diets with 3.0 g/kg of NPP with and without F and 2.1 g/kg of NPP with 150 FTU of F significantly increased egg production (P = 0.022) and daily egg mass production (P = 0.030). A low level of NPP decreased (P < 0.001) the body weight of hens at the end of the experiment. THe highest values of albumen height (P < 0.001), albumen index (P = 0.004), Haugh units (P = 0.001), and albumen percentage (P = 0.004) were associated with the diet with the low level of dietary NPP without F addition. THe low level of NPP with 3-phytase increased the calcium and phosphorus contents in eggshells (P = 0.002 and P = 0.050). THe lowest values of dry matter (P < 0.001) and ash content in tibia bone (P = 0.040) were measured for the hens fed the diet with 3.0 g/kg of NPP and 3-phytase supplementation. In addition, the low level of phosphorus without F addition increased (P = 0.031) the pH value in the small intestine to 6.21. In conclusion, 2.1 g of NPP with 150 FTU was found to be sufficient in the diet of hens in the middle of the laying cycle housed in enriched cages. But with respect to egg quality, higher calcium content decreased positive effect of F addition in diets with different levels of phosphorus.
Keywords: mineral nutrition; laying hen; egg production; egg quality; tibia; pH
Calcium (Ca) and phosphorus (P) are essential nutrients for various biochemical pathways and skeletal integrity in poultry. Reducing the dietary levels of Ca and P significantly decreased the bone quality (Swiatkiewicz and Arczewska-Wlosek, 2012). The physiological roles of these two macro minerals are intricately linked (Selle et al., 2009). There is a significant interaction between dietary Ca and P, and an improper ratio of Ca to P could depress growth performance in broilers (Hulan et al., 1985; Rao et al., 2003, 2006). This issue is more difficult to address in hens than in chickens because of hens’ high calcium needs. An excess of Ca in hens’ diets can cause antagonism of the absorption of minerals (P, magnesium, manga-nese, zinc), influencing the maintenance of the homeostasis of these minerals and, through the
of nonphytate P (NPP) without supplemental F resulted in high egg production, egg mass, and feed efficiency in layers. In the presence of 150, 300, and 400 phytase units (FTU)/kg of feed, the dietary NPP level may be decreased, and opti-mal levels were calculated as being 1.8, 1.5, and 1.4 g/kg, respectively. In addition, Al-Massad et al. (2011) found that 1.2 g/kg NPP appears to be sufficient for maintaining production performance and eggshell quality in hens fed a corn-soybean meal diet containing 34 g/kg Ca and supplemented with F. On the other hand, Castillo et al. (2004) showed that the biological optimum levels of Ca for maximum egg production and specific grav-ity were 43.4 and 46.0 g/kg, respectively, and the economic optimum level for maximizing profits was 43.8 g/kg in diets containing 4.0 g/kg AP.
High calcium or phosphorus levels in the intes-tine reduce the absorption of both. Decreasing in solubility of minerals complexes as a result of increased ileal pH by the relatively high concentra-tion of calcium was menconcentra-tioned by Shafey (1993). Sheikhlar et al. (2009) showed that wide Ca : P ratio increased (P < 0.05) the retention of P. In addition, Ca and P of tibia linearly decreased as dietary NPP levels were reduced (Lim et al., 2001).
F addition has been found to overcome the ad-verse effects associated with low intake of inorganic P by animals and significantly reduce the effect of low levels of Ca in the diet on the performance of hens (Gordon and Roland, 1998). Moreover, F im-proves the bioavailability of Ca and imF im-proves egg-shell quality at marginal levels of Ca (e.g. 34 g/kg) (Sohail and Roland, 2000), increases the digest-ibility of phytate P by approximately 20–45%, and increases retention by approximately 15% (Keshavarz, 2000). The question is what are the effects of F at higher levels of dietary Ca.
This study on laying hens was therefore per-formed to determine the effects of higher calcium contents in a diet of wheat and maize with a graded concentration of NPP, with or without microbial F addition, in terms of their performance charac-teristics, egg quality, pH values of digestive tract segments, and tibia bone quality.
MATERIAL AND METHODS
Hens, husbandry, and diets. Two hundred and forty 37-week-old ISA Brown hens were randomly assigned to 6 dietary treatments with 4 replicate cages at 10 hens per cage. The hens were housed
[image:2.595.305.531.284.556.2]in the same air-conditioned facility in three-floor enriched cages. The cages were equipped with a nest box, perch (150 cm), dust bath, and equip-ment for the abrasion of claws, conforming to the European Union Council Directive 1999/74/EC (1999). The cage provided 7560 cm2 of floor area without the nest, 120 cm of feeder, and 3 nip-ple water dispensers. The room temperature was maintained at 20–22°C. A 16-h photoperiod was applied, and the light intensity was approximately 10 lx in the central storey.
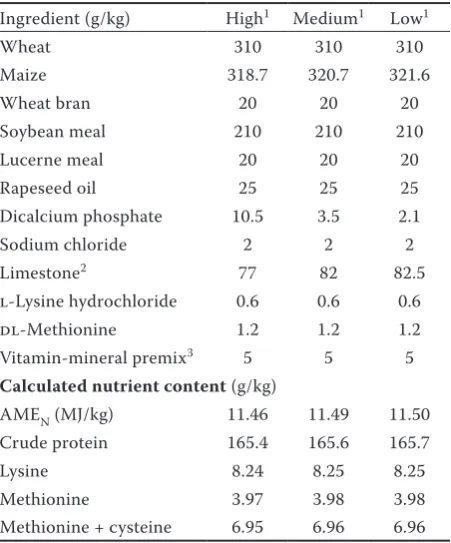
Table 1. Ingredients and chemical composition of the diets used
Ingredient (g/kg) High1 Medium1 Low1
Wheat 310 310 310
Maize 318.7 320.7 321.6
Wheat bran 20 20 20
Soybean meal 210 210 210 Lucerne meal 20 20 20 Rapeseed oil 25 25 25 Dicalcium phosphate 10.5 3.5 2.1 Sodium chloride 2 2 2 Limestone2 77 82 82.5
l-Lysine hydrochloride 0.6 0.6 0.6 dl-Methionine 1.2 1.2 1.2 Vitamin-mineral premix3 5 5 5 Calculated nutrient content (g/kg)
AMEN (MJ/kg) 11.46 11.49 11.50
Crude protein 165.4 165.6 165.7 Lysine 8.24 8.25 8.25 Methionine 3.97 3.98 3.98 Methionine + cysteine 6.95 6.96 6.96
AMEN = apparent metabolizable energy
1levels of non-phytate phosphorus (NPP) in the diet were 3.0,
2.1, and 1.7 g/kg; other experimental diets were supplemented with 150 FTU/kg of phytase
2experimental diets contained 35% fine-grained limestone
and 65% coarse-grained limestone
3vitamin-mineral premix provided per kg of diet:
retinylac-etate 3.0 mg, vitamin D3 3000 IU, vitamin E 30 mg, niacin
A completely randomized experimental de-sign with a 3 × 2 factorial arrangement of treat-ments was employed: 3 non-phytate phosphorus (NPP) levels (3.0, 2.1, and 1.7 g/kg) and 2 phytase (F) levels (0 and 150 phytase units (FTU)/kg). Natuphos® (BASF, Ludwigshafen, Germany), a preparation of 3-phytase (EC 3.1.3.8) produced by Aspergillus niger, was chosen as the source of the F. The ingredients and nutrient composition of the wheat- and maize-based diets are listed in Table 1. Calculations of the nutrient contents were made using standard values (National Research Council, 1994). All of the diets contained a high calcium level – approximately 41 g/kg (Table 2). Fine limestone (0.09–0.50 mm grains) and coarse limestone (1.00–2.00 mm grains) was supplied at a ratio of 35 : 65. Feed and fresh water were supplied ad libitum. The experiment lasted for 12 weeks.
The number of eggs and hens and their health status were monitored daily. The hen-day egg production and feed intake were calculated weekly on a per-cage basis. Egg weights were determined once per week. The hens were weighed at the beginning and at the end of the experiment, i.e. at the age of 37 and 49 weeks.
Sampling and analyses.The total P in the diets was assayed using a vanadate-molybdate reagent (AOAC, 2005; method 965.17). The Ca content in the diets was determined by atomic absorption spectrometry performed using a Solar M6 instru-ment (TJA Solutions, Cambridge, UK). The phytate P contents of the diets were determined by a capil-lary isotachophoretic method (Dušková et al., 2001). The phytase activity of the diets was determined as described by Eeckhout and De Paepe (1994).
To determine physical parameters, eggs were collected at weeks 40, 43, and 46 of hens’ age (Tůmová and Gous, 2012). All daily egg production was analyzed. A total of 606 eggs were analyzed in the experiment. The albumen, yolk, and shell
percentages were determined based on the indi-vidual weight of each egg and the weights of its components. The shell weight was measured after drying at 105°C. The albumen and yolk heights were measured using a digital micrometer head IP54 (Swiss Precision Instruments, Inc., Garden Grove, USA
)
. The Haugh units (HU) were calculated as indicated by Haugh (1937). The shell breaking strength and shell deformation were determined on the vertical axis using an Instron 3360 appara-tus (Instron, Norwood, USA). The shell thickness (values measured at the sharp and blunt ends and the equator, and the three obtained values were averaged) was measured using a micrometer after removing the shell membranes. The egg shell index (SI) was calculated as follows (Ahmed et al., 2005):SI = (SW/S) × 100, S = 4.68 × EW2/3 where:
SW = shell weight S = shell surface EW = egg weight
The albumen index was determined using the formula:
AI = {albumen height/[(long diameter of albumen + short diameter of albumen)/2]} × 100
The yolk index was calculated as YI = (yolk height/yolk diameter) × 100
The colour of the yolk was measured using the DSM Yolk Colour Fan (DSM Nutritional Products, Basel, Switzerland).
Analyses of the P and Ca contents of the eggshells were conducted twice during the experiment, at weeks 38 and 44 of hens’ age. A total of 576 eggs were analyzed (4 eggs per sample; 6 treatments; n = 24). Dry samples of the eggshells were ashed at 550°C. The P and Ca contents of the dried
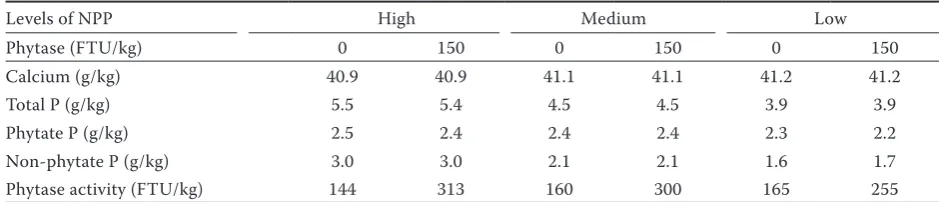
egg-Table 2. Analyzed calcium and phosphorus content and phytase activity of the diets used
Levels of NPP High Medium Low
Phytase (FTU/kg) 0 150 0 150 0 150
Calcium (g/kg) 40.9 40.9 41.1 41.1 41.2 41.2
Total P (g/kg) 5.5 5.4 4.5 4.5 3.9 3.9
Phytate P (g/kg) 2.5 2.4 2.4 2.4 2.3 2.2
Non-phytate P (g/kg) 3.0 3.0 2.1 2.1 1.6 1.7 Phytase activity (FTU/kg) 144 313 160 300 165 255
[image:3.595.61.535.636.737.2]shells were determined in a manner similar to that described previously for analysis of these elements in the hens’ diets.
At the end of the experiment, eight hens from each treatment were slaughtered using a CO2-based equipment for the euthanasia of poultry (Anieut G.d., Hena s.r.o., Miličín, Czech Republic). The digestive tract of each hen was removed, and the pH in segments such as the crop, gizzard, small intestine, and caecum was immediately measured using a pH meter 3520 (Jenway, Staffordshire, UK). The right tibia bones were excised from the carcasses, cleaned of all tissue, and frozen at –20°C until processing. The tibia breaking strengths were measured using an Instron 3342 apparatus (Instron) with a 50-kg load cell with a crosshead speed of 50 mm/min. Each tibia was supported on a 5.75-cm span. The broken tibias were later used for other measurements. The tibias underwent a 48-h defattening process under the action of fi-nally evaporating hexan. The bones were dried at 105°C for 24 h, placed in a desiccator, and weighed to determine their fat-free dry weight. Then, the bones were placed in a muffle furnace at 600°C for 24 h and cooled in a desiccator, and the ash weight was recorded.
Statistical analysis. The data from the ex-periment, with a 3 × 2 full factorial design, were analyzed using Two-Way Analysis of Variance (ANOVA) with the General Linear Models (GLM) procedure of SAS (Statistical Analysis System, Version 8.2, 2003). The main effects considered were the concentration of non-phytate
phospho-rus (NPP), phytase supplementation (F), and the interaction between these two factors (NPP × F). All of the differences were considered to be sig-nificant at P < 0.05. The results in the tables are presented as the mean and standard error of the mean (SEM).
RESULTS
As is evident from Table 2, all of the diets con-tained high levels of calcium (40.9–41.2 g/kg). The phytase activity of the diets ranged 144–165 FTU/kg for the non-supplemented diets and 255–313 FTU/kg for the diets supplemented with 150 FTU.
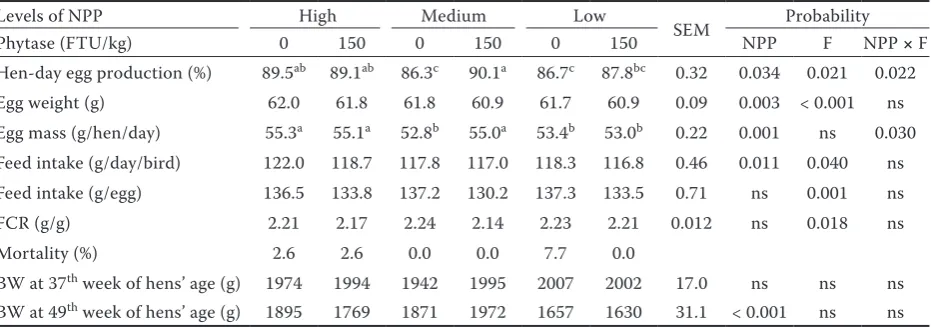
With regard to the performance characteristics (Table 3), the interaction between NPP and F was found to be significant for egg production (P = 0.022) and egg mass (P = 0.030). The highest values were obtained for hens fed the diet with the high level of NPP, with and without F, and the diet with the medium level of NPP with F. F ad-dition significantly decreased egg weight, feed intake, and the feed conversion ratio, compared with treatments without F. The high level of NPP increased egg weight and feed intake. The highest mortality was associated with the treatment with the low NPP level without 3-phytase addition. The body weights at the end of the experiment were considerably lower for hens fed diets with a level of NPP of approximately 1.7 g/kg.
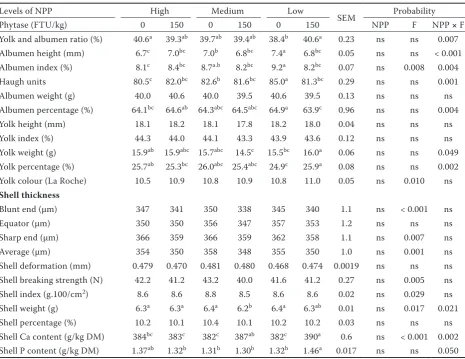
[image:4.595.66.532.547.711.2]Table 4 summarises the results of the analysis of physical egg quality parameters. NPP and F were found to have a significant combined effect on
Table 3. Performance characteristics of laying hens fed different levels of phosphorus and phytase
Levels of NPP High Medium Low
SEM Probability Phytase (FTU/kg) 0 150 0 150 0 150 NPP F NPP × F Hen-day egg production (%) 89.5ab 89.1ab 86.3c 90.1a 86.7c 87.8bc 0.32 0.034 0.021 0.022
Egg weight (g) 62.0 61.8 61.8 60.9 61.7 60.9 0.09 0.003 < 0.001 ns Egg mass (g/hen/day) 55.3a 55.1a 52.8b 55.0a 53.4b 53.0b 0.22 0.001 ns 0.030
Feed intake (g/day/bird) 122.0 118.7 117.8 117.0 118.3 116.8 0.46 0.011 0.040 ns Feed intake (g/egg) 136.5 133.8 137.2 130.2 137.3 133.5 0.71 ns 0.001 ns FCR (g/g) 2.21 2.17 2.24 2.14 2.23 2.21 0.012 ns 0.018 ns Mortality (%) 2.6 2.6 0.0 0.0 7.7 0.0
BW at 37th week of hens’ age (g) 1974 1994 1942 1995 2007 2002 17.0 ns ns ns
BW at 49th week of hens’ age (g) 1895 1769 1871 1972 1657 1630 31.1 < 0.001 ns ns
NPP = non-phytate phosphorus, F = phytase, FTU = phytase units, BW = body weight, FCR = feed conversion ratio, ns = non-significant
albumen quality characteristics such as albumen height (P < 0.001), albumen index (P = 0.004), Haugh units (P = 0.001), and albumen percentage (P = 0.004). The highest values were measured for eggs laid by the hens fed the diet with the low level of NPP without F addition. The percentage
[image:5.595.65.531.112.471.2]and weight of yolk (P = 0.002 and P = 0.049) and yolk and albumen ratio were the highest in the eggs laid by hens fed the diet with 1.7 g/kg of NPP with 3-phytase. Higher shell weights (P = 0.021) were measured for eggs laid by hens fed the diet with the high level of NPP and hens fed the diets Table 4. Effect of phosphorus and phytase levels on physical characteristics of eggs and calcium and phosphorus content in eggshells
Levels of NPP High Medium Low
SEM Probability Phytase (FTU/kg) 0 150 0 150 0 150 NPP F NPP × F Yolk and albumen ratio (%) 40.6a 39.3ab 39.7ab 39.4ab 38.4b 40.6a 0.23 ns ns 0.007
Albumen height (mm) 6.7c 7.0bc 7.0b 6.8bc 7.4a 6.8bc 0.05 ns ns < 0.001
Albumen index (%) 8.1c 8.4bc 8.7a.b 8.2bc 9.2a 8.2bc 0.07 ns 0.008 0.004
Haugh units 80.5c 82.0bc 82.6b 81.6bc 85.0a 81.3bc 0.29 ns ns 0.001
Albumen weight (g) 40.0 40.6 40.0 39.5 40.6 39.5 0.13 ns ns ns Albumen percentage (%) 64.1bc 64.6ab 64.3abc 64.5abc 64.9a 63.9c 0.96 ns ns 0.004
Yolk height (mm) 18.1 18.2 18.1 17.8 18.2 18.0 0.04 ns ns ns Yolk index (%) 44.3 44.0 44.1 43.3 43.9 43.6 0.12 ns ns ns Yolk weight (g) 15.9ab 15.9abc 15.7abc 14.5c 15.5bc 16.0a 0.06 ns ns 0.049
Yolk percentage (%) 25.7ab 25.3bc 26.0abc 25.4abc 24.9c 25.9a 0.08 ns ns 0.002
Yolk colour (La Roche) 10.5 10.9 10.8 10.9 10.8 11.0 0.05 ns 0.010 ns
Shell thickness
Blunt end (μm) 347 341 350 338 345 340 1.1 ns < 0.001 ns Equator (μm) 350 350 356 347 357 353 1.2 ns ns ns Sharp end (μm) 366 359 366 359 362 358 1.1 ns 0.007 ns Average (μm) 354 350 358 348 355 350 1.0 ns 0.001 ns Shell deformation (mm) 0.479 0.470 0.481 0.480 0.468 0.474 0.0019 ns ns ns Shell breaking strength (N) 42.2 41.2 43.2 40.0 41.6 41.2 0.27 ns 0.005 ns Shell index (g.100/cm2) 8.6 8.6 8.8 8.5 8.6 8.6 0.02 ns 0.029 ns
Shell weight (g) 6.3a 6.3a 6.4a 6.2b 6.4a 6.3ab 0.01 ns 0.017 0.021
Shell percentage (%) 10.2 10.1 10.4 10.1 10.2 10.2 0.03 ns ns ns Shell Ca content (g/kg DM) 384bc 383c 382c 387ab 382c 390a 0.6 ns < 0.001 0.002
Shell P content (g/kg DM) 1.37ab 1.32b 1.31b 1.30b 1.32b 1.46a 0.017 ns ns 0.050
NPP = non-phytate phosphorus, F = phytase, FTU = phytase units, DM = dry matter, ns = non-significant
a–cmeans in the same row with different superscripts differ significantly
Table 5. Breaking strength, dry matter, and ash content of tibia bone in hens fed different levels of phosphorus and phytase
Levels of NPP High Medium Low
SEM Probability Phytase (FTU/kg) 0 150 0 150 0 150 NPP F NPP × F Breaking strength (N) 200 194 197 183 175 174 5.0 ns ns ns DM (g/kg) 921a 895b 918a 922a 918a 925a 2.2 0.006 ns < 0.001
Ash (g/kg) 506a 457d 497ab 480bc 486abc 470cd 3.6 ns < 0.001 0.040
Ash (g/kg DM) 549 510 541 521 530 508 3.3 ns < 0.001 ns
NPP = non-phytate phosphorus, F = phytase, FTU = phytase units, DM = dry matter, ns = non-significant
[image:5.595.66.531.644.724.2]with the medium and low levels of dietary NPP without F supplementation. The highest Ca and P contents (P = 0.002 and P = 0.050) were meas-ured in the shells of eggs laid by hens fed the diet with 1.7 g/kg of NPP with 150 FTU of 3-phytase. A separate effect of phosphorus on internal and external egg quality parameters was not observed.
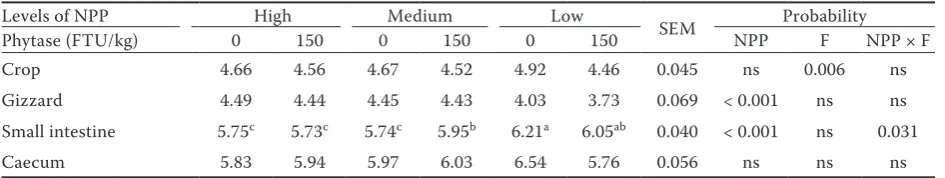
As shown in Table 5, the breaking strength of the tibia bone was not influenced by NPP or F. The high level of NPP with F addition signifi-cantly decreased the dry matter (P < 0.001) and ash content in the tibia bones (P = 0.040). Phytase supplementation decreased the pH in the crop seg-ment of the digestive tract (P = 0.006), whereas P addition increased the pH in the gizzard segment (P < 0.001) (Table 6). The highest value of pH in the small intestine (P = 0.031) was measured in the hens fed the diet with the low level of NPP without the addition of F.
DISCUSSION
From previous experiments by Skřivan et al. (2010) and Englmaierová et al. (2012) it is evident that a higher concentration of NPP (4.1 and 3.7 g/kg) in the diet has a negative effect on the hen-day egg production, feed intake, and feed conversion ratio. Thus, in the present study, lower levels of NPP were chosen. The high AP level of 3.0 g/kg (unlike the lower levels of 2.1 and 1.7 g/kg) increased the egg production and egg mass production. This finding is consistent with the findings of Skřivan et al. (2010), who showed that AP levels of 2.7 g/kg in a wheat-based diet and 3.0 g/kg in a maize-wheat-based diet are adequate for hens with an intake of 115 g of feed with 35 g/kg of Ca and without F addition and do not have a negative impact on performance or egg quality. The treatment with 2.1 g/kg NPP yielded results for hen-day egg production and egg mass production similar to those obtained with the diet
with 3.0 g of NPP/kg, with or without F. Ahmadi and Rodehutscord (2012) stated that on the basis of an evaluation using a full quadratic model, maize-soybean meal-based diets containing 2.2 g/kg of NPP without supplemental F resulted in high egg production, egg mass, and feed efficiency in hens. In the presence of 150, 300, and 400 FTU/kg of feed, the dietary NPP level may be decreased, and the optimal levels were calculated as 1.8, 1.5, and 1.4 g/kg, respectively. At the end of the experiment, the heaviest hens were those from the group with 2.1 g/kg of NPP. The NPP level of 3.0 and 1.7 g/kg decreased live weight by about 100 and 300 g. A low and higher level of NPP in diets with higher Ca contents was the cause of body weight decrease. Garlich et al. (1975) found that body weight gain in hens was significantly reduced by a phosphorus-deficient diet (3.9 g of total P/kg) fed for 21 days. Boling et al. (2000) showed that a 1.0 g of AP/kg diet resulted in significantly lower (P < 0.05) body weights. In addition, live weight of hens fed the 2.0, 2.5, and 4.5 g of AP/kg diets did not significantly differ throughout the experiment from the 21st to the 70th week of hens’ age (Boling et al., 2000). On the other hand, Mikaelian and Sell (1981) and Liebert et al. (2005) did not observe an effect of P on body weight.
[image:6.595.63.536.101.190.2]In this experiment, egg weight increased with increasing NPP in the diet (P = 0.003), while sup-plementation with 3-phytase decreased egg weight (P < 0.001). Heavier eggs being laid after feed-ing hens a diet with a higher content of P were also reported by Gordon and Roland (1998) and by Francesch et al. (2005). The opposite results concerning the effect of F on egg weight were reported by Cabuk et al. (2004), who noted that F supplementation increased egg weight. Neither Carlos and Edwards (1998) nor Berry et al. (2003) found any significant effect of F on egg weight. In Table 6. Effect of phosphorus and phytase levels on pH of the digestive tract of hens
Levels of NPP High Medium Low SEM Probability Phytase (FTU/kg) 0 150 0 150 0 150 NPP F NPP × F Crop 4.66 4.56 4.67 4.52 4.92 4.46 0.045 ns 0.006 ns Gizzard 4.49 4.44 4.45 4.43 4.03 3.73 0.069 < 0.001 ns ns Small intestine 5.75c 5.73c 5.74c 5.95b 6.21a 6.05ab 0.040 < 0.001 ns 0.031
Caecum 5.83 5.94 5.97 6.03 6.54 5.76 0.056 ns ns ns
NPP = non-phytate phosphorus, F = phytase, FTU = phytase units, ns = non-significant
the present experiment, lower egg weight due to F addition was probably caused by lower feed intake and higher egg production in these treatments.
In contrast to the performance results, the highest albumen quality was associated with the treatment with the low level of dietary NPP without F supplementation. Skřivan et al. (2010) stated that a high level of AP (4.1 g/kg) in a wheat-based diet significantly (P < 0.001) decreased albumen height, albumen index, and Haugh units (HU). Conversely, Um and Paik (1999) did not detect significant differences in Haugh units or the shell strength of egg laid by hens fed diets containing different levels of P and F. Phytase addition into diets with higher Ca content significantly decreased values of shell thickness (P = 0.001), shell breaking strength (P = 0.005), and ash content (P < 0.001) in tibia bone. These results are not consistent with those of Al-Sharafat et al. (2009), who reported that F supplementation significantly increased tibia ash and Ca in tibia ash. The negative effect of F observed in the present study could be due to the greater Ca : P ratios (from 7.5 : 1 to 10.5 : 1) in all of the evaluated diets, and F supplementation may have exacerbated this effect by releasing Ca from the phytate complex. Keshavarz (2003) showed that the presence of F reduced several indices of shell quality. On the other hand, 150 FTU of 3-phytase improved the pigmentation of the egg yolk. Similar observations were reported by Kozlowski and Jeroch (2011). The low content of NPP with 3-phytase significantly increased the P and Ca contents in the shell. The higher storage of the minerals in the shell was probably related to a lower egg production and lower egg weight.
The small intestine is the main part of the diges-tive tract for Ca and P absorption and is highly affected by intestinal pH. The 3-phytase from Aspergillus niger has two optimal pH levels, 2.5 and 5.0 (Lassen et al., 2001; Tamim et al., 2004). Significant interaction between NPP and F was found in the pH of the small intestine. The low level of P without F addition was found to have a negative effect on the pH in the small intestine, which increased to 6.21. Shafey et al. (1991) simi-larly showed that the pH in the small intestine of broilers ranges from 5.5 to 6.6. However, because the pH was within this range, the dietary Ca com-plexes with the phytate made the phytate unavail-able for F activity (Wilkinson et al., 2011). Nelson (1976) observed negative effects of the Ca level on F activity in the gut. Coincidently, Wilkinson et al.
(2011) showed that dietary Ca reduced the efficacy of F, which resulted in decreased phytate-P and increased phosphorus excretion and facilitating the formation of mineral-phytate complexes. Consist-ently with results of Englmaierová et al. (2012), the high and medium levels of P increased the pH in the gizzard to a level suitable for F activity.
CONCLUSION
The performance and egg quality of hens was found to depend on the ratio of minerals in the feed mixture. The presence of a higher Ca content negatively affected the impact of F in the diets with different levels of P. With respect to perfor-mance, 2.1 g of NPP with 150 FTU was found to be sufficient in the diet of hens housed in enriched cages. A high level of dietary NPP with F addi-tion, in combination with a high concentration of Ca in the diet, negatively affected the chemical composition of the tibia. The highest albumen quality was associated with the diet with 1.7 g of NPP without F addition.
REFERENCES
Ahmadi H., Rodehutscord M. (2012): A meta-analysis of responses to dietary nonphytate phosphorus and phytase in laying hens. Poultry Science, 91, 2072–2078.
Ahmed A.M.H., Rodriguez-Navarro A.B., Vidal M.L., Gautron J., Garcia-Ruiz J.M., Nys Y. (2005): Changes in eggshell mechanical properties, crystallographic texture and in matrix proteins induced by moult in hens. British Poultry Science, 46, 268–279.
Al-Massad M., Al-Shdefat R., Khashroum A. (2011): The effects of microbial phytase and dietary calcium level on the performance and eggshell quality in laying hens fed marginal phosphorus diets. Asian Journal of Animal Sciences, 5, 118–126.
Al-Sharafat A., Al-Desiet B., Al-Kouri S. (2009): The effect of calcium level, microbial phytase and citric acid on performance parameters and eggshell quality of laying hens fed corn soybean meal diet. Journal of Animal and Veterinary Advances, 8, 1829–1837.
AOAC (2005): Official Methods of Analysis. 18th Ed. AOAC
International, Gaithersburg, USA.
Berry W.D., Hess J.B., Lien R.J., Roland D.A. (2003): Egg production, fertility, and hatchability of breeder hens receiving dietary phytase. Journal of Applied Poultry Research, 12, 264–270.
of phytase and available phosphorus on performance of laying hens. Poultry Science, 79, 535–538.
Cabuk M., Bozkurt M., Kirkpinar F., Ozkul H. (2004): Effect of phytase supplementation of diets with different levels of phosphorus on performance and egg quality of laying hens in hot climatic conditions. South African Journal of Animal Science, 34, 13–17.
Carlos A.B., Edwards H.M. (1998): The effects of 1,25-dihy-droxycholecalciferol and phytase on the natural phytate phosphorus utilization by laying hens. Poultry Science, 77, 850–858.
Castillo C., Cuca M., Pro A., Gonzalez M., Morales E. (2004): Biological and economic optimum level of calcium in white leghorn laying hens. Poultry Science, 83, 868–872. Driver J.P., Pesti G.D., Bakalli R.I., Edwards H.M. (2005):
Effects of calcium and nonphytate phosphorus concen-trations on phytase efficacy in broiler chicks. Poultry Science, 84, 1406–1417.
Dušková D., Marounek M., Březina P. (2001): Determination of phytic acid in feeds and faeces of pigs and poultry by capillary isotachophoresis. Journal of the Science of Food and Agriculture, 81, 36–41.
Eeckhout W., De Paepe M. (1994): Total phosphorus, phytate phosphorus and phytase activity in plant feed-stuffs. Animal Feed Science and Technology, 47, 19–29. Englmaierová M., Dlouhá G., Marounek M., Skřivan M.
(2012): Efficacy of contrast levels of non-phytate phospho-rus and Aspergillus niger phytase in hens fed wheat-maize-based diets. Czech Journal of Animal Science, 57, 499–505. European Union Council Directive (1999): Council Direc-tive 1999/74/EC of July 19th, 1999. Official Journal of the
European Communities, L 203, 53–57.
Francesch M., Broz J., Brufau J. (2005): Effects of an experimen-tal phytase on performance, egg quality, tibia ash content and phosphorus bioavailability in laying hens fed on maize- or barley-based diets. British Poultry Science, 46, 340–348. Garlich J.D., James R.L., Ward J.B. (1975): Effect of short-term phosphorus deprivation on laying hens. Poultry Science, 54, 1193–1199.
Gordon R.W., Roland D.A. (1998): Influence of supple-mental phytase on calcium and phosphorus utilization in laying hens. Poultry Science, 77, 290–294.
Haugh R.R. (1937): The Haugh unit for measuring egg qual-ity. US Egg and Poultry Magazine, 43, 552–555, 572–573. Hulan H.W., De Groote G., Fontaine G., De Munter G., McRae
K.B., Proudfoot F.G. (1985): THe effect of different totals and ratios of dietary calcium and phosphorus on the per-formance and incidence of leg abnormalities of male and female broiler-chickens. Poultry Science, 64, 1157–1169. Keshavarz K. (2000): Nonphytate phosphorus requirement
of laying hens with and without phytase on a phase feed-ing program. Poultry Science, 79, 748–763.
Keshavarz K. (2003): A comparison between cholecalciferol and 25-OH-cholecalciferol on performance and eggshell quality of hens fed different levels of calcium and phos-phorus. Poultry Science, 82, 1415–1422.
Kozlowski K., Jeroch H. (2011): Efficacy of different levels of
Escherichia coli phytase in hens fed maize-soyabean meal based diets with a decreased non-phytase phosphorus content. Journal of Animal and Feed Sciences, 20, 224–235. Lassen S.F., Breinholt J., Ostergaard P.R., Brugger R., Bis-choff A., Wyss M., Fuglsang C.C. (2001): Expression, gene cloning, and characterization of five novel phytases from four basidiomycete fungi: Peniophora lycii, Agrocybe pediades, a Ceriporia sp., and Trametes pubescens. Ap-plied and Environmental Microbiology, 67, 4701–4707. Liebert F., Htoo J.K., Sunder A. (2005): Performance and
nutrient utilization of laying hens fed low-phosphorus corn-soybean and wheat-soybean diets supplemented with microbial phytase. Poultry Science, 84, 1576–1583. Lim H.S., Namkung H., Um J.S., Kang K.R., Kim B.S., Paik
I.K. (2001): The effects of phytase supplementation on the performance of broiler chickens fed diets with differ-ent levels of non-phytate phosphorus. Asian-Australian Journal of Animal Science, 14, 250–257.
Mikaelian K.S., Sell J.L. (1981): Performance of laying hens fed various phosphorus levels continuously or phase fed decre-mental phosphorus levels. Poultry Science, 60, 1916–1924. National Research Council (1994): Nutrient Requirements of Poultry. 9th Ed. National Academies Press,
Washing-ton, USA.
Nelson T.S. (1976): The hydrolysis of phytate phosphorus by chicks and laying hens. Poultry Science, 55, 2262–2264. Rao S.V.R., Raju M.V.L.N., Reddy M.R., Pavani P., Sunder
G.S., Sharma R.P. (2003): Dietary calcium and non-phytin phosphorus interaction on growth, bone mineralization and mineral retention in broiler starter chicks. Asian-Australasian Journal of Animal Science, 16, 719–725. Rao S.V.R., Raju M.V.L.N., Reddy M.R., Pavani P. (2006):
Interaction between dietary calcium and non-phytate phosphorus levels on growth, bone mineralization and mineral excretion in commercial broilers. Animal Feed Science and Technology, 131, 133–148.
Selle P.H., Cowieson A.J., Ravindran V. (2009): Conse-quences of calcium interactions with phytate and phytase for poultry and pigs. Livestock Science, 124, 126–141. Shafey T.M., McDonald M.W., Dingle J.G. (1991): Effects of
dietary calcium and available phosphorus concentration on digesta pH and on the availability of calcium, iron, magnesium and zinc from the intestinal contents of meat chickens. British Poultry Science, 32, 185–194.
Sheikhlar A., Kasim A.B., Chwen L.T., Bejo M.H. (2009): Effect of varying ratios of dietary calcium and phosphorus on performance, phytate P and mineral retention in Japa-nese quail (Coturnix cotnurnix Japonica). International Journal of Poultry Science, 8, 692–695.
Skřivan M., Englmaierová M., Skřivanová V. (2010): Effect of different phosphorus levels on the performance and egg quality of laying hens fed wheat- and maize-based diets. Czech Journal of Animal Science, 55, 420–427.
Sohail S.S., Roland D.A. (2000): Influence of phytase on calcium utilization in commercial layers. Journal of Ap-plied Poultry Research, 9, 81–87.
Swiatkiewicz S., Arczewska-Wlosek A. (2012): Bone quality characteristics and performance in broiler chickens fed diets supplemented with organic acids. Czech Journal of Animal Science, 57, 193–205.
Tamim N.M., Angel R., Christman M. (2004): Influence of dietary calcium and phytase on phytate phospho-rus hydrolysis in broiler chickens. Poultry Science, 83, 1358–1367.
Tůmová E., Gous R.M. (2012): Interaction between oviposi-tion time, age, and environmental temperature and egg quality traits in laying hens and broiler breeders. Czech Journal of Animal Science, 57, 541–549.
Um J.S., Paik I.K. (1999): Effects of microbial phytase sup-plementation on egg production, eggshell quality, and mineral retention of laying hens fed different levels of phosphorus. Poultry Science, 78, 75–79.
Wilkinson S.J., Selle P.H., Bedford M.R., Cowieson A.J. (2011): Exploiting calcium-specific appetite in poultry nutrition. Worlds Poultry Science Journal, 67, 587–598.
Received: 2013–07–23 Accepted after corrections: 2013–12–06
Corresponding Author
Ing. Michaela Englmaierová, Ph.D., Institute of Animal Science, Přátelství 815, 104 01 Prague 10-Uhříněves, Czech Republic