Czech J. Food Sci. Vol. 21, No. 2: 71–77
Wheat flour is able to form cohesive dough with viscoelastic properties. Wheat flour dough is able to retain gas which is essential for the production of bakery products with light texture (H������ & R����� 1993). The factor responsible for the dough formation and the ability to retain gas is gluten proteins. Dough mixing, fermentation and handling affect gluten development which influences the rheological properties of dough.
Rheological characteristics such as elasticity, viscosity and extensibility are important in pre-dicting the technological quality of dough and that of final products. The rheological characteristics change throughout the breadmaking process and are difficult to measure in definitive terms (C����������� & P������� 1993). Some of the problems connected with the determination of the rheological properties of fermented dough are due to continual changes in the system geometry and density. Yeast is important not only for the gas production but also for the changes in the rheo-logical properties of dough. The deformation of
dough during fermentation is three-dimensional, so its viscosity and elasticity change continually (H������ et al. 1979).
For many years, most rheologists have been studying flour-water systems instead of yeasted doughs. This approach assumes that the simpli-fied systems can provide an insight into the flour behaviour in a dough system. The physical dough-testing instruments are useful but not satisfactory for the prediction of the breadmaking behaviour because the rates and degrees of deformation in tests are much more rapid and higher than those during fermentation and baking rise of the dough systems. The tests designed in accordance with the actual dough processes would take as much time as bread baking tests and would not be suitable for routine laboratory analyses (B������ 1990). There are also too many changes in yeasted dough during fermentation and baking to be accurately tracked. Rheological changes during fermentation affect the machinability and ultimately the qual-ity of the final baked product. These changes are
Use of Maturograph and Spring Oven for the
Determination of Wheat Flour Baking Characteristics
M���� HRUŠKOVÁ and J������ SKVRNOVÁ
Department of Carbohydrate Chemistry and Technology, Institute of Chemical Technology, Prague, Czech Republic
Abstract
H������� M., S������� J. (2003): Use of maturograph and spring oven for the determination of wheat flour baking characteristics. Czech J. Food Sci., 21: 71–77.
Quality characteristics of 30 commercial wheat flour samples from Czech industrial mills and 30 wheat flour sam-ples prepared from wheat varieties cultivated in experimental fields (all from wheat harvest 2000) were analysed in detail including maturograph and spring oven (both from Brabender, Germany) as well as bread baking test (Czech method). Specific bread volumes of all flour samples were compared with the bread volumes determined by the oven spring test. The correlation analysis which expressed the relations between wheat flour rheological characteristics and the bread volume is reported. The maturograph parameters correlate significantly with the specific bread volume and the final volume obtained by means of oven spring. All the correlations with the baking test values are high. Both instruments used are suitable for the prediction of the flour baking quality.
evident but have proven difficult to be studied by fundamental rheological tests. The rheological behaviour of yeasted dough is complicated and the results obtained under the conditions of the method do not necessarily hold true for the actual conditions of fermentation and proofing. The tests by farinograph or extensigraph are useful but only the bread baking test provides a high degree of prediction. As the baking test requires a lot of time and equipment to be performed and as the interpretation of the results is partly subjective, a realiable test capable to predict the baking quality and rheological characteristics of dough is desired (C������ & D� L��� 2000).
There are several important phases during the processing of yeasted dough. One of these phases is the proofing of shaped bakery products. Physi-cal mechaniPhysi-cal properties of the dough and their dynamic changes in this technological operation show how the previous processes (such as dough preparation and fermentation) have been influ-enced by the properties of materials used, above all flour and yeast.
Maturograph (Brabender, Germany) is used for the determination of the optimum of the rising time, the tolerance of the final proofing time, and the dough resistance against mechanical strain. There are no international standards for the tests of the quality of wheat flour by maturograph as there are for the tests by means of farinograph and extensigraph, and so many workers use modified procedures for particular reasons. During the wheat flour test by maturograph, the properties of dough are evaluated after a certain rising time.The dough examined can be prepared from wheat flour and the usual baking components by the same way that is usual for the bread baking test.
The oven spring apparatus (Brabender, Germany) is used for the volume determination of the opti-mal proofing loaf (according to the maturograph results) and its changes during baking in oil bath with temperature increasing from 30°C to 100°C. Similary as for the maturograph test, there exist no international standards for the testing of the quality of wheat flour by the oven spring apparatus.
The laboratory maturograph and oven spring test use farinograph for the preparation of the dough because the dough prepared in this way has always two important parameters pre-determined, i.e. the dough consistency and the dough temperature, both of them highly influencing the running proc-esses during the proofing time. The proofing time
needed for the largest volume of the final product is influenced by the formula and the quality of yeast and of flour. If during the maturograph and oven spring tests of several wheat flour samples the same components are used and the processes of the dough preparation (rising and handling) are standardised, the differences in the parameters of the curves obtained by maturograph and oven spring apparatus can be explained by different properties of the flours tested (S����� 1981).
The objective of this study was to determine the properties of various flours samples by ma-turograph and the oven spring apparatus according to the proposed procedure (Brabender Instruction Manual Nr. 8701). Doughs were prepared by the standardised processes designed for the baking test. Simultaneously the samples were tested by a standard bread baking test. The relationships between the maturograph and the oven spring characteristics and the loaf volume in the baking test were also evaluated.
MATERIALS AND METHODS
Two sets of fine wheat flour samples were used (wheat harvest 2000):
– 30 samples of wheat flour produced in various mills in the Czech Republic – marked as com-mercial flours,
– 30 samples of laboratory-milled wheat flour (laboratory mill Bühler) coming from various varieties of wheat (supplied by Central Institute for Supervising and Testing in Agriculture, Brno) – marked as variety flours.
Quality of wheat flour
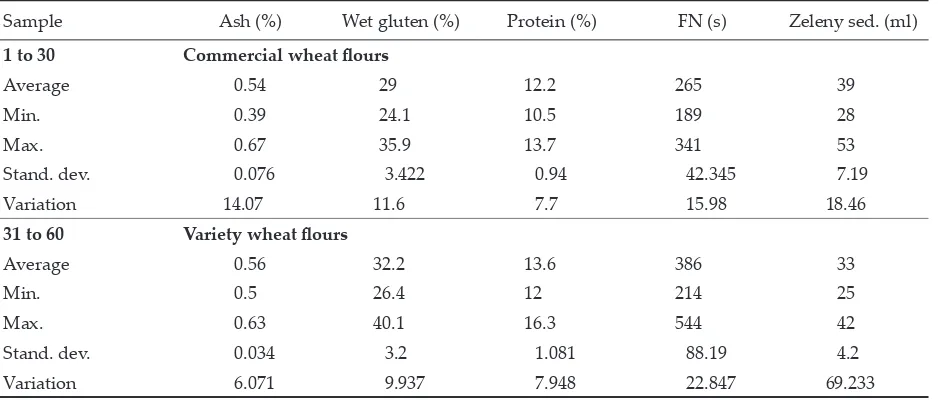
Wheat flour quality characteristics are described by the following parameters (Table 1):
– ash content – Czech standard ČSN 56 0512 – wet gluten content – Czech standard ČSN
56 0512
– protein content – Czech standard ČSN 56 0512 – falling number – International standard ISO
3093
– Zeleny sedimentation value – International standard ICC 116.
Dough preparation
Dough samples were prepared by farinograph with the constant consistency of 600 BU.
The composition was: wheat flour (100%), com-pressed yeast (4%), salt (1.7%), sugar (1.5%), fat (1%) and water needed for the standard dough consistency of 600 BU.
The mixing time ranged between 3.5–5.0 minutes depending on the dough development and stabil-ity, dough temperature was 30°C.
Maturograph test
The piece of dough tested (155 g) was placed immediately in the fermentation cabinet of ma-turograph (temperature 30°C, relative humidity 95%) for a period of 45 minutes. After 20, resp. 10 min from the beginning, the dough was remixed in a special maturograph rolling device. Then the dough weight was adjusted to 150 g and after the final handling the piece of dough was placed into the measuring container of maturograph.
Maturograph records the fermentation behav-iour of dough in relation to the proofing time by means of a sensing probe which touches the dough periodically (2 min).
The resulting zigzag curve – maturogram – char-acterises the increase of the dough volume and its rheological properties during the proofing time. Four characteristics can be measured:
– final proofing time-is the time in minutes from the start of the final proof to the first drop of the curve after the maximum,
– proofing stability-is evaluated in minutes with a stencil in the range of the curve maximum, – elasticity-is the band width in the range of the
maximum peaks expressed in maturograph units (MU),
– dough level-is the value in MU from the zero line to the maximum peak of the curve.
Oven spring test
The test piece of dough (53 g) was immediately placed in the fermentation cabinet of maturograph (temperature 30°C, relative humidity 95%) for a 45-minute rest. The dough weight was then adjusted to 50 g and, after the final rolling, the loaf of dough was inserted into the measured basket. The next proofing time in the fermenta-tion chamber of maturograph depended on the optimum period derived from the maturograph curve which was measured simultaneously. Sub-sequently, the piece of dough was placed into the oven spring oil bath at temperature of 30°C and the
actual measurement started. The oil temperature increased continuously to 100°C within twenty two minutes and the dough volume increased. Then the weight of the basket with dough was marked on registered paper. The resulting curve – oven spring record – characterises the increase of the dough volume to oil baked loaf of bread. The dif-ference between the starting and the final point of the curve expresses the swelling of the dough during the oil baking period. Three parameters can be measured:
– dough volume-is the height in oven units (OU) of the curve at the beginning of the test,
– bread (baking) volume-is the height in OU of the curve at the end of the test,
– oven rise-is the differences between the final volume and the dough volume (OU).
Baking test
The dough prepared in farinograph for the ma-turograph and the oven spring tests was also used for the standard baking test. The dough sample (250–260 g) was allowed to rest at 30°C for 50 min (relative humidity 95%) and than it was divided into three 70 g pieces. The pieces were moulded by hand, placed on a baking tray, and proofed for 45 min under the same conditions as above. Then they were baked at 240°C for 14 min in the oven with steam being introduced during the first 30 s.
The final products were cooled for two hours at room temperature and then the weight, the volume, and the shape of bread were evaluated. The volume was measured by means of mustard seed displacing and was expressed as the specific volume of 100 g of the product. The shape of bread was expressed as the ratio of the height to the diameter of the product.
The expression of the results
The rheological quality of wheat flour and the results of the baking test are presented by means of average values, minimum and maximum values, and by standard deviation and variation coeffi-cients for each set.
The maturograph curves are characterised by the final proofing time, dough level, dough elasticity, and proofing stability. The oven spring curves are described by the initial dough volume, the final bread volume, and the swelling (or increase) volume.
Vol. 21, No. 2: 71–77 Czech J. Food Sci. Czech J. Food Sci. Vol. 21, No. 2: 71–77
The relations between the maturograph and oven spring characteristics and the end product qual-ity parameters are expressed for the whole set of 60 samples by means of correlation analysis.
RESULTS AND DISCUSSION
The quality parameters of the wheat flours tested are presented in Table 1. The range of the parameters reveals differences in the quality of the flour samples (protein 10.5–16.3%, Zeleny sedimentation value 28–53 ml). Samples of the variety flours have a wider range of the quality
parameters. The average values of the parameters controlled correspond to the standard quality of fine wheat flour.
[image:4.643.90.559.126.326.2]The evaluation of the maturograms of the com-mercial and the variety flour samples is given in Table 2. The proofing time (the optimum time for reaching the maximum volume of the end product) lies in a wide range – for the commercial flour samples 28–50 min; for the variety flour samples 28–52 min. The dough level expresses the resist-ance of the dough against biochemical changes and the mechanical stress during proofing. The dough level for the commercial flour samples was higher Table 1. Wheat flour quality parameters
Sample Ash (%) Wet gluten (%) Protein (%) FN (s) Zeleny sed. (ml)
1 to 30 Commercial wheat flours
Average 0.54 29 12.2 265 39
Min. 0.39 24.1 10.5 189 28
Max. 0.67 35.9 13.7 341 53
Stand. dev. 0.076 3.422 0.94 42.345 7.19 Variation 14.07 11.6 7.7 15.98 18.46
31 to 60 Variety wheat flours
Average 0.56 32.2 13.6 386 33
Min. 0.5 26.4 12 214 25
Max. 0.63 40.1 16.3 544 42
Stand. dev. 0.034 3.2 1.081 88.19 4.2 Variation 6.071 9.937 7.948 22.847 69.233
[image:4.643.90.559.563.763.2]FN – falling number
Table 2. Maturogram evaluation
Sample Optimal proofing time (min) Dough level (MU) Elasticity (MU) Stability (min)
1 to 30 Commercial wheat flour
Average 38 753 235 4
Min. 28 450 175 1
Max. 50 1000 280 8
Stand. dev. 5.8 110.01 26.17 2.25
Variation 15.14 14.6 11.12 50.34
31 to 60 Variety wheat flour
Average 35 663 219 3
Min. 28 470 170 2
Max. 52 980 260 5
Stand. dev. 5.62 125.03 21.26 0.89
Variation 16.06 18.86 9.71 29.7
Vol. 21, No. 2: 71–77 Czech J. Food Sci. Czech J. Food Sci. Vol. 21, No. 2: 71–77
– in the range of 450–1000 MJ, for the variety flour samples lay in the range of 470–980 MJ. The firmness of the dough is expressed by the dough elasticity (the width of the maturogram) and was comparable in both sets of samples (170–280 MJ). The proofing stability reflects the time tolerance of the proofing time which ensures the highest volume of the final product. The proofing stability changed in a wider range (1–8 min) in the set of commercial samples as compared to the variety flours (2–5 min).
The evaluation of the oven spring curves of the commercial and the variety flour samples is sum-marised in Table 3. The dough volume lay in wide ranges for both sets of the flour samples, higher values having been found in the commercial set (230–470 MJ). The bread volume changed in the
same relation – for the variety flours in the range of 360–600 MJ, and in the range of 430–720 MJ for the commercial samples. The increase of the volume as expressed by the differences between the dough and bread volumes after the oil bak-ing period changed in a wide range in both sets of samples.
Table 4 gives the average results of the baking tests expressed by the specific volume of 100 g product and the bread shape characterised by the ratio of the height to the diameter of the final product.
[image:5.643.329.555.124.348.2]Figures 1 and 2 show the comparison of the spe-cific volumes of bread as obtained by the standard baking test and by oil baking in the oven spring apparatus. The differences of the specific volumes Table 3. Oven spring evaluation
Sample volume Dough (OU)
Bread volume
(OU)
Oven rise (OU)
1 to 30 Commercial wheat flour
Average 364 525 161
Min. 230 430 80
Max. 470 720 280 Stand. dev. 52.8 64.23 42.39 Variation 14.5 12.23 26.33
31 to 60 Variety wheat flour
Average 330 460 134
Min. 190 360 30
Max. 400 600 240 Stand. dev. 55.38 67.57 58.87 Variation 16.78 15.57 43.93
OU – oven spring units
Table 4. Bread baking test evaluation
Sample addition Water (%)
Specific volume
(ml/100 g) Ratio h/d
1 to 30 Commercial wheat flour
Average 52 328 0.73 Min. 49.6 272 0.61 Max. 56.7 397 0.86 Stand. dev. 1.98 28.8 0.05 Variation 3.81 8.78 6.85
31 to 60 Variety wheat flour
Average 54 324 0.68 Min. 49.8 246 0.58
Max. 61 403 0.85
[image:5.643.89.314.126.347.2]Stand. dev. 2.53 45.25 0.064 Variation 4.69 13.97 6.41
Figure 1. Bread volume of commercial flours �
��� ��� ��� ��� ��� ��� ��� ���
� � �� �� �� �� �� ��
�������������
�
��
��
��
��
��
�
[image:5.643.99.507.615.781.2]Vol. 21, No. 2: 71–77 Czech J. Food Sci. Czech J. Food Sci. Vol. 21, No. 2: 71–77
of the flour samples depended on their techno-logical quality and ranged from 50 to 70 cm3. The evaluation of the wheat flour quality by means of baking in the oven spring apparatus was similar to that of the baking test carried out with the optimal proofing time. In the case of the variety flours, a worse correlation was found between both results of the baking proofs.
Relationships between the quality parameters of wheat flours
The statistically important relations between the quality parameters of both sets (60 flour samples) were investigated by correlation analysis. From Ta-ble 4 it is obvious that the maturograph parameters, i.e. the optimal proofing time, dough level and dough
elasticity, were mutually dependent on the significant level of 99%. These maturograph characteristics also correlated also significantly with the specific bread volume. The statistically important relations between the maturograph parameters with the exception of the dough stability, and the final bread volume as obtained by means of the oven spring were also proved in the two sets followed.
The specific bread volume correlated signifi-cantly with the optimal proofing time, the dough level, and the bread volume as obtained by the oven spring tests. The dependence of the specific volumes of bread and the increase of the dough volume during oven spring oil baking was not proved. The relations between the final proofing time, the dough level, and the shape of bread was found to be statistically most important.
0 100 200 300 400 500 600 700
0 5 10 15 20 25 30 35
Flour samples
Br
ea
d
vo
lu
m
e
[image:6.643.89.360.109.277.2]Baking test Oven spring test
Table 5. Results of correlation analyses
Maturograph Oven spring Baking test
Proofing (min)
Dough level (MU)
Elasticity
(MU) Stability (min)
Dough vol. (OU)
Bread vol. (OU)
Oven rise (OU)
Specific vol.
(ml/100 g) Ratio h/d Proofing 1 0.785 0.631 0.075 0.57 0.618 0.282 0.365 0.719
Dough level 1 0.771 –0.017 0.57 0.581 0.209 0.307 0.742
Elasticity 1 0.098 0.351 0.435 0.218 0.256 0.533
Stability 1 0.149 0.036 –0.095 –0.079 0.094 Dough vol. 1 0.694 -0.057 0.429 0.531
Bread vol. 1 0.654 0.478 0.535
Increase 1 0.211 0.201
Specific vol. 1 0.263
Ratio h/d 1
[image:6.643.88.562.560.762.2]r0.01 = 0.3361; r0.05 = 0.2546
Vol. 21, No. 2: 71–77 Czech J. Food Sci. Czech J. Food Sci. Vol. 21, No. 2: 71–77
Conclusion
The maturograph and oven spring test contribute to the comprehensive evaluation of wheat flour quality by means of Brabender rheological devices providing a detailed description of the behaviour of the fermented dough during the final proofing time and special baking in the oil bath.
Wheat flours made both in industrial mills from commercial wheat and in a laboratory mill from wheat varieties obtained by selective cultivation differed in their maturograph and oven spring be-haviour. Similarly, the final bakery products obtained from these samples revealed different values of the bread specific volume in standard baking tests. These differences can be explained on the ground of the respective amounts and qualities of flour proteins which have an important effect on the results of the fermenting and the baking tests. It is obvious that maturograph and oven spring are able to differenti-ate flours of different baking quality.
Optimal final proofing time results in increas-ing the specific volume of final bakery products in the dependence of technological flour quality and it was also proved by oil baking test. Ma-turograph parameters, with the exception of the dough stability, correlate with the bread specific volume and the final oven spring bread volume. These results are in agreement with the previous studies of S����� (1981).
The use of maturograph and oven spring appa-ratus will be suitable for observing the effect of
various bakery improving agents on the changes in fermented dough technological characteristics in relation to the wheat flour quality and the volume of the final product.
References
B������ A.H. (1990): Dough structure, dough rhe-ology and baking quality. Cereal Food World, 35: 237–244.
C������ M., D� L��� I. (2000): Relationship between loaf volume and gas retention of dough during fer-mentation. Cereal Food Sci., 45: 214–218.
C����������� Z., P������� Y. (1993): Gas fermentation and gas retention. I The system and methodology. Cereal Food Sci., 38: 141–143.
Brabender Instruction Manual, Nr. 8701, Brabender OHG Duisburg 1997.
H������ R.C., H�� K.H., J���� R.C. (1979): A simple spread test to measure the rheological properties of fermenting dough. Cereal Chem., 56: 228–236. H������ R.C., R����� D.E. (1993): The formation and
properties of wheat flour doughs. In: Dough Rheo-logy and Baked Product Texture. Workshop. TNO, Wageningen, Netherlands.
S����� W. (1981): Moeglichkeiten und Grenzen standardisierter Backversuche. Getreide Mehl u. Brot, 35: 101–102.
Received for publication February 13, 2002 Accepted a�er corrections January 28, 2003
Souhrn
H������� M., S������� J. (2003): Použití přístroje maturograf a OTG pro stanovení pekařských charakteristik pšeničné mouky. Czech J. Food Sci., 21: 71–77.
Jakostní parametry 30 vzorků pšeničné mouky hladké světlé z průmyslových mlýnů ČR a 30 vzorků odrůdových mouk hladkých ze šlechtitelských zkoušek (sklizeň 2000) byly zjištěny včetně měření na maturografu , OTG přístroji (oba od firmy Brabender, SRN) a pekařským pokusem (uzanční postup VŠCHT Praha). Měrný objem pečiva byl porovnáván s objemem získaným na přístroji OTG. Závislost zjištěných reologických charakteristik pšeničných mouk a parametrů pečiva byla hodnocena korelační analýzou.
Klíčová slova: pšeničná mouka; těsto; reologické vlastnosti; maturograf; OTG; pekařský pokus
Corresponding author:
Ing. M���� H������� CSc., Vysoká škola chemicko-technologická, Ústav chemie a technologie sacharidů, Technická 5, 166 28 Praha 6, Česká republika