Abstract—This paper discusses the robust classification for large data, in case classification of vegetation area at Jakarta with remote sensing. Remote Sensing is the process involving an interaction between incident radiation and the targets of interest. The classification process is guided in two steps; training and classification steps. The training step is done to know the reference spectral of vegetation area, and the classification step is carried out to clasify the Jakarta area into the vegetation and the non vegetation area. The hole process of classification is not simple. The main problem is noise. The claud covering area is considered as noise. The classification of large data with noise needs the efficient and effective approach. The aim of the paper is to propose a new robust approach , the Modified MVV, to classify the vegetation area of Jakarta. The Modified MVV is the modified data subset having minimum of a square of length of a parallelotope diagonal . The good properties of Modified MVV are the consistent estimator and the more efficient computational time than is of MVV.
Index Terms—breakdown point, consistent estimator,
outlier, remote sensing, minimum vector variance
I. INTRODUCTION
HE awareness of anomalous observation or outlier was almost a hundred years ago, since Irwin [10]proposed a criterion for the rejection of anomalous data based on deviation from the mean. There are various meanings of outlier, but it is well understood that an outlier is an observation which seem to be clearly deviated among the others, Grubbs [4]. Outliers can be arised from the human error, an instrument error, an uncontrollable event or simply through natural deviations in populations. An outlier can influence the data analysis and even the result of experiment. To avoid the bad observation, it is ussually to discard an outlier. The one or more outliers should not be discarded, the outlier accommodation shuld be chosen to minimize that effect.
The robust method is one approach of the outlier accomodation. Hampel et.al [6] stated that Robust Statistics, nontechnical sense, is concerned with the fact that many assumptions commonly made in statistics (such as normality, linearity, independence) are at most approximations to reality. The Major goal of robust
Dyah E. Herwindiati is lecturer at Tarumanagara University, Jln Let. Jend. S Parman 1, Jakarta 1140, Indonesia. (e-mail:
Sani M. Isa Author is lecturer at Tarumanagara University, Jln Let. Jend. S Parman 1, Jakarta 1140, Indonesia. (e-mail: [email protected])
Desi Arisandi is Lecturer at Tarumanagara University, Jln Let. Jend. S Parman 1, Jakarta 1140, Indonesia (e-mail: [email protected])
statistics is to develop methods that are robust against the possibility that one or several unannounced outliers may occur anywhere in the data.
The robust Mahalanobis distance; the implementation of Mahalanobis distance for handling an outlier, is chosen as a tool for detecting outliers. The idea was proposed by many good scientists, such as Rousseeuw and van Zomeren [16], Hadi [5], Hawkins [7], Rousseeuw and van Driessen [14], Billor et.all [2] and Hubert et.al [9]. They proposed the robust measure based on the same criteria that is to determine the location and covariance matrix in a subset giving the minimum volume of ellipsoid or minimum covariance determinant (MCD).
MCD is the famous measure of dispersions in the study of multivariate analysis. The advantage of this measure are that MCD is robust with high BP and it gives an affine equivariant location estimator and a covariance matrix. But MCD comes with the ‘high cost’ of computation. The efficiency of the algorithm decreases when the dimension of data increases. On the aspect of algorithm efficiency, the MCD is not “cheap”, based on Cholesky decomposition for large value of variate p, the computation of CD is of order
3 ( )
O p . Herwindiati et.all [8] proposed the Minimum Vector Variance (MVV), the robust procedure which is more efficient than MCD procedure. This algorithm, compared with FMCD algorithm, has a lower computational complexity; the computational complexity of MVV is of order 2
( )
O p
This paper discusses the robust classification for large data, in case classification of vegetation area of Jakarta with remote sensing. Data of remote sensing is often known as multispectral data, that is the sets of data obtained simultaneously, but each set obtained by sensing a different part of the electromagnetic spectrum. Remote sensing is defined as the science (and to some extent, art) of acquiring information about the earth’s surface without actually being in contact with it, Natural Resources Canada [12]
The classification process is guided in two steps, training and classification steps. The training step is done to know the reference spectral of vegetation area, and the classification step is carried out to clasify the Jakarta area into the vegetation and the non vegetation area. The hole process of classification is not simple. The main problem is noise. The cloud covering area is considered as noise. The classification of large data with noise needs the efficient and effective approach.
The aim of the paper is to propose a new robust approach considered to be the efficient and effective method. The
The Robust Classification for Large Data
(Case: Classification of Jakarta Vegetation area
by Using Remote Sensing Data )
Dyah E. Herwindiati, Sani M. Isa, and Desi Arisandi
approach is called as the Modified MVV. The Modified MVV is the modified data subset having minimum of a square of length of a parallelotope diagonal to estimate the location and scater. The algorithm and good performance of Modified MVV are shown in Section III and IV. Next, the result of vegetation classification are appeared in the end of paper.
II. REMOTE SENSING DATA
[image:2.612.319.535.64.239.2]Remote Sensing is the process involving an interaction between incident radiation and the targets of interest. Multispectral data of Jakarta comes from Landsat 7 satelite. Data is aquired by 7 spectral band sensor which covers visible, near infrared, and mid infrared spectrum. The spatial resolution of band 1 - 5, and band 7 are 30 m, the resolution of the sixth band is 60 m. Jakarta area is large (approximately 649.71 km2), that is more than 700.000 pixels. An each pixel contains seven channels of multispectral data. It means that an each pixel has seven digital numbers.
Figure 1. The Multispectral Jakarta formatted RGB Color
Space, on the year 2006
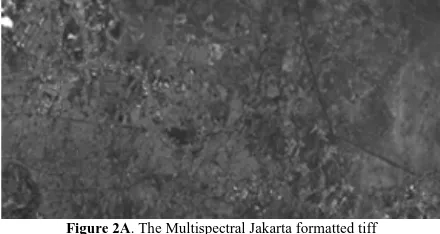
In this research, we take the Jakarta multispectral data from Landsat -7 satelit. Data is captured by sensor having 7 bands involving the visible spectral , near - IR, and mid – IR. The spatial resolution of 6 bands ( band 1 - 5, and band 7) are 30 square meters, the resolution of the sixth band is 60 square meters. Multispectral data of Jakarta is area covered by coordinate ( 5° 19' 12" - 6° 23' 54") South Latitude and (106° 22' 42" - 106° 58' 18") East Longitude. The following figures are the examples of Jakarta mulispectral on the year 2000.
Figure 2A. The Multispectral Jakarta formatted tiff
[image:2.612.71.306.289.444.2]For Channel 3
Figure 2B. The Multispectral Jakarta Formatted tiff
For Channel 4
Figure 2C. The Multispectral Jakarta Formatted tiff
For Channel 5
III. THE MODIFIED MVV FOR CLASSIFICATION OF JAKARTA VEGETATION AREA
Jakarta; the capital of Indonesia; has a high population density. The population is almost 9 million on the year 2006. Spread over an area of around 700 square kilometres, the density population of Jakarta is recorded 13.756 people per square kilometres. Land use changes without the good planning. The quality of the environment gets worse day by day.
This paper investigates the change of vegetation area Jakarta on three years; the year 2000, 2002 and 2006; by using the classification process. The multispectral data of Jakarta is large and it is also found the noise in several area. That process is not simple, it needs the efficient and effective approach to classify the areas. The new robust approach is chosen to have the ‘reliable’ result.
A. The Robust Modified Minimum VectorVariance
The Modified MVV is the modified data subset having minimum of a square of length of a parallelotope diagonal to estimate the location and scater. Herwindiati et.all [8] proposed the Minimum Vector Variance (MVV) for application in outlier labeling. The algorithm of MVV is not significantly different with Fast Minimum Covariance Determinant (FMCD), which is proposed by Rousseeuw and van Driessen [14], except that the criterion used here is not MCD but MVV.
The FMCD algorithm is high breakdown point robust procedure that is constructed based on the so-called C-step. The basic theorem and concept of C-Step was described by Rousseeuw and van Driessen [14]as follows,
Consider a data set
{
X X1, 2, ,Xn}
r r r
[image:2.612.74.294.609.726.2]( )
11: 1 i H i
T = h
∑
∈ x and( )
(
)(
)
1
1: 1 i H i 1 i 1
S = h
∑
∈ x −T x −T ′.If det
( )
S1 ≠0, define the relative distances( )
(
) (
1)
1 i 1 i 1
d i = x −T S− x −T ′
for i=1, 2,L,n. Now take 2
H such that
{
d i i H1( )
, ∈ 2}
:,={
( )
d1 1:n,L,( )
d1 h n:}
are ordered distances, and compute T2 and S2 based on H2, then det( )
S2 ≤det( )
S1 , with equality if only if T2=T1 and2 1
S =S .
The algoritm is known as C-Step (‘concentration’ step) because it concentrates on hobservations with smallest distances. The concept of C- step tells us that it takes many initial choices of H1 before doing C-Step. The determining of H1; initial of data subset; is very important for estimator computation .
In the computation of robust estimator, the subset of ‘clean data’ has the important role. We know that Rousseeuw and van Driessen [14] approximated the MCD estimator by searching among all subsets containing half of the data that is most tightly clustered together; this subset has minimum generalized variance or minimum covariance determinant.
Minimum Vector Variance (MVV) is robust approach method using the minimization of vector variance (VV) criteria. The estimator MVV for the pair
(
μ
r,Σ)
is the pair(
TVV,SVV)
giving minimum vector variance. LetΣ
be covariance matrix, if Rousseuw [13] proposed covariance determinant (CD), i.e.,Σ
as multivariate dispersion measure, two decades later Djauhari [3] introduces vector variance or VV, i.e., Tr( )
Σ2as another measure. In general, the implementation of MVV algorithm, Herwindiati et.al [8], is to determine the initial of data subset; to concentrate the smallest distance using minimum vector variance and to estimate the estimator.
To compute multispectral data of Jakarta, the first step of MVV algorithm is not simple, we must choise the all possible data subset H containing h observations having the smallest VV from outcome of a index permutation. The computation becomes hard if we must calculate the permutation of n distinct objects taken
(
p+1)
when n is large.The modified data subset of MVV presents to reduce the computational time for the large data. Suppose
1, 2, , n
X Xr r L Xr are random samples of size n from a p-variate distribution of location parameter
μ
r
and positive definite covariance matrixΣ
, the algorithm of proposed method is described as:1. Compute the norm vector N i
( )
= Xri fori=1, 2,L,n. Next, sort from the smallest to the greatest. This order defines a permutation π on the observation index. Suppose the sorting is:( )
1( )
2( )
k( )
nN π ≤N π ≤ ≤L N π ≤ ≤L N π
Let H0⊂
{
1, 2,L,n}
with H0 =h and1 2
n p h= ⎢⎡ + + ⎤⎥
⎣ ⎦
. Determine the median N
( )
πk 2. Suppose T0r
and S0are a vector mean of dimension p and matrix covariance sample of H0 . Compute
( )
i 0d i = Xr −Tr = Xi −T0
r r
fori=1, 2,L,n. Next sort from the smallest to the greatest.
Consider d
( ) ( )
π1 ≤d π2 ≤ ≤L d( )
πk is the order distance. Take a set H1 consists of h observations ofindexπ
( ) ( )
1 ,π 2 ,L,π( )
h . H1 Can be assumed as the set of ’basic’or the initial subset.B. The Algorithm of Training and Classification Step
The process of classification is done with two steps. The first step is the training step and the second one is the classification step. Both of steps are composed by the Modified MVV.
The training step is done to know the reference spectral of vegetation land. The algoritm is described as follows, 1. Crop image of the vegetation area in size
(
30 30×)
pixelbased on the RGB color space of multispectral visual and Normalized Diference Vegetation Index (NDVI) 2. Compute the sample mean and covariance matrix by
using the Modified MVV.
First, define the initial subset of Modified MVV (see III A).
Second, apply the MVV algoritm for estimation, see Herwindiati et.al [8]
a. Let Hold subset containing h data points.
b. Compute the mean vector old H
X
r
and covariance matrix Hold and compute,( )
2
old
H
d i =
(
) (
1)
old old old
t
i H H i H
Xr −Xr S− Xr −Xr
; for all
i = 1, 2, … , n.
c. Sort these squared distances in increasing order d. Define Hnew =
{
Xπ( )1 ,Xπ( )2 , ,Xπ( )h}
r r r
L
e. Calculate XHnew
r
, SHnew and
( )
2new
H
d i .
f. If det
(
)
0 newH
S = , repeat steps 1 – 5. If det
(
)
newH
S =
( )
det SHold , the process is stopped. Otherwise, the
process is continued until the k-th iteration if
( )
det SHk = det
( )
SHk+1 . So we get det( )
SH1 ≥( )
2det SH ≥ . . . ≥ det
( )
SHk = det( )
SHk+13.Find the interval of reference spectral of vegetation area through a 95% confidence interval for a distance of robust Modified MVV
called ‘vegetation’ if the distance is in a 95% confidence interval of the Modified MVV distance.
IV. HOW IS THE PERFORMANCE OF MODIFIED MVV
A. The Consistency of Modified MVV Estimator
The estimator is a measurable function of the data that is used to infer the value of an unknown parameter. An estimator for a parameter is consistent if the estimator converges in probability to the true value of the parameter, Kendal and Stuart [12]. Consider an estimatortn, computed
from a sample of n values, will be said to be a consistent estimator if there is some N such that the probability that
tn− <θ ε (1)
Is greater than
(
1−η)
for alln N> . In the notation of the probability theory,{
n}
1P t − <θ ε > −η n>N
(2) for any positive ε and η however small
The formulate (2) means that the distributions of the estimators become more and more concentrated near the true value of the parameter being estimated, so that the probability of the estimator being arbitrarily close to θ converges to one.
To clarify the statement, we do the experiment with 100 replication. The multivariate normal of N25
(
μ ∑,)
r
[image:4.612.306.534.285.385.2]generates (whereμ =r 0r; ∑ =I25 andn=1000). The contaminant data appear in a data set beginning 1% and gradually to be higher; i.e. 2%; 3%, 4% and so on till 10%. The consistency of two estimators from two different aproaches; Modified MVV and Classics estimator; are computed.
TABLE I
The Consistency of Modified MVV, for p=25
Contaminant Consistency_Modified MVV
Consistency_Classics
10 0.902252607 0.655117921 20 0.908089528 0.522599103 30 0.902023423 0.501320706 40 0.904249 0.500032285 50 0.907906261 0.500000283 60 0.904149167 0.500000001
70 0.901021353 0.5
80 0.903928779 0.5
90 0.90334757 0.5
[image:4.612.336.516.457.586.2]100 0.902258204 0.5
Figure 3. The Consistency of Modified MVV, for p=25
Two descriptions above, Table I and Fig. 3, state that estimator of Modified MVV is a consistent estimator.
B. The Computational Time of Modified MVV
One major of motivation outlier detection research is to efficiently identify outlier, Angiullia and Pizzuti [5]. The research focused on computational time is the important topics in robust statistics and detection outlier.
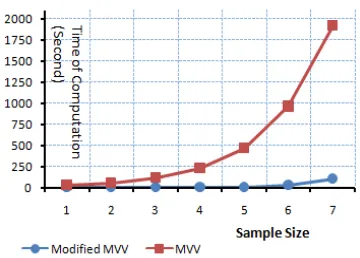
The efficiency of two methods; the Modified MVV and the MVV; are compared in this Section. Regarding with the aim, we generate the multivarite normal N25
(
0,I25)
r
with 5% contaminant data. To have the efficiency and effectiveness of those methods, the experiments are replicated on 100 times and the sample size is gradually increased ; that is begining n=500 until n=32000. All of the experiments demonstrate that the contaminant data are identified well but the computational times are different. The comparisonis listed in Table 2.
TABLE II
The Comparison of Computational Time Modified MVV and MVV
No Experiment
Sample Size
Modified
MVV MVV
1 500 0.171 28.8315
2 1000 0.33739 57.4498
3 2000 0.7510 114.9694
4 4000 1.9731 230.4307
5 8000 6.94814 463.0770
6 16000 26.8368 961.3965
7 32000 108.1513 1.92E+03
Fig. 4 shows clearly the difference of running time Modified MVV and MVV. For the larger sample size, we see the computational time of MVV is going to be increased, but the time is relatively stable for the Modified MVV.
Figure 4. The Comparison of Computational Time (Second) for Two
Approaches
C.The Breakdown Point of The Modified MVV
[image:4.612.66.294.459.718.2]becomes
( )
*X
n
T if the value of
m
data are changed. The breakdown point of sample of size shows n as follows,(
)
( )
( )
( )
*
* *
X
, min sup X X infinite 3
n n n
m
T X T T
n
ε = ⎧⎨ − ⎫⎬
⎩ ⎭
r
To investigate the resistance of modified MVV estimator, we do simulation with 1000 replication of
1 30
n = multivariate normal N3
( )
0,Ir
, the contaminant 2
[image:5.612.314.556.48.180.2]n will be added , it is started n2=0till the estimator breaks (consider n2=k). The following figure tells us that the MVV estimator is robust and high breakdown point
Figure 5. The Breakdown Point of Modified MVV
V. THE CLASSIFICATION OF JAKARTA VEGETATION AREA The classification process on the vegetation and no vegetation area is discussed in this section. There are two steps; the training and testing steps for classification.
A. The Training Step
The goal of traing step is to have the spectral reference of the vegetation area. Regarding of the goal, we crop the vegetation area in size
(
30 30×)
. The following figure is the example of crop of channel 3, 4 and 5 in actual size on the year 2000.Figure 6. The example of cropping vegetation area in channel 3,4 and 5
The Modified MVV is used to define the digital number of spectral reference of vegetation area. The 95% confidence
interval of vegetation is 4.234229084 < vegetation 16.81448141< . The interval is
useful for the vegetation reference of classification.
B.The Classification Step
The classification of Jakarta vegetation area on the year 2000 is figured out in Figure 7.
The figure is scaled around 1:300 to the original figure from Landsat - 7.
[image:5.612.98.273.241.348.2]Figure 7. The Classification of Vegetation Jakarta Area on The Year 2000
Fig. 7 illustrates the vegetation and the non vegetation of ‘main’ Jakarta with a rectangular shape. Based on the figure, the vegetation area of Jakarta is only 7.73%. The percentage is quite far to the Law determining the percentage of opened space (vegetation land and barren land) for big cities in Indonesia; 30%.
How is the green or vegetation of Jakarta on the year 2002? The Jakarta Governor made the effort to increase the percentage of green area. He wanted to reach the green area into 13% on the year 2010. Will the goal of Governor be able to be realized?. The following figures are the result of classification on the year 2002 and 2006.
[image:5.612.313.545.361.490.2]Figure 8. The Classification of Vegetation Jakarta Area on The Year 2002
Figure 9. The Classification of Vegetation Jakarta Area on The Year 2006
Related with the classification on the year 2002, we compute that the percentage of vegetation is higher than the percentage on the year 2000, that is 8.1 %.
[image:5.612.313.544.516.657.2]The statement is based on the result of classifying vegetation on the year 2006. The classication calculates that the percentage of green is 6.21%. That percentage is smaller than the percentage on the year 2002 and the year 2000.
VI. REMARK
The Modified MVV is the reliable method for classification of large data with noise. We evaluate in two conditions; the process computation and the result of classification.
The first evaluation, the computational time of Modified MVV for training and classification is around 70 minutes. The time is different with the computational time of MVV. In the experience of MVV computation, we need more than 12 hours to finish one classification.
The second evaluation, the Modified MVV is realible method for classification. We evaluate four changing areas, the usage of area is not different to the result classification.
REFERENCES
[1] Angiulli, F. and Pizzuti, C.: Outlier Mining and Large High-Dimensional Data Sets, IEEE Transaction on Knowledge and Data Engineering, Vol. 17, No 2, 203-215 (2005)
[2] Billor, N., Hadi, A.S. and Velleman, P.F.: BACON: blocked adaptive computationally efficient outlier nominators, Journal of Computational Statistics and Data Analysis, 34, 279 -298. (2000) [3] Djauhari, M.A.: Improved Monitoring of Multivariate Process
Variability, Journal of Quality Technology, Vol. 37, No 1, 32-39 (2005)
[4] Grubbs, F.E.: Procedures for Detecting Outlying Observations Samples, Technometrics, 11, 1-21 (1969)
[5] Hadi, A.S.: Identifying Multivariate Outlier in Multivariate Data, Journal of Royal Statistical Society B, Vol. 53, No 3, 761-771 (1992) [6] Hampel, F.R., Ronchetti, E. M., Rousseuw, P.J. and Stahel, W.A.:
Robust Statistics, John Wiley , New York, (1985)
[7] Hawkins, D.M.: The Feasible Solution Algorithm for the Minimum Covariance Determinant Estimator in Multivariate Data, Journal of Computational Statistics and Data Analysis, 17, 197-210 (1994) [8] Herwindiati, D.E., Djauhari, M.A. and Mashuri, M.:Robust
Multivariate Outlier Labeling, Journal of Communication in Statistics – Simulation And Computation, Vol. 36, No 6 (2007)
[9] Hubert, M., Rousseeuw, P.J. and vanden Branden, K.: ROBPCA: a New Approach to Robust Principal Component Analysis, Journal of Technometrics, 47, 64-79, (2005)
[10] Irwin, J.O.: On a Criterion for the Rejection of Outlying
Observations, Journal of Biometrics, Volume 17, No (3/4), 238-250 (1925)
[11] Kendall, S.M. and Stuart, A.: The Advanced Theory of Statistics, Charles Griffin & Co Ltd, Vol. 2, Fourth Edition, London (1979) [12] Natural Resources Canada: Fundamental of Remote Sensing, 28
January 2010, Available : http://www.ccrs.nrcan.gc.ca/index_e.php [13] Rousseeuw, P.J.: Multivariate Estimation with High Breakdown
Point, Paper appered in Grossman W., Pflug G., Vincze I. dan Wertz W., editors, Mathematical Statistics and Applications, B, 283-297. D. Reidel Publishing Company (1985)
[14] Rousseeuw, P.J. and van Driessen, K.: A Fast Algorithm for The Minimum Covariance Determinant Estimator, Journal of Technometrics, 41, 212-223 (1999)
[15] Rousseeuw P.J. and Leroy, A.M.: Robust Regression and Outlier Detection, John Wiley, New York (1987)