178
A NEW METHOD OF MEASURING THE ACTIVITY
OF SPERMATOZOA
BY LORD ROTHSCHILD
From the Department of Zoology, University of Cambridge
{Received 28 October 1952) INTRODUCTION
A new method of measuring the activity of spermatozoa 179
mean speed and distort the distribution of sperm speeds, if this is of interest. It also creates serious problems for the person plotting the positions of the sperma-tozoa, as difficult decisions have continually to be made. The uncertainty can of course be obviated by using sufficiently high film speeds, but this increases the labour of plotting and the cost of the experiment.
[image:2.595.146.449.296.515.2]The object of this paper is to describe a new and quantitative method of esti-mating the mean speed of a sperm suspension of any density, the estimate having a known precision.* The method is based on the principle known as probability-after-effect, which is described in some detail in Chandrasehkar's review, 'Sto-chastic problems in physics and astronomy' (1943). Little attention has hitherto
Fig. 1. a, positions of three spermatozoa on consecutive cinematograph frames, b, alternative routes by which two of the three spermatozoa could get from their positions on the first frame to their positions on the second. There is no chance of a mistake in the case of sperm i as it is swimming in the opposite direction to sperms 2 and 3.
been paid to the precision of the method, without which it is of limited interest. The principle of probability-after-effect can be roughly described as follows. Suppose we examine two suspensions of particles or organisms, A and B, and that the particles in A are 'frozen' so that they do not move. The average speed of the particles in A is therefore zero. The particles in B are not 'frozen' and move about. If a small region in A is observed at times tx and t2, the number of particles in that region will be the same. This will not be the case in a small region in B, because some particles which were outside the region at ^ may be inside at t2, while some which were inside the region at t± may be outside at t2. The numbers
180 L O R D R O T H S C H I L D
entering and leaving the region will not necessarily be the same. We can say that in the case of system A, the number of particles in the region at tx is completely ' correlated' with the number in the region at t2. In the case of system B, the number of particles in the region at tx will be partly correlated with the number in the region at t2, because particles have entered and left the region in the time interval (tv t2). If the time interval between observations were made sufficiently long, the correlation between the numbers would be zero. The fluctuations with time in the number of particles in the region under consideration is clearly some function of the speeds at which the particles move (actually the mean speed of the particles). Consequently, the mean speed should in principle be determinable from the observed time fluctuations in the number of particles.
When estimates of mean speed are made by the probability-after-effect method of analysis, the experimental procedure is to place a suspension of spermatozoa on a microscope slide and photograph it at given time intervals. The number of spermatozoa in a region of known area is then counted, on each photograph. The mean speed of the suspension can then be estimated by means of a few simple calculations.
THEORY
Random movements of spermatozoa. In its simplest form, the theory requires that the directions of movement of the spermatozoa should be random. If this is so, the spatial distribution of spermatozoa in the suspension will also be random. It can be shown (Appendix, i) that in such circumstances, the number of sperma-tozoa in a small region within the suspension will fluctuate Poisson-wise, provided that the sperm counts are made at sufficiently long time intervals (see later). In other words,
Pr{x} = ^nXe~n (x = o, i, 2, 3,...), (1)
where Pr{x} is the probability of there being x spermatozoa in the region and n is the average number of spermatozoa in the region.
Probability-after-effect. Let the number of spermatozoa, n, in a region of known area be n±, n2, n3, ... in successive photographs taken at equal time intervals h> h' h> •••• Le t I W2~wi I =§ i , I "3 —W21 =§2> ••• a nd h+i~U=T- Then it can be shown, Appendix, 2, that
= 2E{n){i-e-^), (2) where 2?(82) = the expected value of S2, E(n) = the expected value of n, and A is a parameter which includes the average or mean speed, c, of the sperm suspen-sion.
In practice, equ. (2) becomes
82 = 2w(i-e-A T), (2.1)
A new method of measuring the activity of spermatozoa 181
frequency (Rothschild, 1952), it can be shown (Appendix, 4), that if the region under examination is a rectangle with sides x' and y', a square with side x', or a circle of radius r,
x_2c(x'+y') ' nx'y' '
*=—„ (3)
A=— •nr'
These relationships are derived in Appendix, 3.
Correlation. In the section entitled 'Random movements of spermatozoa', reference was made to the numbers of spermatozoa in a small region being dis-tributed Poisson-wise, provided counts are made at sufficiently long time intervals. Suppose that consecutive counts have a short time interval between them so that the spermatozoa move a small distance in that time interval. Assume, for example, that at tx, the number of spermatozoa in a square with side ioo/u. is counted, and at t2,1/24 sec. later, the number in the same square is counted again. Assuming a mean sperm speed of 120/x/sec, each spermatozoon will on the average move 5/x in 1/24 sec. As a result, few of the spermatozoa within the square at tx will have swum out by t2) and few will have swum into the square in the interval (tv £2). In such a case the numbers will not fluctuate
Poisson-wise, and the joint distribution of consecutive observations will be a bivariate correlated Poisson distribution in which
where corr (n1; w2) is the correlation coefficient of nx and n2 in this system. The derivation of equ. (4) is given in Appendix, 5. This concept is important as we shall be concerned with the best value of corr (n^, n2), i.e. the value which maximizes the precision of estimates of c.
Precision of estimates of c. Denoting e~Ar by x and the number of sperm counts made on different frames by k, the variance of c, V(c), is given by
Tr/-\ c2 (n(i—xY (3+x) V(c)= , . . rj< — — 'v ; y\
kn(xlog
exf\
( i + x )The derivation of equ. (5) is very complicated, and so as not to overweight this paper with mathematics, it will be published elsewhere.* This equation enables one to calculate the value of T, the time interval between photographs, which gives maximum precision for any particular k or n in the region under examination. As regards the latter, if the area of the region is reduced, the average number of
• In deriving equ. (5), the probability-generating function of nt given nx,
exp-{n(i -s) (i-x)} {1 -(1 -s) x}\
l 8 2 LORD ROTHSCHILD
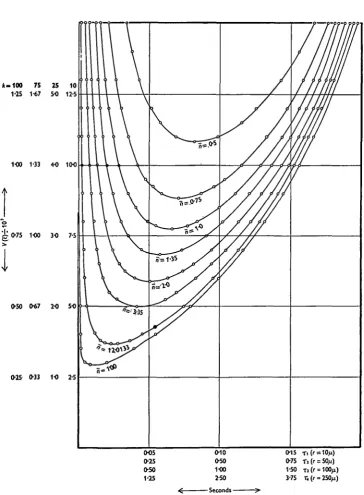
spermatozoa in it will also be reduced, and vice versa. Fig. 2 shows a set of curves derived from equ. (5). If this equation is written
Jc=1OO 75 25 10
120 1-60 4-8 12-0
1-00 1-33 4-0 1tK)
0-80 107 3-2 8 0
•I-I
0-60 08 2-4 6 00-10 0-53 1-6 4 0
0-20 0-27 0-8 2 0
0-4 06 08
Fig. 2. Relationships between V(c), the variance of an estimate of c (assumed to be 110-5 ji/sec.) and * = e~AT, for different values of n, the average number of spermatozoa counted. Four V(c) scales are given, appropriate to the cases where k= 10, 25, 75 and 100.
A new method of measuring the activity of spermatozoa 183
A =10, 25, 75 and 100, are given in Fig. 2. In this case, for reasons that will be apparent later, c was taken as 110-5 Wsec- By laying a ruler horizontally across the curves in Fig. 2, at some particular value of V{c), experimentally convenient values of n, k and T ( = — i/A loge x), corresponding to that variance, can be selected. For
example, if a variance of 1000 is required, k= iOo, n= 100 and # = 0-337 o r °'999; or &=ioo, « = 2 and # = 0-365 or 0-915. We can, in fact, draw a system of iso-variance curves or 'isologs', from which the values of n, k and T corresponding to any particular variance can be readily obtained. These curves are given in Fig. 7, which it is convenient to put in the section entitled 'Practical considerations'. The curves relating V(c) and T at different levels of n are also instructive and are given in Fig. 3.
Loss of information. Previous workers on probability-after-effect do not seem to have realized that if one only observes the number fluctuations in successive pairs of observations, a significant amount of information is lost. The point is best made by means of a diagram. Fig. \a refers to the case where a comparison is only made between successive pairs of counts. But a comparison of the numbers in frame 1 and those in frames 3, 4, 5, ... (Fig. 4^) provides further information, using the method of Maximum Likelihood. There is yet another source of loss of information. Both in Fig. \a and b, comparisons are made between the numbers at different times in the same region in the suspension. But apart from the temporal relationships to which reference has been made, spatio-temporal relationships also exist; these can provide further information, a point which is made in Fig. \c. The extraction of this additional information presents formidable mathematical difficulties. I hope to examine these questions later, with Dr H. Ruben.
EXPERIMENTAL PROCEDURE
Bull semen was diluted 1/4 with phosphate buffer (o-6 g. KH2PO4 and 6 g.
NagHPC^ in 300 ml. water) containing 5 mg. fructose/ml. A drop of this diluted semen was placed on a microscope slide and a no. 1 cover-slip (f x £ in.) was very gently placed on top of the drop. The size of the drop was so adjusted that after the cover-slip had been put on top of it, the drop spread just to the edges of the largest circle which could be inscribed on the cover-slip, without any pressure being applied. In these circumstances the spermatozoa swim actively in a particular lamina of fluid between the lower surface of the cover-slip and the top surface of the microscope slide.* This point is important, as the analysis involves considera-tions similar to those used in the kinetic theory of gases, but in two, not three, dimensions. If, therefore, the field examined under the microscope were a cylinder rather than a disk, the theoretical foundation on which the method is based would be wrong, for reasons shown pictorially in Fig. 5. This does not mean that a three-dimensional system cannot be used in other types of experiment, but that the formulae used in this paper would have to be altered.f
• The fact that spermatozoa swim 'best' in particular laminae in the suspension is an interesting phenomenon for which, at present, there does not seem to be any obvious explanation.
f In the case where the region under examination is a cylinder of height h as in Fig. 56, the only alteration is that equ. (3) becomes A = - ( - + - | .
z\r hi
LORD ROTHSCHILD
fc-100 75 25 10 1-25 1-67 5-0 12-5
1-00 1-33 40 100
I
0-75 100 3-0 7-5
0-50 0-67 20 50
0-25 0-33 1O 2-5
005 0-25 0-50 1-25
0-10 0-50 1O0 2-50
0-15 0-75 1-50 3-75
Seconds
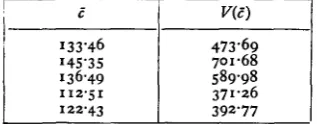
-Fig. 3. Relationships between V(c) and T ( = — i/A log,, x) at different levels of n. Four V(c)scales, appropriate to k= 10, 25, 75 and 100, are given. The four T scales, T,, T,, T3 and T4, correspond
[image:7.595.116.481.159.655.2]A new method of measuring the activity of spermatozoa 185
1 2 3 4
\
[image:8.595.116.482.126.488.2]V
Fig. 4. Three possible ways of comparing the numbers of spermatozoa in selected regions on consecutive frames. A curved line with an arrow on it is a comparison: a, the method used in these experiments; b, the same as a, but region i is compared with regions 2, 3, 4, etc., region 2 with regions 3, 4, etc., and so on; c, other combinations of comparisons are made between subregions on different frames.
Fig. 5. a, spermatozoa 'bombarding' a circle of radius r. The bombardment frequency is 2dcr, where d is the number of spermatozoa per unit area, b, spermatozoa 'bombarding' a cylinder of radius r and height h. The bombardment frequency is \DcTtr(r+h), where D is the number of spermatozoa per unit volume.
[image:8.595.126.468.543.660.2]186 LORD ROTHSCHILD
A cine-film was then taken of the suspension, using a x 18 phase-contrast objective, and a x 10 ocular. The cine-camera was an Askania 35 mm., with the shutter aperture set at 450, running at 25-8 frames/sec. The light source was a Point-o-Lite with one Chance heat filter between it and the microscope. In the experiment described in this paper, the suspension was photographed for 20-2 sec, which is equivalent to 521 frames.
All operations were carried out at 370 C. The overall magnification (1590 after projection of the film) was such that the field photographed was a rectangle with sides 337 and 255 /n. When plotting the positions of spermatozoa, or counting them, this rectangular field was subdivided into twenty subrectangles each with sides 67-4 and 6ySfx.
RESULTS
Random movements of spermatozoa. As mentioned in the section entitled 'Theory', if the spermatozoa move in random directions, their spatial distribution will be random, in which case the numbers in the field will fluctuate Poisson-wise. This will only apply provided the positions of spermatozoa in the fields under examination are uncorrelated, i.e. provided corr (nlt n2) is small, say 0-05 or less. The time interval between counts which provides a correlation of 0-05 or less can be calculated for a region of any desired size. In these experiments each frame was divided into twenty subframes or rectangles with sides 67-4 and 63-8/x. Assuming an average sperm speed of 125/n/sec,
/ x >T i 250(674 + 638) \ . , ,
corr (Mi, ni + l ) = ^ = e x p - |3. /4;6 (^4 ) (33/8 ) T) (6)
If e~Ar is to equal 0-05, T must equal 1-23 sec. The film speed being 25-8 frames/sec, every 30th frame will have a sufficiently low correlation to allow the numbers of spermatozoa in each subframe to be examined for a Poisson distribution. If the numbers of spermatozoa in the twenty subframes fluctuate Poisson-wise, the numbers in groups of subframes, for example, in whole frames, will also be Poisson-distributed (Fisher, 1948); but if a whole frame is examined, A, which inter alia is a function of the frame size, and therefore of corr (n^, ni+1), will have different values from those applicable to the subframe case. To test, therefore, for random movement, we select frames sufficiently far apart in time to examine whole and subframes for a Poisson distribution of sperm numbers. A simple calculation similar to that done above for subframes shows that if whole frames as well as subframes are to be examined, T = 4 - 6 sec. and every 118th frame may be selected. The actual numbers of spermatozoa observed in such an experiment are given in Table 1. The calculations show that the directions of movements of the sperma-tozoa are random. As mentioned above, it follows automatically that the sperm numbers will fluctuate Poisson-wise in whole as opposed to subframes, and this can easily be verified by the use of Fisher's dispersion index
A new method of measuring the activity of spermatozoa
^>r the relationship 1 + 2
l 87
where v is the number of observations, in this case 5. The numbers relevant to whole frames are given in Table i, in the horizontal column which starts with a 2. Substitution of the appropriate values in these two equations shows that
[image:10.595.126.480.264.605.2]making P = o-5-o-7, and 2-5811 >o-726i > —0-5811. Table 1. Number of spermatozoa
Frame no. Subframe no. 1
2 3 4 5 6 7 8 9 1 0 1 1 1 2 13 14 IS 16 17 18 19 2 0
s
2 5 5 5 4 8 7 7 6 6 6 11 6 3 5 4 3 3 1 0 13 31 2 0
119 6 1 0 6 5 9 3 8 7 4 5 6 9 3 7 S 9 8 6 8 3 127 in frames 237 i s 7 3 8 7 8 6 4 7 1 1 6 7 6 4 3 14 1 1 1 8 9 145 and subframes 355 9 2 5 8 5 9 6 7 4 6 9 7 5 0 3 13 4 6 8 13 129 473 9 7 9 6 7 4 7 4 8 6 11 5 5 6 7 6 3 9 1 0 9 138
No. of sperm per subframe No. of subframes
with that number, o Expected no. of
that numer, e
o-3 14 10-5806 Subframe 1 4 9 10-7979 5 1 2 14-2316 inalysis 6 18 15-6306 7 14 14-7225 8 1 0 12-1284 9 1 1 8-8804 10—00 1 2 13-0280 P=o-7-o-8
These observations show that in these conditions, the movements of spermatozoa are essentially random. If the suspension exhibited much orientation, or if a significant number of spermatozoa in the suspension swam in circles, the'Poisson-distribution tests would fail and it would be necessary to attempt more recondite methods of analysis.
i88 LORD ROTHSCHILD
quantity. Accordingly, the 25-8 frames/sec, cine-film was projected frame by frame on to squared paper and the outline of the head of each spermatozoon was drawn in. The consecutive positions of each head were then joined by straight lines and their lengths measured, from which the speeds of each spermatozoon were calculated. At this film speed and with the magnification used, 1590, the ambiguities about the consecutive positions of particular spermatozoa mentioned earlier did not arise. Mr M. J. Hubbard and Miss G. E. Bending, a research
0-4
0-3
sf/h
0-2
0-1
60-5 80-5 100-5 120-5 140-5 160-5 180-5 200-5 220-5 < Speed (ju/sec.) > '
320-5
Fig. 6. 1, sperm speed histogram and frequency polygon; 2, normal distribution with the same mean and standard deviation; 3, mean; s, standard d e v i a t i o n ; / , relative frequency; h, cell width. Total n u m b e r of sperm tracks measured, 433.
A new method of measuring the activity of spermatozoa 189
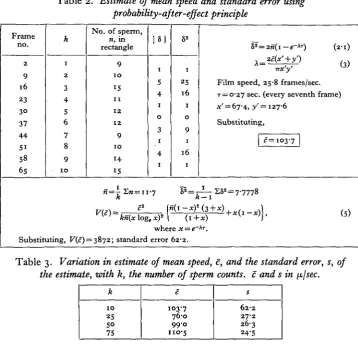
[image:12.595.117.476.242.588.2]Mean speed by probability-after-effect method. To illustrate how calculations are performed, we shall examine the number of spermatozoa in a rectangle with sides 67-4/1 and I2y6/x in the middle of every seventh frame, using frames 2, 9, 16, 23, 30, 37, 44, 51, 58 and 65 for this purpose. This means that k in equ. (5) is 10, which is too low for reasonable precision but convenient for explaining the method. The procedure is shown in Table 2. The estimate of the mean speed
Table 2. Estimate of mean speed and standard error using probability-after-effect principle Frame no. 2 9 16 23 3° 37 44 51 58 65 i 2 3 4 5 6 7 8 9 10
No. of sperm, n, in rectangle 9 10 15 11 12 12 9 10 14 15 181 25 16 1 o 9 1 16 1 (2-1) (3)
Film speed, 25-8 frames/sec. T = O-27 sec. (every seventh frame) *'= 67-4,3;'= 127'6
Substituting, = 103-7 k 2 = 7-7778 Substituting,
kn{x log, x)2
where x = ; standard error 62-2.
(5)
Table 3. Variation in estimate of mean speed, c, and the standard error, s, of the estimate, with k, the number of sperm counts, c and s in [i/sec.
k 10 25 50 75 c 103-7 76-0 9 9 0 110-5
6 2 2 27-2 26-3 24-5
190 LORD ROTHSCHILD
and arise because, for small k, the distribution of the estimate of c departs from normality.
[image:13.595.219.378.292.354.2]Homogeneity. If the probability-after-effect method of measuring the mean speed of a suspension is used in a series of experiments, it is of course important to establish that the sampling procedure is satisfactory. 'Sampling procedure' refers to everything that happens between collecting the original ejaculate and estimating the mean speed of the test suspension. Suppose, for example, that we estimate the mean speeds of spermatozoa in five subsamples, derived by 'identical' Table 4. Estimate of mean speed, c, and variance, V(c), in five subsamples taken
consecutively from one sample of semen diluted 1/4 zvith fructose phosphate buffer
c
133-46 '45-35 13649 112-51 122-43
V(c) 473-69
701-68
589-98
371-26 392-77
methods from a parent sample (Table 4). If the sampling procedure is satisfactory, these five mean speeds should be mutually consistent and this can be subjected to quantitative verification. The best joint or pooled estimate of c from the data in Table 4 is
(9)
c'=
where Ii=i/V(ci). is distributed as x2 on four degrees of freedom,
l
and substitution of the values in Table 4 shows that x\=l'34 from which P lies between 080 and 0-90. This means that there are inadequate grounds for rejecting the hypothesis that the five estimates of mean speed were obtained from one
parent sample; in other words, the subsampling procedure was satisfactory. PRACTICAL CONSIDERATIONS
As this method of estimating the mean speed, i.e. the true activity, of a sperm suspension may be of some practical interest, the details of making measurements and estimating mean speeds from them are summarized in this section.
(1) Take a cine-film of the sperm suspension, preferably but not necessarily diluted 1/4. The film speed should be between 5 and 10 frames/sec. Phase-contrast lenses should be used. A cover-slip should be gently placed on top of the drop of sperm suspension, as described in the section 'Experimental procedure'. Alter-natively, fragments of any innocuous material of suitable thickness can be placed between the cover-slip and the microscope slide to keep the depth of the suspension constant.
(2) Select a region of known area and perimeter in the microscope field (on the cine-film).
A new method of measuring the activity of spermatozoa 191
^ = 6^(x' +y')jx'y'. For a square with side x , A= 128/*'; and for a circle of radius r,A = 64/r.
(4) Divide up the field into about twenty subregions of equal area and perimeter and test whether the numbers of spermatozoa in these subregions are distributed Poisson-wise (as in Table i, p. 187), using frames which are t sec. apart, t having been determined in (3). Assuming that the Poisson distribution test is positive, proceed as follows.
(5) Select a region whose area is such that on the average it contains about ten spermatozoa. The size of the region depends on the microscope magnification, the sperm density and the method of projecting the film. If the semen contains about io9 sperm/ml, and is diluted 1/4, a rectangle with sides 70 and 125/u. or a circle with radius 50/i. will contain about ten spermatozoa.
(6) Count the number of spermatozoa in this region on k consecutive frames. If k = 75 and the average number of spermatozoa in the region is about ten, this will take some 2 hr.
(7) Calculate ft, the average number of spermatozoa in the region, and S2, the average of the square of the differences between the number of spermatozoa in regions on consecutive frames.
(8) If the region is a rectangle with sides x' and y', a square with side x', or a circle of radius r, the mean speed of the sperm suspension, c, is given by
S2\ 1 8*\ 2i»r •nx' I S2\
47 5c \ znj c= loge(i -),
2T be \ 2nJ
(IO)
where T is the time interval between successive photographs.
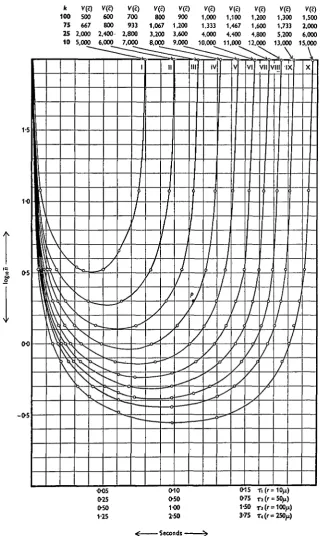
(9) The precision or accuracy of the estimate of c depends on the average number n of spermatozoa in the region of the field selected for examination, the time interval T between successive photographs, the number of photographs examined k, and the size of the region. These facts are illustrated in Fig. 7, which requires some explanation. Consider the curve labelled IV. Any point on this curve has associated with it a particular value of n and of rx. For example, the point P has co-ordinates n = 2 (the antilogarithm of 0-3), and rx = o-114 sec. All pairs of values of n and TX on this curve will provide estimates of c with the
k 100 75 25 10 v® 500 667 2,000 5,000 V(c) 600 800 2,400-6,000 V(e) 700 933 2,800 7,000 V® 800 1,067 3,200 8.000 V® 900 1,200 3.600 9,000 VCc) 1,000 1,333 4,000 10.000 V® 1,100 1,467 4.400 11.000 V(c) 1,200 1,600 4,800 12.000 V(c) 1,300 1,733 5,200 13,000 V(c) 1.500 2,000 6.000 15,000 -o-s 005 0-25 0-50 1-25 0-10 0-50 1O0 2-50
0-15 T i ( f 0-75 n ( r 1-50 Ti ( r
3-75 Tdr :10M)
= 100/i)
[image:15.595.138.459.115.652.2]< Seconds y
A new method of measuring the activity of spermatozoa 193
We must now consider how the variance changes with n and T. For the purposes of tabulating variances as in Fig. 7, it is convenient to consider circular regions. The four abscissa scales, rlt T2, T3 and T4, correspond respectively to
circular regions with radii 10, 50, 100 and 250/x.
The curves in Fig. 7 are based on a mean speed of no-5/n/sec. In practice, however, Fig. 7 should be used as a guide, which will save much time, to the conditions of the experiment. The actual variance relevant to an experiment
should be estimated by means of the equation
v ' kn(xlog
ex)2\ (i+x)
where x = e~Xr. There are, of course, many published tables giving the values of e~z for different values of z, from which C~AT can be quickly calculated.
(10) A simple method of testing the adequacy or inadequacy of the sampling procedure is given in the section entitled 'Homogeneity' on p. 190.
DISADVANTAGES OF THE METHOD
The main disadvantage is the expense involved in taking cine-micrographs as opposed to photo-micrographs. It is doubtful whether the size of the region examined can be increased sufficiently, by reduction of magnification, to make T suitable for ordinary photo-micrography. Figs. 7 and 3 are deceptive in this respect, as they superficially suggest that 5 sec. intervals between photographs might be achieved. This is not the case unless the sperm suspension is over-diluted. Whether the refinements outlined in the paragraph headed ' Loss of Information' on p. 183 will make it possible to have 5-10 sec. intervals between photographs, thus obviating the need for cinematography, is not yet known.*
APPENDIX
Fig. 8.
1. Consequences of the assumption of random movement
Let there be n spermatozoa in A (Fig. 8). If the movements of the spermatozoa are random, the probability that a particular spermatozoon will, at some particular instant, be in a, is equal to a/A. This statement implies random location of sperma-tozoa which is a consequence of their random movement.
194 L O R D R O T H S C H I L D
The probability Fi{x) that the number of spermatozoa observed in a at some instant of time will be x is given by
Let A->co and « -»• oo in such a way that the average number of spermatozoa per
unit area remains finite, i.e. lim — = k (& + o). Then
(n-*<n •**-\A-*-tD
r, i -. i /L x / ka\nl ka\-x , .
- * ^ A * e - \ A = ^a. (2-2) x is therefore distributed Poisson-wise with parameter ka, which equals the average number of spermatozoa in a.
2. Proof that E(82) = zE{n) (1 - e~XT)
(1) Let the number of spermatozoa observed in an area a be n^ at time tlt and n2 at time t2, where t2 — t1=r.
(2) LetWj —w2 = S.
(3) Let the probability that a particular spermatozoon, in a at time t, will leave in the interval (t, t + St) be XSt + o(8t).
(4) Let the probability that one spermatozoon will arrive in a during (t, t + St) Note. (3) and (4) imply that the spermatozoa do not drift or age.
(5) Let E(ri) be the average number of spermatozoa in a.
The average number of spermatozoa leaving a in St is XE(n) 8t, while the average number entering a in the same time is pSt. When the system is in
equi-l i b r i u m
A new method of measuring the activity of spermatozoa 195
'Since E(n
1) = E(n
2), Vfa) = E{n\) -E*fa), Vfa) = Vfa)
and corr fa, «2) = {£(n1n2)-£(«1) Efa)}j{Vfa) Vfa)f,
E(8*) =
2Vfa){i-corrfa,n
2)}. (
2)
If the number of spermatozoa in a is distributed Poisson-wise, Vfa) = Efa) = E(n)
and corr fa, n%) = e*1™, where k is a constant.* To determine k, consider an infinitesimal value of r, 8t, so that e~kT = 1 — k8t + o(St). Let nx and Wa be the number of spermatozoa present at t and t + St and />(%, n^) be the probability of these numbers. 8t is selected in such a way (i.e. so small) that the only values of pfa, w2) which are not zero are
pfa,n
1+ i)=pfa) uSt, ^
pfa,n
1-i)=pfa)Xn
18t, \ (3)
pfa, nj =pfa) {1 - (/* + H ) &}• J
iVofe. For fixed 74, the average number of spermatozoa leaving a in §t is Xr^St, while the average number entering a is /i8f. Hence the probability of none entering and none leaving a in St is 1 — (/x+Awj) S*.
Using equs. (1) and (3),
Efan2) = - XE(n) St + E(n) + E\n). (4) As in a Poisson distribution
corr fa, W2) = {£(nl W 2)-£»}/£(*)• (5)
From equ. (4) corr (%, M2) = I — AS*. (6)
But corr (^, n^ = c"*7 =i-k8t.
Hence £=A and £(82) = z£(n) (1 - e~^). (7)
Consider a spermatozoon initially within a. Divide the time interval t, t+r into N subintervals of length r/iV. The probability (1 — P) that the spermatozoon will remain within a, throughout the interval under consideration, is
= ^ . (8)
Hence £(82) = 2E(n) P, (9)
where P is the probability that a spermatozoon will have left a during the interval, but may be back again in a at the end of the interval. Chandrasehkar defines P in a different and slightly less accurate way. Mr D. V. Lindley, of the Statistical Laboratory, Cambridge, drew my attention to this point.
3. Meaning of X
Let Y= number of spermatozoa arriving in a in 8t, Y taking values o, 1, 2, .... If 8t is sufficiently small, Pr (Y= 1) = u.8t (1)
196 L O R D R O T H S C H I L D
Pr{Y=m}, m^2 being neglected,
r
(3)(3-0
E( Y) is the average number of spermatozoa arriving in a in St. But from kinetic
theory, the average number of spermatozoa which collide with the periphery of a, i.e. arrive in a, in S< is „« , , ,
Zbtl, (4)
where Z=dc\-n and / is the length of the periphery of a. d is the number of sperma-tozoa per unit area.
Hence (i8t=Z8tl, (5)
or p-ZL* (5-1) Suppose a is a rectangle with sides x' and y'. Then
l=2(x'+y') and p = zdc(x' +y' )jir.
NowA = /x/v, where v=dx'y'. Then
2c(x'+y') X
- nx'y' ' ( 6 )
or, in the case of a square, X = —,. (6-i)
If a is a circle of radius r, A = —. (7)
•nr w
4. Collision frequency in two dimensions
Consider a cm.2 of a suspension of moving spermatozoa. Each spermatozoon has a velocity vector associated with it and each spermatozoon will have a repre-sentative point in velocity space with rectangular coordinates cx, cy. An element
of area, surrounding a typical point c in velocity space, is denoted by 8c. The points in velocity space will have a particular density, /(c), which in general will vary from point to point and time to time. The number of points in 8c will be /(c) 8c. If instead of a unit area we start with an element of area 8r, the number of points in 8c will be/(c) 8c 8r. In 8c there will be/(c) 8c Sr spermatozoa with velocities in the velocity class 8c. The relationship between the velocity space density and the spermatozoa's speed frequency function g(c) is, for unit area and an annulus 8c of width 8c,
/(c) 8c = dg(c) 8c, (1)
where d= number of spermatozoa per unit area. Equ. (1) can be written
A new method of measuring the activity of spermatozoa 197
Consider an infinitesimal element of length ds, with spermatozoa moving through
ds, with velocities in the velocity class Sc. The number of spermatozoa of class Sc
in a strip of area ds cos ipcdt will be
/(c) dsc cos </r dt dc (2)
=/(c) dscn dt dc, (2-1)
where cn = component of c in the direction perpendicular to ds and Sr = ds cos ipcdt.
The number of spermatozoa N of all classes passing from one side of ds to the other, in the same direction (i.e. cn > 6), is
N=dsdt f f(c)cndc. (3) Jcn>l
Making cn identical with cy,
N=dsdt
J<v>o
J c ^ > 0 27TC
In polar co-ordinates
N=ddsdt r» /•'
27T
f f{c)c
vdc (3-1)
J<v>o
f
Jo JO
The number of spermatozoa passing through unit length in unit time (from one side to the other) is therefore
^ (4)
dc
'•-• (4-I)
5.
Let Wj, M2, n3 spermatozoa be observed at t, t + tt, t + t-^ + t^. Let p{n1 \ n2)
denote the probability of nx at t, given n2at t + tx (and other expressions similarly,
e-g-/>(«3 |«2,«i))- Then
/>(«3 I «2)=/»(«3 I «2. «l) ( 0 and Eiji^ru^ \ w2), the average of ^Wa for fixed ra2,
Ws I "2) (2)
). (3)
Hence the partial correlation coefficient of ru^ and % for fixed n2 is zero and by
standard formulae for partial correlation coefficients,
corr (%, ng) = corr ( ^ , w2) corr (M2 , %), (4)
198 L O R D R O T H S C H I L D
The implication of equ. (1) is that once n2 w known, n^ has no predictive value in
relation to n^. This is known as the Markov property (see, for example, Bartlett, 1950).
Let g(t) be the correlation coefficient of a system of spermatozoa at two times, t apart. Equ. (4) can be written
g{h + h)=g{h)g{h), for all ^ and ^ £ 0 . (5) The only solution of this equation with g(o) = 1 and g{t) ^ 1 is
e-*K (6)
SUMMARY
1. A new and quantitative method of estimating the average speed of a suspension of spermatozoa has been developed. The method, in which the phenomenon known as probability-after-effect and kinetic theory principles are made use of, can be applied to any system of organisms which move in random directions, in one, two or three dimensions.
2. The experimental procedure is to place a drop of sperm suspension on a microscope slide with a cover-slip on top of the drop, and photograph the sperma-tozoa at known time intervals.
3. The number of spermatozoa in a region of known size is counted on each photograph. The estimated mean or average speed of the sperm suspension, c, is given by the equation
where r is the radius of a circular region in which the number of spermatozoa is counted, T is the time interval between photographs, S2 is the average of the square of the differences between the numbers of spermatozoa counted on consecutive photographs, and n is the average number of spermatozoa in the circular region.
4. Appropriate formulae for non-circular regions and for the precision of estimates of c are given.
5. A method of testing whether the directions of movement of spermatozoa are random has been applied to bull semen diluted 1/4 with phosphate buffer con-taining fructose. The movements were found to be random.
6. The distribution of sperm speeds was determined and found to be somewhat skew and leptokurtic, with mean 123 //./sec. and standard deviation 39. If dead or motionless spermatozoa were included, the mean speed became 117 /xfsec.
7. Using the probability-after-effect equation given in (3), the mean speed of the suspension, including dead or motionless spermatozoa, was found to be i n /Li/sec, with a standard error of 24-5. The standard error and therefore the precision of the estimate is under the control of the experimenter.
A new method of measuring the activity of spermatozoa 199 I am greatly indebted to Prof. M. S. Bartlett for reading the typescript of this paper and making a number of important comments; also to the Medical Research Council for the provision of a laboratory assistant.
REFERENCES
BARTLETT, M. S. (1950). Recurrence times. Nature, Lond., 165, 727.
CHANDRASEHKAR, S. (1943). Stochastic problems in physics and astronomy. Rev. Mod. Phys.
15.
1-89-FISHER, R. A. (1948). Statistical Methods for Research Workers. Oliver and Boyd.
GRAVE, B. H. & DOWNING, R. C. (1928). The longevity and swimming ability of spermatozoa. J. Exp. Zool. 51, 383-8.
ROTHSCHILD, LORD (1950). Cytochrome-catalysis of the movements of bracken spermatozoids. Proc. Roy. Soc. B, 138, 272-7.
ROTHSCHILD, LORD (1951). Sea-urchin spermatozoa. Biol. Rev. 26, 1-27. ROTHSCHILD, LORD (1952). Spermatozoa. Set. Progr. 40, 1-10.
ROTHSCHILD, LORD (1953). A new method of measuring sperm speeds. Nature, Lond., 171,
512-513.
ROTHSCHILD, LORD & SWANN, M. M. (1949). The fertilization reaction in the sea-urchin egg. A
propagated response to sperm attachment. J. Exp. Biol. 26, 164—76.