Foreword
You are reading the first page of my report about packaging materials used at Impress. Some of you might know Impress as a producer of packaging materials, namely cans, and think that the cans will be the subject of this research. Wrong!
The subject of this research is the packaging materials used to transport the cans to the customer; it is about pallets, layer pads and frames. No big deal, you would think. That is what I thought at the beginning as well, but it turned out to be quit different.
A special department of Impress, called MEET, is responsible for the handling of the packaging materials for Impress facilities located in the Netherlands. In this report you can read about the costs of the packaging materials and about ways to reduce these costs. To be able to do my research, I received a lot of information from employees working at the department responsible for packaging materials. Therefore, I would like to thank all employees of the packaging materials department and especially R. Klunder, H. Feenstra and A. Dijkstra.
I would also like to thank my supervisors from the University of Twente, S. Morssinkhof and W. Bandsma for their help and support.
Last but not least I would like to thank P. Woodruff for improving the usage of the English language in this report.
I hope you will enjoy reading this report.
W. Diepenmaat
Management summary
This is a thesis report of a research conducted at a special department of Impress, namely MEET (Magazijn Emballage Expeditie Transport). MEET is responsible for the handling of packaging materials of Impress’ production departments located in the Netherlands. The goal of this research is to provide management of MEET with information about their current cost position and to identify options to reduce costs.
To be able to provide management of MEET with information about their cost position, the current process and current cost price calculation were analyzed. The current process was described with the help of flow charts.
The currently used cost price was calculated several years ago by an employee of Impress. Because of several shortfalls of this cost price calculation a new cost price per trip per type of packaging material was calculated during this research with the help of Activity Based Costing (ABC).
With ABC costs of MEET are first linked to activities executed at MEET and via these activities to the different types of packaging materials.
Data used to calculate the ABC cost prices was verified and the ABC cost price was compared with the current cost price and the current trip price.
While verifying the data used in the calculation it appeared that three types of packaging materials are sensitive to changes in input-parameters.
The current arrangement of activities and allocation of costs is considered reliable and valid.
The second part of this research is about the reduction of costs. Per activity options to reduce costs were identified. Per identified options the yearly savings the option generates and the needed investment were calculated.
For the fourteen options that generate savings the impact of the introduction of the option was also described. A difference was made between options that only have an impact on MEET and options that also have an impact on other departments of Impress or on customers.
The fourteen options were ranked with the help of two investment appraisal methods. The first investment appraisal method uses as main criterion the payback period, the second the Net Present Value.
Table of contents
Foreword... 2
Management summary... 4
Table of contents... 6
1. Research Project... 8
1.1. Impress... 8
1.2. MEET (Magazijn Emballage Expeditie Transport)... 8
1.3. Research Objective ... 10
1.3.1. Problem description ... 10
1.3.2. Research question ... 10
1.3.3. Scope... 11
1.4. Research approach ... 12
2. Theoretical Framework... 14
2.1. Data collection techniques ... 14
2.2. Process Flowchart ... 15
2.3. Costing Systems... 15
2.4. Investment appraisal methods... 18
3. The current situation ... 22
3.1. Physical flow of packaging materials ... 22
3.1.1. Customer deliveries ... 22
3.1.2. Exceptions... 24
3.2. Financial consequences for MEET ... 25
3.3. Current cost price... 26
3.4. Comments on the current cost situation... 28
4. Costs and activity identification... 30
4.1. Detailed description of costs occurring at MEET... 30
4.2. Activities... 33
4.3. ABC Step 1: Determination of the nature of cost elements... 35
4.4. ABC Step 2: Accounting for all traceable costs per activity ... 36
5. Activity traceable costs ... 38
5.1. ABC Step 3: Determination of cost drivers and calculation of activity recovery rates ... 38
5.1.1. Activity cost matrix... 38
5.1.2. Output measures... 41
5.1.3. Activity rates... 43
5.2. ABC Step 4: Compilation of a bill of activities for each cost object... 43
5.2.1. Cost objects... 43
5.2.2. Bill of activities per cost object ... 44
5.3. ABC Step 5: Calculate activity traced costs ... 46
6. Add direct costs and untraceable costs ... 48
6.1.1. Purchasing costs... 48
6.1.2. Rent buildings and costs of cleaning the department... 50
6.2. ABC Step 6b: Untraceable costs... 52
6.2.1. Management costs... 52
6.3. ABC Step 6c: Total costs per trip per packaging item... 55
7. Verification of ABC cost price ... 58
7.1. Verification of input-data... 58
7.2. Parameters that are likely to change in the nearby future... 60
7.2.1. Number of packaging materials that fit in a truck ... 60
7.2.2. External transportation costs... 61
7.2.3. Purchase price packaging materials ... 62
7.3. Comparing ABC cost price with current cost price and trip price... 63
8. Options to reduce costs ... 66
8.1. Options for the sorting activities... 66
8.2. Options for the cleaning activity... 68
8.3. Options for the reparation activity ... 69
8.4. Options for the transportation activities... 71
8.5. Options for the purchasing costs... 72
8.6. Options that influence all activities... 73
8.7. Overview... 74
9. Ranking of the identified options... 76
9.1. Impact of identified options ... 76
9.1.1. Options which only have an impact on MEET... 76
9.1.2. Options which also have an impact on other Impress departments or customers ... 77
9.2. Ranking based on Impress’ decision criteria ... 78
9.3. Ranking based on NPV... 80
9.4. Difference and similarities between the investment appraisal methods ... 82
Conclusion ... 84
Recommendations... 85
References... 88
Appendix A, Abbreviations and definition... 90
Appendix B, Quality groups of packaging materials... 92
Appendix C, Information flow of packaging materials ... 94
Appendix D, Tracing details ... 98
Appendix E, Estimating the number of trips a pallet can complete... 102
1. Research Project
This chapter provides some basic information about the organization where this research is executed and it describes the goal of this research and the research approach.
1.1. Impress
1Impress is an international can manufacturer that designs, makes and sells metal cans. Cans are produced in many shapes and sizes, in steel and in tinplate, in three piece and two piece construction and in stackable or nestable designs depending on the needs of the customer and the market.
Impress also produces can ends, partial aperture openings have been developed for liquid products such as evaporated milk. The range of Easy Peel® Ends brings added
convenience to an increasingly wide variety of products, both dry and processed. Direct Peel® ends provide cost effective solutions for dry powdered products.
All these cans and ends have to be transported to the customer with the help of packaging materials. In the Benelux, MEET (Magazijn Emballage Expeditie Transport), a 100% subsidiary of Impress, is responsible for the handling of packaging materials.
1.2. MEET (Magazijn Emballage Expeditie Transport)
The core products of MEET are packaging materials. MEET is a service department; its goal is to provide the production departments with packaging materials that fulfill the quality restrictions, at the right time and for the lowest costs. Furthermore, MEET, as a department, has a social function. Employees who are no longer able to do their current job are transferred, if possible, to MEET.
MEET is responsible for the handling of packaging materials of Impress’ production departments located in the Benelux. MEET has three sorting units located in Deventer, Leeuwarden and Hoogeveen.
Packaging materials of Hoogeveen are used to transport cans and ends produced for the diary industry. Packaging materials need to be clean and of high quality.
Hoogeveen uses therefore only the so called first quality packaging materials. Second quality packaging materials are used in Deventer. Here are cans and ends produced for the preserved food industry.
To transport the cans and ends to the customer, different types of packaging materials are used, like pallets, layer pads and frames. MEET uses more than 110.000 pallets,
1.800.000 carton layer pads and 90.000 frames, these packaging materials are used several times per year. 19 FTE’s are working at MEET to guarantee that there is always enough packaging material available for the production departments.
The packaging materials are inventories of MEET. The value of the assets was in 2007 €146.000, the value of the inventory was €1.700.0002. Because it is impossible to value each packaging material separately, it is assumed that on average the packaging materials are worth half of the purchase price. The value of the inventory is therefore 50% of the purchase price of the packaging materials times the number of packaging materials owned.
The costs occurring in the handling and purchasing of the packaging materials have to be paid by MEET. Income is generated by fees which have to be paid by the customer every time a packaging material is used for transport, the so called trip price. These customers have to return the packaging material to MEET.
If packaging material is transported to other facilities of Impress (the so called inter-company deliveries), the packaging materials are sold.
MEET can be considered as a revenue centre for Impress for two reasons. First, the management is held accountable for the number of packaging materials that are sorted and second, the management is also accountable for the sorting expenses, such as the wages of the employees, but these costs are only a small part of the total costs of manufacturing and selling the cans.
If MEET wants to invest, it has to request the investment officially. An investment budget has to be requested, this request is judged by a special department of Impress. The main criterion to appraise investment on is the pay back time of the investment.
1.3. Research Objective
1.3.1.
Problem description
The main reason for this research is that the total costs of the packaging materials used at Impress need to be reduced. A decade ago packaging material was of subordinated meaning for Impress. It had to be there when the production department needed it and the costs did not matter.
In recent years, however, new competitors have entered the market. Globalization gave competitors the possibility to enter the home markets of Impress. As a consequence, Impress needs to reduce its costs. MEET, as a 100% subsidiary of Impress has to reduce its costs as well.
1.3.2.
Research question
The problem described in section 1.3.1 leads to the following research question:
What are the current costs per trip for MEET per type of packaging material and
how can these costs be reduced?
To answer this research question, the following sub questions need to be answered. 1. What is the cost price of the different types of packaging materials per trip?
1.1. What is the physical flow of packaging material and how can it be described (section 2.2 and 3.1)?
1.2. Where in the flow of packaging material occur costs of MEET (section 4.1)?
1.3. What other costs does MEET make, like building costs or management costs (section 4.1)?
1.4. What are the different costing systems and which one should be used in this research (section 2.3)?
1.5. How can costs be assigned to packaging materials and trips (section 4.3 till section 6.3)?
1.6. How robust and reliable is the new cost price calculation (section 7)?
2. How can the costs of MEET be reduced?
2.1. Which possible options to reduce costs can be identified (section 8)?
2.2. What is the impact of these options on MEET, other Impress departments and customers (section 9.1)?
2.4. What are the different investment appraisal methods and which one should be used in this research (section 2.4)?
2.5. What is the ranking of identified options if the NPV method is used (section 9.3)?
In the next section the scope of this research is described, so it is clear to all parties what possibilities and exceptions are included and excluded in this research.
1.3.3.
Scope
The following restrictions are not included in this research. However, it could well be that money can be saved by changing one of the following premises. The restrictions can therefore be subjects of further research or can be an option to reduce costs.
Only costs of MEET
Only costs occurring at MEET are taken in account in this research. Costs made by the production departments due to handling of packaging materials are not included in this research. Transportation costs of transports from customers located outside the Benelux to MEET are not included, because these costs are paid by the production departments.
Allocation of costs that cannot be influenced
MEET pays Impress for supporting activities, like controlling, support of Human Resource Management and support of the Information Technology department. These costs are allocated to MEET by the plants and MEET does not have any influence on these costs. The allocation of these costs is not part of this research.
Only returnable packaging
For most deliveries are the so called returnable packaging materials used. This means that customers have to return the packaging materials to MEET, so the packaging materials can be reused.
The packaging materials are sold to a few customers for two reasons. First, it appeared that these customers never returned their packaging materials or, second, it is too expensive to transport the packaging materials back to MEET. Reducing the costs of packaging materials that are sold is not included in this research.
An option might be to sell the packaging materials to all customers. This option is included in this research.
Quality restrictions
In this research it is assumed that Hoogeveen only uses first quality packaging materials, Deventer second quality packaging materials and Leeuwarden third quality packaging materials. In practice, however, packaging materials can get mixed up.
1.4. Research approach
The first step in this research is the analysis of the current physical flow of packaging materials. The physical flow of packaging material will be described in a model. The financial consequences of these physical movements are analyzed and added to the model.
The second step is the analysis of the current cost situation. The current cost price calculation is based on direct costing and takes only a few cost components in account. A new updated cost price is estimated with the help of Activity Based Costing. Differences between the current cost price, the ABC cost price and the current trip price are analyzed. The third step in this research is the estimation of options to reduce costs. Per activity (the activities are identified in the ABC cost price calculation) several options to reduce costs are identified.
The fourth step in this research is the ranking of the identified options to reduce costs. Two investment appraisal methods are used to rank the identified options. The fist method is the method used at Impress, the payback period, the other method is the Net Present Value.
The fifth and final step is a recommendation to MEET how it can reduce its costs. Data collection is necessary to determine the costs of the current situation and the height of the savings other options generate. One data source is the information system of Impress. Furthermore, employees of MEET have a lot of information. With the help of interviews, this information is collected.
Further more, books, articles and web pages about: how to set up a research,
Activity Based Costing and Management, production management and
investment appraisal methods are consulted for information.
2. Theoretical Framework
The theory used in this research is explained in this chapter. The first section describes which data collection methods are used. The second section describes how the process is modeled. The third section explains two costing systems, which are used to estimate a cost price. The fourth section describes several techniques to appraise investments.
2.1. Data collection techniques
3Two data collection techniques can be distinguished, the observation approach and the communication approach. Both approaches are used in this research and are further explained below.
Observation approach
When an observation approach is used, a researcher inspects the activities of a subject or the nature of some material without attempting to elicit responses from anyone.
There are several ways to collect data with the help of the observation approach. The two methods used in this research are described below.
Record analysis
This involves the usage of historical and current records of data. One way record analysis is used in this research is by the estimation of how many packaging materials are sorted in a certain time period. In this research only historical data is used (2007). This data can be used in this research, because circumstances are comparable. So, the outcomes of this research are not influenced by the usage of data of last year.
Process analysis
A process analysis is an observation by a time study of stages in a process. In this research this technique is used to protract the current flow of packaging materials. Several activities are timed, because no records were available.
Communication approach
In the communication approach, the researcher questions the subjects and collects their responses by personal or impersonal means. The communication approach can be executed in three ways; the self-administered survey, the phone interview and the personal interview. Each of these manners has advantages and disadvantages. Based on these advantages and disadvantages it is chosen to use the personal interview as a method to gather data.
The type of personal interview that is used in this research is the semi structured interview. A semi structured interview starts with a few specific questions and then follows the individual’s tangents of thoughts with interviewer probes.
This interview type was used for two reasons. The first reason is that an advantage of the semi-structured interview is that not only answers are provided, but also the reasons for the answers. The second reason is that in this research the interviewer did not know in advance what kind of information the participant had. The subjects were therefore identified upfront and the questions specified during the interview.
2.2. Process Flowchart
A process flowchart is used for viewing the sequence of steps involved in producing the product and the flow of the product through the process. It is useful for seeing the totality of the operation and for identifying potential problem areas.4
In this research the process flowchart is used to describe the flow of packaging material from MEET to the customer and back.
There is no exact format for flowchart design. In this research arrows are used to represent flows, inverted triangles to represent buffers and rectangles represent tasks.
2.3. Costing Systems
In this section are two different costing systems explained and their advantages and disadvantages are identified. Thereafter the system that is chosen to apply in this research is explained in more detail.
Different costing systems5
Two types of costing systems can be used to assign costs to cost objects, traditional costing systems and Activity Based Costing.
Traditional costing systems were developed in the early 1900s and are still widely used. The traditional costing systems rely extensively on arbitrary costs allocations. The other costing system, Activity Based Costing (ABC), emerged in the late 1980s. The ABC system uses cause-and-effect cost allocations.
Traditional costing systems are usually simplistic and inexpensive to operate6, but it is likely that the usage results in inaccurate cost assignments and the reporting of inaccurate costs.
According to Turney (1991), the traditional costing systems fail to show what really matters to customers, do not reveal how profitable its customers and products are and do not identify opportunities for improvements.
Johnson and Kaplan (1995) state that with the traditional costing systems management accounting information is produced too late, too aggregated and too distorted to be relevant for managers’ planning and control systems.
4
Another disadvantage is that traditional costing systems do not provide detailed
information on process efficiencies; they focus too narrowly on inputs and fail to provide accurate product costs.
The criticisms stated above resulted in the emergence of the ABC system.
ABC systems have a high level of accuracy and minimize the costs of errors, but are on the other hand expensive to operate.
A traditional costing system can still be used and in practice is still used in 70-80% of the organizations. Traditional costing systems are optimal when the indirect costs are a low percentage of the total costs and when the product range is standardized.
The ABC system is an optimal costing system for organizations with a high proportion of indirect costs and for organizations with products that consume organizational resources in different proportions.
In this research ABC is chosen to estimate a cost price per trip per type of packaging material for several reasons:
The purpose of this research is to identify opportunities for MEET to improve their current cost situation. One of the advantages of ABC is that it gives the management a clear view of their performance and the opportunities for improvement, while traditional costing systems fail to provide this information.
The indirect costs are more than 60% of the total costs of MEET7. ABC is an optimal costing system for organizations with a high proportion of indirect costs. Direct costing systems would in this situation conclude in a too high cost price for high volume products and a too low cost price for low volume products.
The product range of MEET is wide. Different types of packaging materials are used, each having different quality restrictions. This is another reason to use ABC; this system supports a wide product range, while direct costing systems perform best in organizations with a small product range.
Another reason to choose for the ABC system is the availability of data. Data is available to calculate a cost price based on ABC, while there is a lack of data to estimate a cost price based on direct costing. Data could be collected, but because of time restriction and the little added value of a direct costing system, it is decided to not further research this option.
There exists, however, no correct or real cost price. With ABC the accuracy of a cost price calculation can be improved from 50% to 80%. Achieving an accuracy of 100% takes too much time and leads to the illusion of punctuality.8
7
In the next section the steps in an ABC cost price calculation are explained.
ABC in detail
The basic steps in the execution of an ABC calculation are the following9: Step 1: Determine the nature of cost elements. Cost elements can be:
Direct traceable costs Activity traceable costs Non-traceable costs
Direct costs are costs that have a direct relationship to the cost object. An example is the raw materials used to produce a product.
Activity traceable costs are accounted for per activity.
Non-traceable costs cannot be assigned to any activity or cost object; an example is the management expenses. These costs can be allocated to cost objects in proportion to other costs.
Step 2: Account for all traceable costs per activity.
Activities consume resources, or in other words, activities cause costs. Cost elements that are activity traceable are costed to the activity centers to determine the operating costs of the activities.
Step 3: Determine cost drivers and calculate activity recovery rates.
Cost drivers are factors or transactions that are significant determinants of costs. An example of a cost driver for the purchasing department might be the number of purchase orders. Cost drivers are directly linked to output measures; output measures are the numbers behind the cost drivers.
There are two options to calculate the activity recovery rate, also called the ‘activity costs per unit’. The first one takes the capacity output as basis for the calculations, the second the actual output. According to Glad and Becker (1997), the method that takes the capacity output as basis is the preferred method, because cost objects are costed accurately when cost drivers measure the use of activities directly or correlate closely with their use.
Activity rates are estimated with the following formulas: Activity cost per unit (capacity based) = Activity cost
Output measure capacity Activity cost per unit (actual output based) = Activity cost
Step 4: Compile a bill of activities for each cost object.
Cost objects are usually physical products. This is also the case in this research; the cost objects are the different types of packaging materials. For each of the cost objects a bill of activities has to be compiled. The bill of activities is the description of the routing of that a product takes through the activities. It can be compared with the bill of materials. The bill of activities represents a list of all the activities and relative quantities required by a particular cost object.
Step 5: Calculate activity traced costs
To calculate the activity traced costs, the activity recovery rates (as estimated in step 3) have to be multiplied with the quantity of output consumed as specified in the bill of activities.
Step 6: Add direct and non-traceable cost.
The last step is to add direct and non-traceable costs to the activity traced costs (which are calculated in step 5). Direct costs can be associated with the cost object specifically. Non-traceable costs can be added on an arbitrary basis, provided for in the profit margin or allocated in proportion to other costs.
2.4. Investment appraisal methods
10Three methods of investments appraisal can be used to appraise investments on and are considered using in this research.
Accounting Rate of Return Method (ARR). The use of the ARR method involves estimating the ARR on the proposed project and comparing it with a target ARR. If the estimated rate of the proposed project exceeds the target rate, the project should be undertaken. The main criticism of the ARR is that it does not take in account the timing of profits generated from the investment. The model assumes that the profits earned in the first year are equivalent in terms of value to profit in later years; the method ignores the time value of money.
Discounted cash flow (DCF) is an investment appraisal technique which takes into account both the time value of money and the total cash flows over a project’s life. It is therefore often argued that DCF is a superior method to both ARR and the payback period11.
Impress uses the payback period for the appraisal of their investments. Because of the shortfalls of this method, the DCF method is also used in this research for two reasons. First, some options that reduce costs generate savings after the payback period. The payback method does not take this in account the value of these savings.
Second, both ARR and the payback period do not take in account the time value of money, while a euro today is not the same as a euro in ten years. It is therefore important to take in account the time value of money.
There are two main investment appraisal methods that use the discounted cash flow technique, Net Present Value (NPV) and Internal Rate of Return (IRR). Both are discussed below in more detail.
Net Present Value (NPV): The NPV is the present value of future cash inflows minus the present value of the future cash outflows. If the NPV is positive it means that the cash inflows from the investment yield a return in excess of the cost of capital and therefore the investment project should be undertaken. If the NPV is negative it means that the cash inflows from the investment yield a return less than the cost of capital and therefore the opportunity should be rejected. If the NPV is zero, it means that the investment has generated exactly the required returns to compensate for the costs of capital, without a surplus. In this case it is up to the management to decide whether or not to invest.
Internal Rate of Return (IRR): In the application of the IRR method it is necessary to calculate the exact DCF rate of return which an investment opportunity is expected to achieve, that is the rate of return at which the NPV is equal to 0 and compare this with a target rate, which should be the project’s cost of capital. If the expected rate of return exceeds the target rate of return, the project should be undertaken. If the expected rate of return is less that the target the investment should be rejected In almost every situation the internal rate of return results in the same decision as the net present value method. There is only one exception, namely when projects are mutually exclusive.
Another disadvantage of IRR is that it assumes that all proceeds from a project can be reinvested to earn a return equal to the IRR, while the NPV method assumes that the cash flows generated from an investment will be reinvested at the cost of capital. In practice, these can only be reinvested at the cost of capital
When a project has unconventional cash flows (the sign of the new cash flows changes in successive periods), the IRR has a technical shortcoming. It is possible to calculate as many internal rates of return as there are sign changes.
Because of these arguments is in this research the NPV method used to estimate whether or not an investment should be appraised.
Net Present Value (NPV)
The NPV is the present value of cash inflows minus the present value of the cash outflows. The present value of a future sum of money can be calculated by:
n
r FV
PV 1/(1 ) , where
PV = Present Value FV = Future Value
r = compound rate of return per time period n = number of time periods
These formulas are used in this research to calculate the NPV of the options to reduce costs of MEET.
The theory described in this chapter is necessary to achieve the goal of this research, estimate the current cost position of MEET and identify options to reduce the costs. The research starts with a description of the current situation of MEET. Theory about process flowcharts and data collection is needed.
Thereafter a new cost price is calculated, where theory about cost allocation and, again, data collection is used.
In the last chapter of this thesis several options to reduce costs are identified, theory about how to appraise investments is needed.
3. The current situation
To be able to improve the current cost situation of MEET, the current cost situation and thus the current process has to be explored. This chapter describes the current process and costs that occur during this process. The current cost price calculation is also explained in this chapter.
3.1. Physical flow of packaging materials
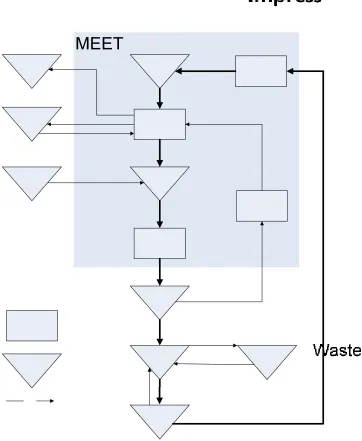
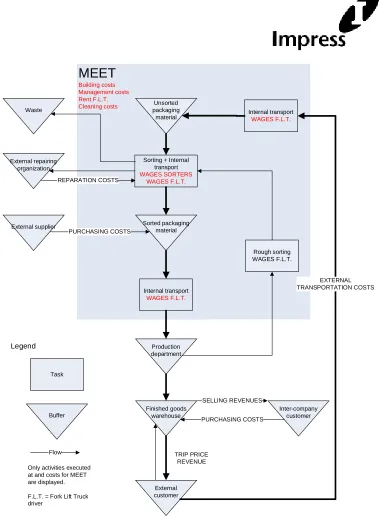
The standard flow of returnable packaging materials starts with the customers returning packaging materials to MEET. This standard flow is described in section 3.1.1. The exceptions are described in section 3.1.2. A graphical overview can be found in Figure 1, Physical flow of packaging materials.
3.1.1.
Customer deliveries
Empty packaging materials are transported with a truck from the customer back to one of the three sorting units of MEET. The customer returns the packaging materials to the unit where it has received the packaging materials from. The truck is unloaded by employees of MEET with the help of a fork lift truck.
Packaging materials that are returned by the customer have to be sorted before they can be reused in the production process. Each piece of packaging material is checked and classified in a specific quality group. For each type of packaging material there exist several quality groups. Standard pallets, for example, are classified in three different quality groups, depending on the quality of the pallet. For carton layer pads nine quality groups exists, not only depending on the quality of the layer pad, but also on the
dimension and the radius of the corners. An overview of all the possible quality groups can be found in Appendix B, Quality groups of packaging materials. The quality group determines for which types of (semi-) finished goods and for which type of customer the packaging materials can be used.
The sorting of packaging materials is executed in several ways, depending on the type of packaging material. For wooden pallets and for steel and wooden frames there are two options, they can be sorted with or without a sorting line. Which method is used depends on the type of pallet and whether or not a sorting line is available (in Leeuwarden no sorting line is available). Synthetic pallets are sorted manually. Sometimes it is necessary to clean the synthetic pallets before they can be reused in the production process.
Figure 1, Physical flow of packaging materials
After sorting, the packaging materials are moved to a buffer by employees of MEET with the help of a fork lift truck. When these packaging materials are needed in the production process they are transported to another buffer, this transport is also executed by
employees of MEET again with the help of a fork lift truck.
As of this buffer the handling of packaging materials is taken over by fork lift truck drivers of the production department.
Impress has two types of customers, external customers and internal (the so-called inter-company) customers. Inter-company customers are other facilities of Impress. As already described, the inter-company customer buys the packaging materials from MEET. The external customer, however, has to return the packaging material to MEET.
This standard flow is described in Figure 1 with a fat line.
The next section describes the exceptions on this flow and how these exceptions are caused.
3.1.2.
Exceptions
Packaging materials are not only returned to the sorting units of MEET by customers, but also by the production department. The packaging materials are returned by the
production department because that type of packaging material is no longer needed in the production process. These packaging materials are transported to the buffer of the sorting units by fork lift truck drivers of the production department. These packaging materials have to be resorted before they can be reused in the production process. This resorting is executed in two steps; in the first step are the packaging materials sorted by type. This step is executed with the help of a fork lift truck and is executed by employees of MEET. Hereafter it is still necessary to go through the standard sorting process, because the fork lift driver is unable to estimate the quality of the packaging materials while he is driving a fork lift truck. The second step is therefore the standard sorting procedure.
Another exception is the delivery of new packaging material to the sorting units. These materials are transported to the sorting units by truck and have to be unloaded by employees of MEET with the help of a fork lift truck.
If, while sorting, packaging materials are discovered that do not fulfill the quality restrictions there are two options. The first option is reparation of packaging materials. The standard pallet is the only type of packaging material that is repaired. Reparation of pallets is only executed if it is considered efficient. It is outsourced to an external organization. This external organization picks up, repairs and delivers back the broken packaging materials.
If reparation is not efficient, the packaging material is considered as waste. Paper and carton packaging materials are sold, pallets are thrown away.
The flow of packaging materials is also registered in the information system of Impress. In Appendix C, Information flow of packaging materials more details can be found about the information flow connected to the physical flow of packaging materials.
3.2. Financial consequences for MEET
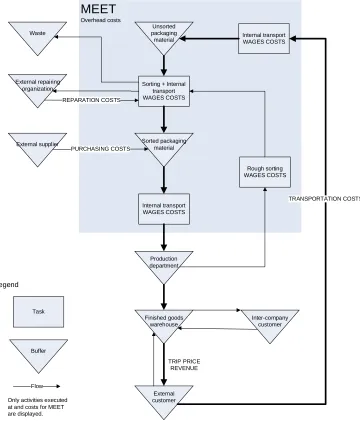
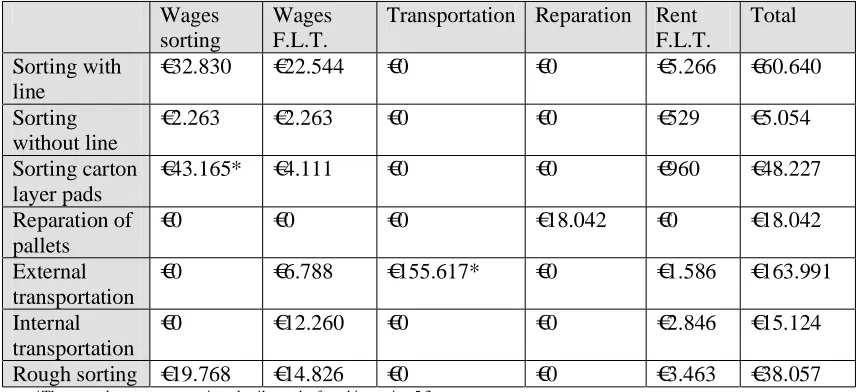
Each physical movement or handling of packaging materials has financial consequences. In other words, each movement costs money or generates revenues. Figure 2 shows the financial consequences of each flow of packaging material (costs are displayed at the arrows). The current cost price calculation, which is explained in the next section, is based on this figure.
MEET
Overhead costs
Sorting + Internal transport WAGES COSTS
Unsorted packaging material
Sorted packaging material
Internal transport WAGES COSTS
Production department
Finished goods warehouse
External customer
Inter-company customer External repairing
organization Waste
External supplier
TRIP PRICE REVENUE PURCHASING COSTS
REPARATION COSTS
TRANSPORTATION COSTS Rough sorting
WAGES COSTS Internal transport WAGES COSTS
Only activities executed at and costs for MEET are displayed.
Buffer
Flow Task
[image:24.595.127.487.236.658.2]Legend
Figure 2, Financial consequences of flow of packaging materials
3.3. Current cost price
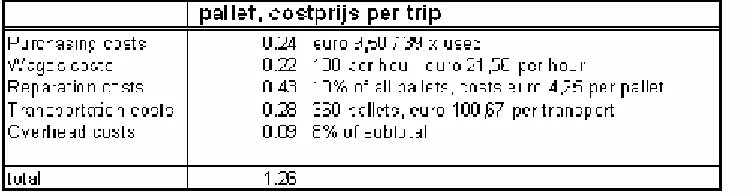
As can be seen in Figure 2, the current cost price per trip is based on four cost
[image:25.595.109.485.248.346.2]components (the cost components are written by the flow arrows). A fifth cost component was added, namely overhead costs, to include other costs (like rent for buildings and fork lift trucks). In Figure 3, the current cost price calculation of a pallet can be found. With the help of this example each cost component is discussed in more detail.
Figure 3, Example current cost price calculation (source: current cost price calculation)
Purchasing costs. This component is based on the number of times a packaging material can be used and on the replacement value of that type of packaging material. The number of times a packaging material can be used was estimated with the help of research conducted by an employee of Impress. This research was based on purchase data and experience of the management of MEET and at that time considered as reasonable. The replacement value of first and second quality packaging material is equal to half of the purchase price of that type of packaging material. The
replacement value of third quality packaging materials is equal to zero.
Wages costs. This component is calculated by multiplying the average costs of MEET for one employee working one hour with the amount of packaging material an
employee can handle in one hour.
Reparation costs. The percentage of packaging materials that need to be repaired before they can be reused in the production process was estimated at 10% (based on experience). At the time this cost price was calculated only pallets and frames were repaired and the reparation was executed by employees of MEET. The reparation costs are wages costs and costs of raw materials.
Currently, the reparation of packaging materials is outsourced to an external organization.
Overhead. The overhead costs are 8% of the subtotal of the above described four components. The overhead costs were introduced to cover costs like rent paid for buildings, fork lift truck etc. This percentage was estimated in a discussion with management and the bookkeeper of MEET.
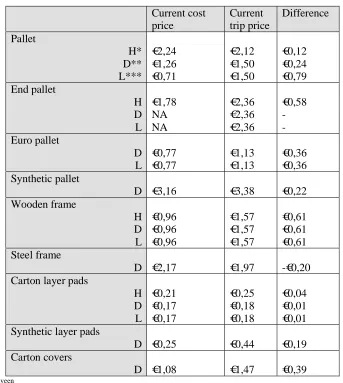
The costs of all these components were added and form the current cost price. With the help of these cost prices the current trip prices per packaging material were estimated. The results per type of packaging material can be found in Table 1.
Current cost price Current trip price Difference Pallet H* D** L*** €2,24 €1,26 €0,71 €2,12 €1,50 €1,50 €0,12 €0,24 €0,79 End pallet H D L €1,78 NA NA €2,36 €2,36 €2,36 €0,58 -Euro pallet D L €0,77 €0,77 €1,13 €1,13 €0,36 €0,36 Synthetic pallet
D €3,16 €3,38 €0,22
Wooden frame H D L €0,96 €0,96 €0,96 €1,57 €1,57 €1,57 €0,61 €0,61 €0,61 Steel frame
D €2,17 €1,97 -€0,20
Carton layer pads
H D L €0,21 €0,17 €0,17 €0,25 €0,18 €0,18 €0,04 €0,01 €0,01 Synthetic layer pads
D €0,25 €0,44 €0,19
Carton covers
D €1,08 €1,47 €0,39
[image:26.595.125.468.262.645.2]* Hoogeveen ** Deventer *** Leeuwarden
As can be seen in Table 1, the cost price does not equal the trip price. The trip price of some types of packaging materials is below the cost price, while for others it is above the cost price.
Management of MEET had decided in that time to not adjust the trip prices for two reasons. The first reason is that at the end of each year MEET made a profit. The second reason is that no complains about costs were received from the production departments, sales departments or customers. So, there was no reason to change the trip prices. In the next section the technique behind the current cost price calculation is analyzed.
3.4. Comments on the current cost situation
The current cost price calculation does not fit the current process, because of several reasons.
First of all, some costs are not separately included in this calculation but added to the component wages costs or overhead costs. Examples are the wages costs of the fork lift truck drivers, the rent for the fork lift trucks and the rent for the buildings. Costs would be more transparent when more cost types are identified.
Some costs, like management costs, are not at all included in this cost price calculation. Management costs, however, have increased in the last years. More managerial tasks are needed to keep control over the process.
Furthermore, this cost price calculation is based on data that stems from 2003 and is thus based on outdated data.
4. Costs and activity identification
As is explained in the last chapter, the current cost price calculation does not cover the current process. Therefore a new cost price is calculated based on Activity Based
Costing. To be able to use Activity Based Costing, all cost elements and activities have to be identified.
In the first section of this chapter the costs of MEET are identified and split up in several cost elements. The second part of this chapter identifies and describes the activities executed at MEET in more detail.
In the third and fourth section of this chapter the first two steps of the calculation of the activity based cost price are executed.
4.1. Detailed description of costs occurring at MEET
Using the balance sheet, the profit and loss account of MEET of 2007 and the process description of section 3.1, the following main costs are identified.
Wages costs sorters
Wages costs fork lift truck drivers Management costs
Purchasing costs Reparation costs
External transportation costs Rent fork lift trucks
Rent buildings
Costs of cleaning the department
Details about these costs, like elements and drivers, can be found on page 31.
MEET
Building costs Management costs Rent F.L.T. Cleaning costsSorting + Internal transport WAGES SORTERS WAGES F.L.T. Unsorted packaging material Sorted packaging material Internal transport WAGES F.L.T. Production department Finished goods warehouse External customer Inter-company customer External repairing organization Waste External supplier TRIP PRICE REVENUE SELLING REVENUES PURCHASING COSTS PURCHASING COSTS REPARATION COSTS EXTERNAL TRANSPORTATION COSTS Rough sorting WAGES F.L.T. Internal transport WAGES F.L.T.
Only activities executed at and costs for MEET are displayed.
F.L.T. = Fork Lift Truck driver
Buffer
Flow Task
[image:30.595.115.494.92.616.2]Legend
Figure 4, Financial consequences of physical flow version 2
Costs that occur when the physical location changes or when activities are executed: Wages costs of sorters and fork lift truck drivers. These costs are the wages costs of the employees sorting the packaging materials and the wages costs of the employees driving the fork lift trucks. Sorters are needed to sort the different types of packaging materials. The fork lift truck drivers are needed when the physical location of packaging materials changes.
External transportation cost. Transports that are not executed by employees of MEET, but where MEET does have to pay for fall under the scope of the external
transportation costs. External transportation costs are made when packaging materials are picked up at the customer and transported to MEET. An agreement is made with the production facilities of Impress that MEET only has to pay for external transports from customers to MEET if the customer is located in the Benelux.
In Leeuwarden extra external transportation costs occur. The sorting unit in Leeuwarden is located 500 meters from the production department. Every day, several trucks drive from the sorting unit to the production department with packaging materials that can be used in the production process. These costs are included in the external transportation costs of Leeuwarden.
Reparation costs. Reparation of packaging materials (only pallets are repaired and not, as in the current cost price calculation, the frames) is outsourced an external organization (and not as in the current cost price calculation executed by employees of MEET). A fixed price has to be paid per pallet that is repaired, not depending on the type of reparation. MEET has the policy that only first and second quality pallets are repaired and that the reparation needs to be efficient.
Purchasing costs. These costs are made when new packaging materials are bought. During the process, old packaging materials need to be replaced by new, because packaging materials are damaged, do not fulfill the quality restrictions any longer or get lost during the process.
Other costs occur even when no activities or physical movements are executed. These are:
Rent buildings. MEET has three sorting units. The buildings are rented from the production departments of Impress. This rent also includes the service for
housekeeping, maintenance, Human Resource Management, Environment & Safety and plant management.
Management costs. The flow of packaging materials needs to be managed. The general management team of MEET consists of one general manager and an assistant. Furthermore, each sorting unit has its own foreman, who is responsible for the administration of that unit. The management costs are the wages of the general management team plus the wages costs of the hours the foremen are executing administrative activities.
Rent for the fork lift trucks. The fork lift trucks are rented from an external organization. MEET rents in total six fork lift trucks, three in Deventer, two in Hoogeveen and one in Leeuwarden. Every month, a fixed amount has to be paid to the external organization where the fork lift trucks are rented from.
MEET has three revenue sources, namely the trip price, the revenues received from inter-company deliveries and the revenues received for selling broken or depreciated
packaging materials.
Broken packaging materials are either thrown away (wooden packaging materials) or sold (carton packaging materials). The revenues of selling the carton packaging materials are too low to influence the costs price and are therefore neglected12.
Another revenue source is the revenues received when packaging materials are sold to inter-company customers. However, these materials have to be bought back for the same price, because they are needed at MEET. On balance, cost equal revenues.
So, MEET has only one significant revenue source, namely the trip price that is paid by the customers.
4.2. Activities
The basis of Activity Based Costing is tracing the several cost types to several activities. The next step is therefore the identification of activities.
From the detailed description of the physical flow of packaging materials in section 3.1 the following activities are identified.
Sorting pallets without the help of a sorting line. In Leeuwarden no sorting line is available, so all pallets are sorted without a sorting line. In Deventer and Hoogeveen the pallets that do not fit on the sorting line are sorted without the help of a sorting line.
Sorting pallets without a sorting line is executed as follows. A fork lift truck puts several small piles (at most five pallets) on the ground. A sorter checks the quality of these pallets. Because these five pallets are piled together, the quality checks are not as accurate as when sorting is executed with the help of a sorting line. Another disadvantage is that two employees are needed, one sorter and one fork lift truck driver.
Sorting of carton layer pads. Carton layer pads are sorted by an employee of MEET with the help of a special tool, to make the sorting of layer pads less labour intensive. Cleaning of synthetic pallets. The synthetic pallets are first sorted without a sorting line, if they are dirty and do not fulfill the quality requirements, they are cleaned. This cleaning is executed manually by two employees, one fork lift truck driver and one cleaner. The fork lift truck driver lifts the pallets so the sorter can easily clean the pallet.
Cleaning of synthetic layer pads. Synthetic layer pads are cleaned and sorted at the same time. Every synthetic layer pad needs to be cleaned before it can be reused in the production process. Synthetic layer pads are cleaned manually by the employees of MEET.
Reparation of pallets. Reparation of pallets is outsourced to an external organization. External transportation of packaging materials. An external transport organization takes care of the transportation of the packaging materials from the customer back to the sorting units. Customers call the MEET assistant with the notification that they have empty packaging material ready to be picked up. The MEET assistance phones the external transport organization to arrange a transport. When the truck arrives at the sorting unit, the fork lift truck driver unloads the truck.
Rough sorting of packaging materials. Rough sorting is executed for two reasons. It occurs when packaging materials that are no longer needed in the production
department are returned to the MEET sorting unit. These packaging materials are not split per type. Before the standard sorting process can start, the packaging materials need to be sorted per type by a fork lift truck driver. Thereafter the packaging materials have to go through the normal sorting process.
Another reason for rough sorting of packaging materials is the delivery of packaging materials from the production department back to the sorting unit. These packaging materials are not always split per type.
The next step is to determine whether the costs identified in section 4.1 can be traced to one of the in section 4.3 identified activities or are direct or non-traceable costs.
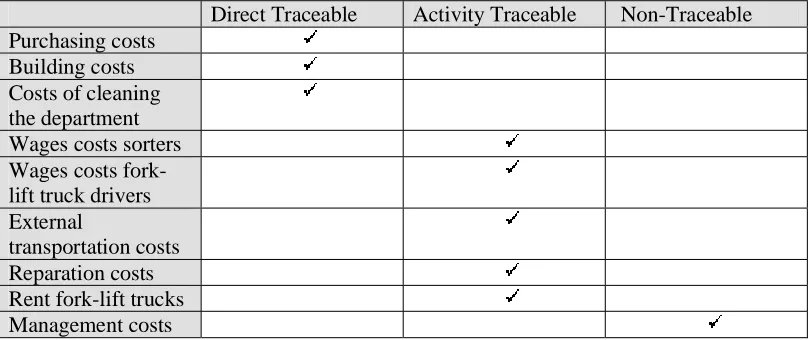
4.3. ABC Step 1: Determination of the nature of cost elements
The first step in the calculation of an Activity Based Costing (ABC) based cost price is the determination of the nature of the cost elements. Costs can be direct traceable, activity traceable or non-traceable. Table 2 gives an overview of the cost elements and their nature. The nature of the cost elements is estimated with the help of the detailed cost description of section 4.1.
The first step is to identify the direct traceable costs; these costs can be traced to the packaging materials easily. The next step is to identify the activity traceable costs. Activity traceable costs need to be traced to activities first and then to packaging materials. The last step is to identify the untraceable costs; these costs are traced in proportion to other costs.
Direct Traceable Activity Traceable Non-Traceable Purchasing costs
Building costs Costs of cleaning the department Wages costs sorters Wages costs fork-lift truck drivers External
[image:34.595.96.502.485.655.2]transportation costs Reparation costs Rent fork-lift trucks Management costs
In this research the direct traceable costs are the costs of purchasing new packaging materials, the rent of the buildings and the costs of cleaning the department. The other costs cannot be traced directly to the packaging materials. Wages for sorters, wages for fork-lift trucks drivers, rent for the fork-lift trucks, external transportation costs and reparation costs are activity traceable costs. These costs are traced to packaging materials via the identified activities.
The wages costs of the management team are not traceable to packaging materials directly or via activities. These are non-traceable costs and are traced to the packaging materials in proportion to other costs.
The next step in the calculation of the ABC cost price per trip is tracing the activity traceable costs to activities.
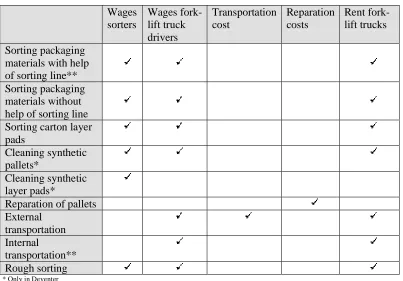
4.4. ABC Step 2: Accounting for all traceable costs per activity
From the detailed description of the activities in section 4.2, the activity traceable cost elements are linked to the activities. In Table 3, an overview can be found of the activities and the activity traceable costs (as identified in Table 2) occurring while executing these activities.
Wages sorters
Wages fork-lift truck drivers
Transportation cost
Reparation costs
Rent fork-lift trucks Sorting packaging
materials with help of sorting line** Sorting packaging materials without help of sorting line Sorting carton layer pads
Cleaning synthetic pallets*
Cleaning synthetic layer pads*
Reparation of pallets External
transportation Internal
transportation** Rough sorting
* Only in Deventer
[image:35.595.98.501.392.673.2]** Only in Deventer and Hoogeveen
The activities described in Table 3 are not all executed on all three sorting units. Cleaning of synthetic packaging materials. Synthetic packaging materials are only used in Deventer, so cleaning of these packaging materials is also only executed in Deventer.
Sorting with a sorting line. Sorting pallets with the help of a sorting line is only executed in Deventer and Hoogeveen; in Leeuwarden no sorting line is present. Here, all packaging materials are sorted manually.
Internal transportation is only necessary in Deventer and Hoogeveen. These units have several buffers located outside the sorting unit where employees of MEET transport packaging material to with the help of fork lift trucks.
5. Activity traceable costs
In this chapter steps 3 till 5 of the ABC-cost price calculation are executed.
In step 3 the cost drivers per activity and the activity recovery rates are estimated, in step 4 the bill of activities for the different types of packaging materials is identified and in step 5 the activity traceable costs per type of packaging material are calculated. The costs are estimated with the help of the balance sheet and profit & loss account of MEET of the year 2007. As is already explained in section 2.1, the data of 2007 can be used, because circumstances did not change. The average hourly wages per sorting unit are requested at the controller of MEET.
Furthermore, several employees of MEET and the management team of MEET are interviewed to gather the information needed.
The end results of this chapter are checked by the management and bookkeeper of MEET.
5.1. ABC Step 3: Determination of cost drivers and calculation
of activity recovery rates
This section is split up into three subsections. In the first subsection the activity cost matrices are determined; in the second subsection the output measures are determined and in the third subsection the activity rates are calculated.
A difference is made between the three sorting units for two reasons. The first reason is that each unit uses packaging materials with different quality requirements (Hoogeveen first quality, Deventer second quality and Leeuwarden third quality). The costs occurring at a sorting unit can therefore be linked to the packaging materials per quality group13. The second reason is that costs (like transportation costs and wages costs) differ per location. Averaging would not give a clear overview of the costs occurring at a trip for a packaging material of a certain quality group.
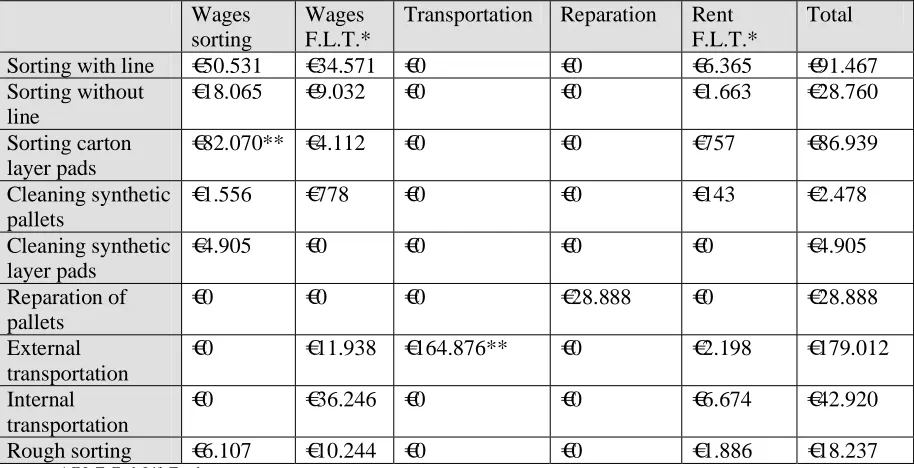
5.1.1. Activity cost matrix
In Table 4 till Table 6 the activity cost matrix per sorting unit can be found. The figures are based on data of 2007 and are amounts per year.
13
Wages sorting
Wages F.L.T.*
Transportation Reparation Rent F.L.T.*
Total
Sorting with line €50.531 €34.571 €0 €0 €6.365 €91.467
Sorting without line
€18.065 €9.032 €0 €0 €1.663 €28.760
Sorting carton layer pads
€82.070** €4.112 €0 €0 €757 €86.939
Cleaning synthetic pallets
€1.556 €778 €0 €0 €143 €2.478
Cleaning synthetic layer pads
€4.905 €0 €0 €0 €0 €4.905
Reparation of pallets
€0 €0 €0 €28.888 €0 €28.888
External transportation
€0 €11.938 €164.876** €0 €2.198 €179.012
Internal transportation
€0 €36.246 €0 €0 €6.674 €42.920
Rough sorting €6.107 €10.244 €0 €0 €1.886 €18.237
* F.L.T. Fork Lift Trucks
[image:38.595.70.527.167.401.2]** These numbers attract attention, details can be found in section 5.3
Table 4, Activity cost matrix Deventer
Wages sorting
Wages F.L.T.
Transportation Reparation Rent F.L.T.
Total Sorting without
line
€52.179 €7.542 €0 €0 €2.819 €62.541
Sorting carton layer pads
€50.654* €0 €0 €0 €0 €50.654
Reparation of pallets
€0 €0 €0 €10,192 €0 €10.192
External transportation
€0 €5.593 €176.163* €0 €2.091 €183.847
Rough sorting €2.581 €2.581 €0 €0 €965 €6.126
*These numbers attract attention, details can be found in section 5.3
[image:38.595.79.520.436.582.2]Wages sorting
Wages F.L.T.
Transportation Reparation Rent F.L.T.
Total Sorting with
line
€32.830 €22.544 €0 €0 €5.266 €60.640
Sorting without line
€2.263 €2.263 €0 €0 €529 €5.054
Sorting carton layer pads
€43.165* €4.111 €0 €0 €960 €48.227
Reparation of pallets
€0 €0 €0 €18.042 €0 €18.042
External transportation
€0 €6.788 €155.617* €0 €1.586 €163.991
Internal transportation
€0 €12.260 €0 €0 €2.846 €15.124
Rough sorting €19.768 €14.826 €0 €0 €3.463 €38.057
[image:39.595.83.514.170.366.2]*These numbers attract attention, details can be found in section 5.3
Table 6, Activity cost matrix Hoogeveen
‘Wages sorters’ can be estimated per activity because data is available to estimate how many hours an employee spends on sorting with a sorting line, without a sorting line, sorting layer pads and rough sorting. This data is registered as follows. At the end of each day, each employee writes down on a form how many packaging materials he has sorted of each type and how much time it took. The total amount of hours an employee has driven on a fork lift truck is also recorded. This data is processed in an overview (excel sheet) and checked against the average efficiency numbers. Furthermore, the accuracy of the registration by the employees is checked (with test samples); the amount that is sorted is recounted by the foreman of the sorting unit and checked with the number recorded at the form. Only small deviations were found (less than 1%).
It can be concluded that the data recorded by employees is reliable. From now on, this data source is revered to as ‘sorting data’14.
Multiplying this data with the average hourly wages of the employees gives the costs of sorting packaging materials.
The time it takes to execute the other activities, sorting without line and internal
transportation, is based on the opinion of experts, no timing of these activities is possible. A detailed explanation about tracing fork lift truck hours and rent of the fork lift trucks to activities can be found in Appendix D, Tracing details.
Reparation costs of pallets are traced to the three sorting units based on the percentage of the total amount sorted at that sorting unit. The policy is that only first and second quality pallets are repaired and that the reparation needs to be efficient.
MEET only has to pay for external transports from the customer back to the sorting unit, if the customer is located in the Benelux. Other external transports are paid by the
production department of Impress. For each transport is recorded at which sorting unit the packaging materials are delivered, so the external transportation costs can be calculated per sorting unit. The bills received from the organizations responsible for the external transports are used to estimate how high the transportation costs were in 2007. The next step in the ABC cost price calculation is the determination of the output measures.
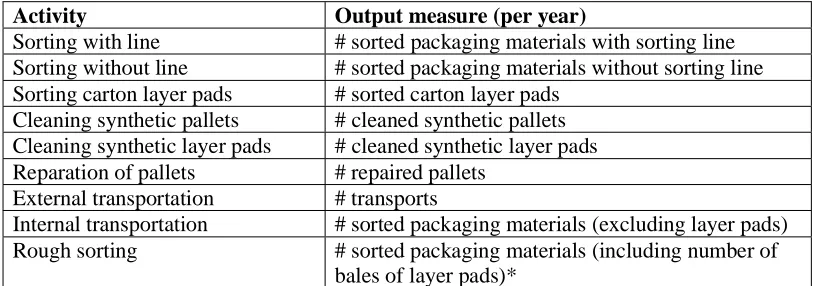
5.1.2. Output measures
As described in section 2.3, it is preferred to take the capacity output as basis for the output measures. In this research this method cannot be applied for two reasons.
Most of the work is executed manually; it depends on the employee how many packaging materials are sorted per hour. Because of high differences in the level of training of employees working at MEET (varying from ground school to university), it is not possible to take the output numbers of one employee as basis for the
calculation. An average of the actual output (based on data of 2007) is therefore taken as basis for the calculation.
The sorting of pallets with the help of a sorting line is automated and the capacity of the sorting line is 125 pallets per hour. In Hoogeveen and Deventer, however, actual amounts sorted per hour differ significantly from the capacity of the line. The cost price per trip would not reflect the actual situation if the capacity is taken as output measure.
Activity Output measure (per year)
Sorting with line # sorted packaging materials with sorting line Sorting without line # sorted packaging materials without sorting line Sorting carton layer pads # sorted carton layer pads
Cleaning synthetic pallets # cleaned synthetic pallets Cleaning synthetic layer pads # cleaned synthetic layer pads Reparation of pallets # repaired pallets
External transportation # transports
Internal transportation # sorted packaging materials (excluding layer pads) Rough sorting # sorted packaging materials (including number of
bales of layer pads)*
* Layer pads are sorted in bales of 300 layer pads. Because the huge amount of layer pads that are sorted in less time, these are included per bale.
The actual output of 2007 is used as actual output.
To estimate the amount sorted per year, the data source ‘sorting data’ (excel sheet) is used. The number of repaired packaging materials is estimated from the bills received from the organization responsible for reparation. The number of transports is based on the bills received from the organizations responsible for the external transports.
Results can be found in Table 7.
Activity Actual output Deventer
Actual Output Leeuwarden
Actual Output Hoogeveen
Sorting with line 455.608 - 172.214
Sorting without line 40.796 233.853 3.867
Sorting carton layer pads
3.005.836 1.459.998 1.502.567
Cleaning of synthetic pallets
3.600 - -
Cleaning of synthetic layer pads
5.898 - -
Reparation of pallets 252.704 89.155 157.820
External transportation 1.389 867 990
Internal transportation 496.404 - 176.081
[image:41.595.94.501.179.322.2]Rough sorting 506.423 238.720 181.090
Table 7, Output measures
5.1.3. Activity rates
In section 2.3 is explained how the activity rates can be calculated (dividing the activity traced costs by the actual output). The results can be found in Table 8.
Activity Activity rates Deventer
Activity rates Leeuwarden
Activity Rate Hoogeveen
Sorting with line €0,20 - €0,35
Sorting without line €0,70 €0,27 €1,31*
Sorting layer pads €0,03 €0,03 €0,03
Cleaning of synthetic pallets
€0,69 - -
Cleaning of synthetic layer pads
€0,83 - -
Reparation of pallets €0,11 €0,11 €0,11
External transportation €128,88 €212,05* €165,65
Internal transportation €0,09 - €0,09
Rough sorting €0,04 €0,03 €0,21*
[image:42.595.96.502.207.383.2]* These numbers attract attention, details can be found in section
Table 8, Activity rates per sorting unit
The next step in the cost price calculation is the compilation of the bill of activities. With the bill of activities, the activities are linked to packaging materials.
5.2. ABC Step 4: Compilation of a bill of activities for each cost
object
The first step in the compilation of the bill of activities is the identification of the cost objects; the second step is to compile for each cost object a bill of activities.
5.2.1. Cost objects
The costs have to be allocated, via activities, to cost objects. In this research are the costs objects the different types of packaging materials.
Standard pallets
End pallets (used to transport can ends on)
Euro pallets (only used in Leeuwarden and Deventer) Syrup pallets (only used in Deventer)
Synthetic pallets (only used in Deventer) Wooden frames
Steel frames (only used in Deventer) Carton layer pads
For each of these costs objects a bill of activities has to be compiled. This is the subject of the next section.
5.2.2. Bill of activities per cost object
For each of the identified cost objects a bill of activities is compiled. Table 9 gives an overview of the bill of activities for each cost object per sorting unit (H=Hoogeveen, D=Deventer, L=Leeuwarden). The numbers in the table represent the amount of the activity that is needed for that type of packaging material. For example, the pallet in Deventer needs 1 sorting with line, 1 reparation, 1 internal transportation, 1 rough sorting and 1/360 of an external transportation.
The Bill of Activities is estimated with the help of process information gathered during interviews with management and employees of MEET and by screening the current process.
Each type of packaging material has to be sorted before it can be reused in the production process. Standard pallets are sorted with the sorting line, together with the wooden and steel frames. The other pallets are sorted without the sorting line. An exception is the sorting unit in Leeuwarden. In this unit no sorting line is available, each pallet and frame is sorted without a sorting line.
Each layer pad in each sorting unit is sorted as described in section 4.2.
The synthetic layer pads are cleaned by employees of MEET, sorting is executed while cleaning the layer pads.
The synthetic pallets are sorted and cleaned by employees of MEET. With the help of data analysis is estimated that 2 out of 7 synthetic pallets need to be cleaned before they can be reused in the production process.
Only standard pallets are repaired. Other types of packaging materials are not repaired, because it is not efficient.
The billing of the external transportation costs is based on the amount of packaging materials that fit in a standard truck. For example, 360 standard pallets fit in a
4
5
o
f
1
0
7
o
t
p
o
ss
ib
le
6
0
,
1
e
tc
.
=
a
m
o
u
n
t
o
f
ac
ti
v
it
y
n
ee
d
ed