Implementation of Principal Component Analysis
for Diagnosing Lung Cancer Using Logistic Model
Tree Algorithm & J48 Algorithm
Firoz Sajad1, Vignesh V2, Chanchal C L3, Jishnu V4, Anoop P S5
1, 2, 3, 4
B-Tech student, MES Institute of Technology & management, Kollam, Kerala
5
Asst. Prof, MES Institute of Technology & Management, Kollam, Kerala
Abstract: Lung cancer is one of the most dangerous diseases in the world. Since the difficulty to detect it in its earlier stages is one of the major reason for its major number of kills. Numerous ways are used for the curing of lung cancer. Like all other cancers chemotherapy is used as one of the effective way to detect lung cancer. Another widely used method is radiography or radiation therapy. Radiography is the treatment done by exposing the infected part to radiation. Surgery and lobectomy are done on the basis of depth of the disease. But these treatments will be effective only if the disease is diagnosed at its earlier stages. Also finding out the depth of the tumors is important. Here, the motive of this paper is to find experimentally the most effective way to detect lung cancer at its earlier stages. Here, the data collected is form UCI repository.
Keywords: Lung cancer, WEKA, Logistic Model Tree, Principal Component Analysis, J48 decision tree
I. INTRODUCTION
The lifestyles of people are changing. Also, the lifestyle diseases are incredibly increasing. And that diseases are well-known for their number of kills. One of the most dangerous in them is cancer. Cancer is the disease that forms in human body organs and grows tumors. These tumors absorbs the nutrients in every part and often leads to death. Over 400s of cancers have been detected. Of them lung cancer and breast cancer are most dangerous, with lung cancer having most number of kills. There are mainly two types of lung cancer. Small Cell Lung Cancer(SCLC) and Non Small Cell Lung Cancer(NSCLC).
Here, the implementation of machine learning techniques is done to detect lung cancer more frequently. For that the software package here used is the Waikato Environment for knowledge Analysis(WEKA) and the feature selection is done using the principal component analysis method for more effective results. Also, the decision tree algorithms Logistic Model Tree(LMT) and J48 are compared for finding which one best suits for the prediction of lung cancer.
II. LITERATURE SURVEY
A comparative study on various decision tree classifier algorithms and to identify the best classifier for Breast cancer classification of SEER dataset is done by [ P. Hamsagayatri and P.Sampath et.al. (2017)]. They analyzed the performance of the four different decision tree algorithms for Breast cancer classification. The simulation results shows REPTree classifier classifies the data with 93.63% accuracy. A study based on brake fluid is done by [ R. Jegadeeshwaran and V. Sugumaran et.al. (2013)] shown that the best first tree classifier with post pruning is more accurate when compared to the best first decision tree classifier with post pruning and C4.5 decision tree classifier. Performance of feed-forward artificial neural networks for a function approximation problem is demonstrated by [ Ajith Abraham et.al. (2005). This section presents the biological motivation and fundamental aspects of modeling artificial neural networks. Another notable work in breast cancer survivability is by [ Jennifer Listgarten, Sambasivarao Damaraju, Brett Poulin,Lillian Cook, Jennifer DuFour, Adrian Driga, John Mackey, David Wishart,Russ Greiner, Brent Zanke et.al. (2004)] , here the three machine learning models, naïve Bayes, SVMs, and decision trees were applied to the SNP data to discriminate normal controls from female breast cancer patient samples.
suits for breast cancer diagnosis. A study of [Tüba Kiyan,Tülay Yildirim et.al. (2004)] applied neural networks for the detection of breast cancer. Neural networks were applied to WBCD database, the applied neural networks are RBF,PNN and GRNN. And GRNN gives the best accuracy . One notable work in the field of spam filtering is done by [ Andrej Bratko, Gordon V. Cormack,
Bogdan Filipic, Thomas R. Lynam,BlazˇZupan et.al. (2006)]. Here data compression models are used for spam filtering.
Empirically, They demonstrate that compression models perform very well for spam filtering, consistently outperforming established spam filters and other methods proposed in previous studies.
It is in the work of [ José M. Jerez-Aragonés, José A. Gómez-Ruiz,Gonzalo Ramos-Jiménez, José Muñoz-Pérez, Emilio Alba-Conejo et.al. (2003)] ,they first used a combined neural network and decision trees model for prognosis of breast cancer relapse. Here , Different algorithms, such as ID3 and C5 were tested in this research, but too many attributes were obtained as significant prognostic factors, which would excessively complicate the architecture of the final neural network system. By using CIDIM, trees smaller than those obtained with other algorithms are generated. Another work of [ B.Rebecca Jeya Vadhanam,S.Mohan & V.Sugumaran et.al. (2016)] depicts the evaluation of the performance of the Artificial Immune Recognition Systems (AIRS) with BICC features to check whether a video is add or not add. The classification performance of various AIRS algorithms namely, AIRS1, AIRS2 and AIRS2 parallel were compared and concluded that AIRS2 gives the best accuracy. Another notable work by [ V. Sugumaran, K.I. Ramachandran et.al. (2011)] depicts the feature classification of roller bearing using SVM and PSVM . And here PSVM gives better results than SVM.A new approach is proposed, called the automated lesion intensity enhancer (ALIE), based on histogram adaptation methods by [ Levent Civicik,Burak Yilmaz, Yüksel Özbay, Ganime Dilek Emlik et.al. (2015)] , This method involves image analysis and a linear combination technique. The technique aims to decrease the effects of the tissues with high intensity levels and increase the detectability of the micro calcifications. Classification is done by CNN algorithm and finds that this technique gives best results.
III. METHODOLOGY
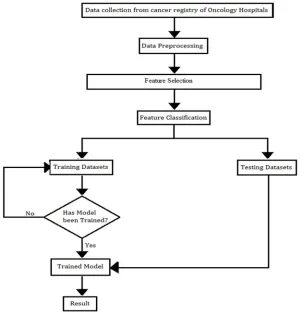
[image:2.612.157.457.397.710.2]A. Data Collection & pre-Processing
Initially the lung cancer data is collected from the UCI repository. The data is initially feature extracted data so no modifications is needed in the data. After the data collection the data is made to data pre-processing. That is the contains 24 attributes, 599 instances and 3 levels. After eliminating the unwanted features like age, sex. Etc. Then the remaining data contains 21 attributes,599 instances and 3 levels.
B. Feature Selection
Feature selection is the process of selecting the useful features and eliminating the unwanted features. This is done by the usage of certain filters. Here Principal component analysis filter is used. It is one of the most important filters uses statistical methods for data processing. Principal component analysis (PCA) in many ways forms the basis for multivariate data analysis. PCA provides an approximation of a data table, a data matrix, X, in terms of the product of two small matrices T and P’. These matrices, T and P’, capture the essential data patterns of X. [ Kim Esbensen and Paul Geladi et.al. (1987)].
C. Feature classification
After the process of feature selection using PCA. The next step of the process is feature classification. Here, LMT and J48 decision trees are used for the feature classification process.
Classification using J48 decision tree:- J48 is a decision tree algorithm which either used as a filter or as a classifier. It has a
flow-chart-like tree structure whose Internal node denotes a test on an attribute and branch represents an outcome of the test. Also, leaf nodes represent class labels or class distribution. [ Anshul Goyal and Rajni Mehta (2012)]
Classification using Logistic Model Tree(LMT):-A logistic model tree basically consists of a standard decision tree structure with
logistic regression functions at the leaves, much like a model tree is a regression tree with regression functions at the leaves. [ Niels Landwehr , Mark Hall and Eibe Frank (2004)]
IV. RESULTS & DISCUSSION A. Classification using Logistic Model Tree
[image:3.612.202.410.452.600.2]Table I shows the stratified cross validation details of the classifier, Table II gives the detailed accuracy by class, Table III shows the confusion matrix and Table IV gives values for objects of the trained Logistic Model Tree.
Table .I
Stratified Cross Validation Summary
Correctly Classified Instances 588
Incorrectly Classified Instances 11
Kappa statistic 0.9724
Mean absolute error 0.0495
Root mean squared error 0.1266
Relative absolute error 11.161%
Root relative squared error 26.8829%
[image:3.612.56.569.647.717.2]Total number of instances 599
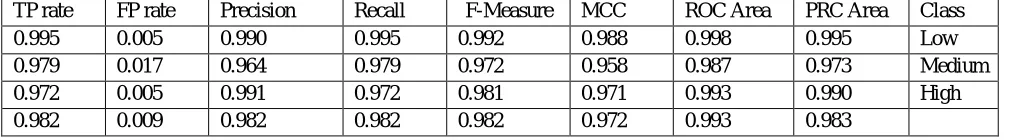
TABLE. II
Detailed Accuracy By Class
TP rate FP rate Precision Recall F-Measure MCC ROC Area PRC Area Class
0.995 0.005 0.990 0.995 0.992 0.988 0.998 0.995 Low
0.979 0.017 0.964 0.979 0.972 0.958 0.987 0.973 Medium
0.972 0.005 0.991 0.972 0.981 0.971 0.993 0.990 High
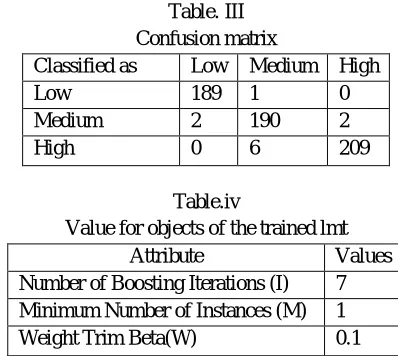
Table. III Confusion matrix
Classified as Low Medium High
Low 189 1 0
Medium 2 190 2
High 0 6 209
Table.iv
Value for objects of the trained lmt
Attribute Values
Number of Boosting Iterations (I) 7
Minimum Number of Instances (M) 1
Weight Trim Beta(W) 0.1
[image:4.612.203.402.77.255.2]The table III shows the confusion matrix. It shows that 189/190 samples were classified as low, and 190/194 were correctly classified as medium. Also, 209/215 samples were correctly classified as high. The table IV shows the values of objects trained by the given algorithm. The classifier depends on its feature variables which are number of boosting iterations, minimum number of instances and weight trim beta. The variation of these variables with classification accuracy is shown in figures 2, 3 & 4.
Fig 2 A chart showing Number of boosting iterations vs classification accuracy
[image:4.612.168.431.328.480.2]By varying the parameter number of boosting iterations ( fig 2) from 1 to 10 in steps of 1. However , the parameter initially decreases the accuracy at 1, Then goes on increasing to the maximum value of 98.1636% at ‘7’. And the curve fluctuates.
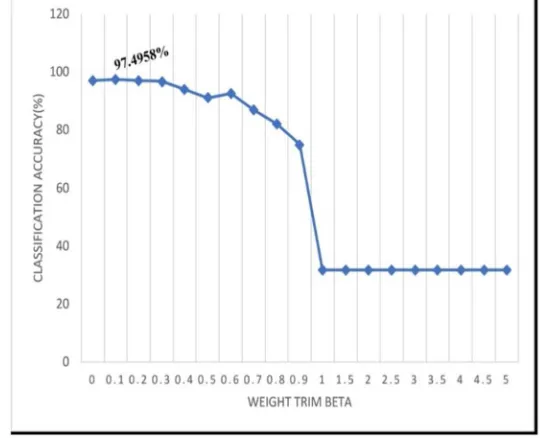
[image:4.612.170.428.550.708.2]Fig 4 A chart showing Weight trim beta vs classification accuracy
By varying the parameter minimum number of instances from 1 to 100 steps in at 1. That is here the accuracy is constant ( which is a maximum of 97.4958%) throughout the curve. It shows variation at 70, where it decreases to a low accuracy and then becomes constant. Also, the parameter weight trim beta is varied from 0 to 5 . Initially from a high accuracy level it decreases and becomes constant at 1. The classifier achieved a maximum accuracy of 98.1636%.
B. Classification Using J48
Table V shows the stratified cross validation details of the classifier, Table VI gives the detailed accuracy by class, Table VII shows the confusion matrix and Table VIII gives values for objects of the trained Decision tree J48.
Table. V
Stratified Cross Validation
Summary
Correctly Classified Instances 571
Incorrectly Classified Instances 28
Kappa statistic 0.9298
Mean absolute error 0.0477
Root mean squared error 0.1748
Relative absolute error 10. 7478%
Root relative squared error 37.1072%
[image:5.612.59.559.638.719.2]Total number of instances 599
Table.VI
Detailed Accuracy by Class
TP rate FP rate Precision Recall F-Measure MCC ROC Area PRC Area Class
0.968 0.017 0.963 0.968 0.966 0.950 0.984 0.945 Low
0.948 0.042 0.915 0.948 0.932 0.898 0.950 0.908 Medium
0.944 0.010 0.981 0.944 0.962 0.942 0.985 0.971 High
Table.VII Confusion Matrix
Classified as Low Medium High
Low 184 6 0
Medium 6 184 4
High 1 11 203
Table.VIII
Value For Objects OF The Trained J48
Attribute Values
Confidence Factor(C) 0.1
Minimum number of objects(M) 3
[image:6.612.159.444.299.457.2]Here, the table VIII shows the values of objects trained by J48. The confusion matrix is shown in table VII. It indicates 184/190 samples were correctly classified as low. And 184/194 samples were correctly classified as medium. Also, 203/215 samples were correctly classified as high.
Fig 5 A chart showing Confidence factor vs classification accuracy
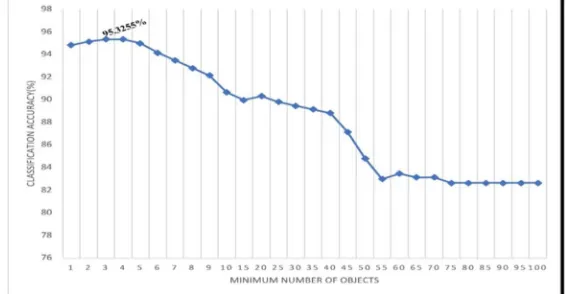
Fig 6 A chart showing Minimum number of objects vs classification accuracy
[image:6.612.163.446.493.640.2]V. CONCLUSION
On comparing the algorithms Logistic Model Tree and J48 by combining Principal Component Analysis method as the feature selection method. LMT gets better results and a much higher accuracy of 98.1636%. While J48 only given poor performance with a comparatively lower accuracy of 95.3255%. Hence concluding that LMT accompanied with PCA gives better results than that of J48 combined with PCA. So LMT best suits for the prediction of lung cancer when combined with PCA.
REFERENCES
[1] P. Hamsagayatri and P.Sampath , “Decision tree classifiers for classification of breast cancer” , International Journal of Current Pharmaceutical Research,Vol.9, Issue. 2, Mar.2017,ISSN :0975-7066
[2] R. Jegadeeshwaran and V. Sugumaran, “Comparative study of decision tree classifier and best first tree classifier for fault diagnosis of automobile hydraulic brake system using statistical features”, Measurement ,vol.46, Jul.2013, pp.3247–3260
[3] Ajith Abraham, “ Artificial neural networks”,Nature & scope of AI techniques,vol.2, Feb.2005,pp.901-908
[4] Jennifer Listgarten, Sambasivarao Damaraju, Brett Poulin,Lillian Cook, Jennifer DuFour, Adrian Driga, John Mackey, David Wishart,Russ Greiner andBrentZanke, “Predictive Models for Breast Cancer Susceptibility from Multiple Single Nucleotide Polymorphisms”, Clinical Cancer Research,vol.10, Apr.2004,pp.2725-2737.
[5] Jaree Thongkam,Guandong Xu andYanchun Sang, “Breast cancer survivability via AdaBoost algorithms”,Healthdataandknowledge management, vol.80, Jan.2008.
[6] V.Sugumaran, V. Muralidharan andK.I.Ramachandran, “Feature selection using Decision Tree and classification through Proximal Support Vector Machine for fault diagnostics of roller bearing”, Mechanical Systems and Signal Processing,vol.21, Feb. 2007,pp.930-942
[7] Hui-Ling Chen,Bo Yang, Jie Liuand Da-You Liu, “A support vector machine classifier with rough set-based feature selection for breast cancer diagnosis”, Expert Systems with Applications,vol.38, Jul. 2011,pp.9014-9022
[8] Tüba Kiyanand Tülay Yildirim, “Breast cancer diagnosis using statistical neural networks”, Journal of electrical & electronics engineering,vol.4, Jan.2004,pp.1149-1153
[9] Andrej Bratko,Gordon V. Cormack, Bogdan Filipic, Thomas R. Lynamand BlazˇZupan, “Spam Filtering Using Statistical Data Compression Models”, Journal
of Machine Learning Research,vol.7, 2006,pp.2673-2698
[10] José M. Jerez-Aragonés, José A. Gómez-Ruiz,Gonzalo Ramos-Jiménez, José Muñoz-Pérez and Emilio Alba-Conejo, “A combined neural network and decision trees model for prognosis of breast cancer relapse”, Artificial Intelligence in Medicine, vol.27, 2003,pp.45–63
[11] B.Rebecca Jeya Vadhanam,S.Mohan V.Sugumaran, “Application of Artificial Immune Recognition System for Identification of Advertisement Video Frames using BICC Features”,Indian Journal of Science and Technology,Vol.9,Issue.14, ISSN:0974-6846,2016
[12] V. Sugumaran andK.I. Ramachandran, “Effect of number of features on classification of roller bearing faults using SVM and PSVM”, Expert Systems with Applications, vol.38, 2011,pp.4088–4096
[13] Levent Civicik,Burak Yilmaz,Yüksel Özbayand Ganimee Dilek Emlik, “Detection of micro calcification in digitized mammograms with multistable cellular neural networks using a new image enhancement method: automated lesion intensity enhancer (ALIE)”, Turkish Journal of Electrical Engineering & Computer Sciences,vol.23,pp.853 – 872,2015
[14] Kim Esbensen and Paul Geladi, “Principal component analysis”, Chronometric and Intelligent laboratory systems, vol.2, 1987,pp.37-52
[15] Anusha Goyal and Rajni Mehta , “ Performance Comparison of Naïve Bayes and J48 Classification Algorithms”, International Journal of Applied Engineering Research, ISSN 0973-4562 Vol.7 No.11,2012