Abstract—This paper is an empirical attempt to evaluate the
strategic value of the investment in renewable energy R&D in Korea using the real option approach. The option model adopted in this paper assumes that the movement of the cost of non-renewable energy follows a binomial lattice and a decision maker has a compound option to invest, abandon, or delay of investment. Analyzing the model with empirical data of Korea, we evaluate the economic value of investment in R&D of renewable energy technologies by comparing the DCF value with the gross option value which reflects the uncertainty of energy market. Furthermore this paper proposes an optimal investment strategy for renewable energy R&D according to the changes of market circumstances through a scenario analysis with respect to the degrees of uncertainty and the scale of investment.
Index Terms— economic evaluation, renewable energy, real
option, R&D
I. INTRODUCTION
HE accelerating depletion of fossil fuel resources and volatility of oil prices, coupled with regulatory responses to environmental changes such as the Climate Change Convention for reduction of greenhouse gas emissions, brought about a renewed awareness of the importance of new and renewable energy sources. New and renewable energy can be derived either from traditional fossil fuels by processing them through novel methods or from renewable alternative sources such as the Sun, water, thermal heat, rain or biological organisms. In recent years, new and renewable energy sources have come to be perceived no longer as simple alternatives to fossil fuels, but rather as the basic and indispensable sources of energy, providing solutions to the energy crisis facing the planet and its nations.
Although developing new and renewable energy sources requires huge initial investment, governments in developed countries are actively investing in related R&D programs and
Manuscript received July 16, 2011; revised August 15, 2011. This work was supported by Basic Science Research Program through the National Research Foundation of Korea(NRF) funded by the Ministry of Education, Science and Technology (2009-0076667).
D. J. Lee is with the Dept. of Industrial & Management Systems Engineering, Kyung Hee University, Yongin, 446-701, South Korea (corresponding author, phone: +82-31-201-2911; fax: +82-31-203-4004; e-mail: ldj@ khu.ac.kr).
K-T. Kim is with the Dept. of Industrial & Management Systems Engineering, Kyung Hee University, Yongin, 446-701, South Korea (e-mail: [email protected]).
S-J. Park is with the Dept. of Industrial & Management Systems Engineering, Kyung Hee University, Yongin, 446-701, South Korea (e-mail: [email protected]).
undertaking policies to expand their use, as they provide solutions to major planetary issues such as the depletion of fossil fuel resources and environmental degradation. This is also the case in Korea, where there is a keen awareness of the critical importance of new and renewable energy sources. The Korean government is continuously increasing funding toward related R&D programs [1]. New and renewable energy R&D programs, as they lead to the improvement of the cost and price competitiveness of new and renewable energy sources, relative to traditional energy sources, help accelerate their commercial distribution. Another important benefit of these programs is that they help lower Korea’s dependence on foreign oil and gas, changing its energy trade pattern, in the process. In order to make informed decisions concerning the allocation of public funding to new and renewable energy R&D, the government needs to be able to accurately assess the economic effects of R&D programs.
Discount cash flow (DCF) analysis, a method widely used for estimating the economic effects of new and renewable energy R&D, has been often called into question as to its accuracy. Indeed, this method tends to underestimate the value of new and renewable R&D programs [2]. The consequences of an inaccurate assessment of the economic effects of a new and renewable energy R&D program on the funding prospects for related projects are bound to be negative. The main reason why the economic value of new and renewable energy R&D tends to be underestimated under the discount cash flow method is that this technique fails to adequately reflect the flexibility of decision-making in the face of uncertainty in the energy market, and more particularly, uncertainty linked to fossil fuel price swings. Hence, what is needed for more accurate estimation of the economic effects of new and renewable energy R&D is a method which is able to take into account flexibility of decision-making. Flexibility of decision-making is an important variable to consider, insofar as this is what allows an organization or a government to promptly respond to market uncertainties and rapidly commercialize new technologies. In recent years, attempts have been made to use a technique known as the “real option approach” for the economic valuation of new and renewable energy R&D programs. Reference [3] argued in support of the real option model among Korean works. Pointing out the increasing uncertainty within the energy market, in part as a result of the structural reform of the energy industry in Korea and abroad and trends toward market liberalization, it stated that the real option approach is an effective technique for evaluating the economic efficiency of investment in new and renewable energy R&D programs.
Reference [2], meanwhile, estimated the value of
Economic Evaluation of Renewable Energy
R&D in Korea using Real Option
Deok Joo Lee, Kyung-Taek Kim, and Sung-Joon Park, Member, IAENG
renewable energy generation technologies, using a real option model, by taking into consideration the price uncertainty of fossil fuels. In this study, aimed at quantifying the benefits of federal renewable energy generation R&D programs funded by the US government, they stressed that the main goal of the federal non-hydro renewable electric R&D program was to facilitate the development of stable energy supply technologies.
Reference [4] assessed the economic value of renewable electric power R&D programs, using a method inspired by the technique used by [5] for valuing a copper mine. They created options lattices that are similar to the ones by [5] and performed an empirical analysis, using a binomial option pricing model and compared their results with the results obtained by [2].
In this study, we estimated the value of new and renewable energy R&D programs in Korea, using DCF analysis and a real option model based on the model used by [4]. We, then, compare the results obtained from the two methods to determine the final value of the options.
The rest of this paper is organized as follows: In Section II, we present the two models employed in this study to value Korean new and renewable energy R&D programs, namely the DCF model and the real option model. In Section III, we briefly describe the data used in this study, discuss the estimation results from the DCF model and the real option model, and explore their policy implications. In the last section, we present the conclusion.
II. MODELS
A. DCF (Discounted Cash Flow) Model
The most commonly method employed to estimate the economic value of new and renewable energy R&D is the discount cash flow (DCF) model. The DCF model estimates the investment value of a R&D program through calculation of its net present value (NPV) by applying a discount rate on the forecasted cash flow in a future point in time. The DCF model is also widely used for investment value analysis on general investment assets.
In order to obtain the NPV of a new and renewable energy technology, using the DCF model, one must first predict the future cash flow generated from the technology. The calculation formula for estimating the economic value of new and renewable energy R&D under this model is as follows:
0
( ) ( ) ( ) ( ) n
t
NRE RE t
NPV P t P t RE t C t
(1)
: Net Present value
( ) : the unit cost of fossil fuel power generation during the time period t
( ) : the unit cost of renewable energy power generation during the time period t
( ) : the amou
NRE
RE where
NPV
P t
P t
RE t nt of renewable energy power generation during the time period t
( ) : & Expenditure for renewable energy
: discount factor
C t R D
B. Real Option Model
The real option model designed for use in this study is
based on the model developed by [4]. A new and renewable energy R&D project has three options: continuing the project, using the research results for industrial application; and abandoning the project. We made the assumption that when the research results are industrially applied or once the research is abandoned, the project can be no longer resumed. For the convenience of analysis, we did not take into consideration technology risk. In other words, we assumed that all R&D projects attain their target outcome, disregarding the possibility of failure in technology development. We also assumed a hypothetical situation in which there is no competition between different types of new and renewable energy sources.
The unit cost of fossil fuel power generation was assumed to follow the geometric Brownian motion (GBM). PNRE( , )t i
corresponds to the unit price of fossil fuel power generation during the time period t, and i is the number of times of increase in unit cost during the period t. The initial unit cost of fossil fuel power generation is expressed as PNRE(0, 0), and the unit cost, thereafter, can have two probability values: the probability p , when the unit cost increases, which is calculated by multiplying the initial price by u ; hence
(1,1) (0, 0)
NRE NRE
P uP ; and the probability (1p), when the unit cost decreases, which is calculated by multiplying the initial price by d; hence, PNRE(1, 0)dPNRE(0, 0). If is the
risk-free interest rate, and the past volatility of the unit cost of fossil fuel power generation, then
1
, , e d
u e d e p
u u d
. Fig. 1 illustrates the above
steps in the form of a diagram:
Fig. 1. Binomial lattice of the unit cost of fossil fuel power generation.
The expected profit to be generated from the deployment of a technology resulting from a new and renewable energy R&D program is realized in the form of cost savings made by consumers from using new and renewable energy at a price cheaper than the price of fossil energy, which can be expressed through formula (2) shown below:
( , , , ) ( , ) ( , ) ( , )
+ ( 1, 1, , ) (1 ) ( 1, , , ) NRE RE
t i r j P t i P t i RE j t M
pW t i r j p W t i r j
(2)
(PNRE( , )t i PRE( , ))t r RE j t( , )M corresponds to the amount
future cost savings. RE j t( , ), the line of market penetration
by new and renewable energy, stands for the amount of power generated from new and renewable energy sources at the point-in-time j, if and when the energy technology developed from a R&D program is deployed. PRE( , )t r , meanwhile, is the unit cost of new and renewable energy generation, and
r
, the number of times a R&D project was conducted. For simplicity’s sake, we assumed that no maintenance cost ( M ) is incurred after the industrial application of a new energy technology; hence, M 0.If a new technology resulting from a new and renewable energy R&D project is not deployed, there can be three options available at the point-in-time t : abandoning the research, industrially applying the research results and continuing the research. The final option values are calculated using formula (3).
;
( , , ) max ( , , , ) ;
( 1, 1, 1)
( )
(1 ) ( 1, , 1)
A
V k i r W k i r k D
p V k i r
C k M
p V k i r
(3)
Here,A, the first term, represents the losses incurred, when a research project is abandoned. In this study, we used the amount of investment put into the project during the year when the project is discontinued forA. The second term,
( , , , )
W t i r t D, is the profit expected to be generated at the point-in-time t , if the results from the R&D project is commercially applied. Here, D , the cost of commercial application of research results was set to zero. The last term is the sum of the R&D and maintenance costs currently incurred, if the R&D project continues, and the current value of the expected profit realized in the future. Therefore, formula (3) compares the cash flow under the three options available during a R&D project, through repeated rounds of comparison, to discover the largest value.
The final option value which can be obtained by backward induction can be written as follows.
;
(0, 0) (0, 0) (0, 0) (0, 0, 0) max
(1,1, 0, 0) (1 ) (1, 0, 0, 0) ;
(0) (1,1,1) (1 ) (1, 0,1)
NRE RE
A
P P RE M D
V
p W p W
C M p V p V
(4)
III. ANALYSIS
A. Data
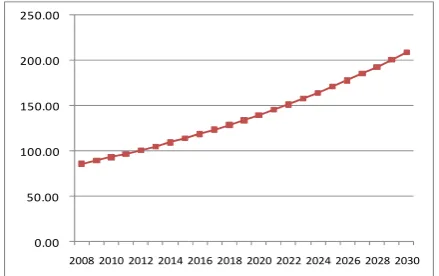
The period analyzed in this study is twenty-two years between 2008 and 2030. The risk-free interest rate was set to 4.04%, the interest rate on government bonds with maturity of three years in 2008, reported in a survey by the National Statistical Office. The initial unit cost of fossil electric power generation, meanwhile, was set to 86.0 won(Korean monetary unit)/KWh, the statistical value provided by the KPX (Korea Power Exchange). The unit costs of fossil
electric generation in subsequent time periods were estimated through a binomial lattice, and the estimated unit costs are provided in Fig. 2:
0.00
50.00
100.00
150.00
200.00
250.00
[image:3.595.322.542.101.239.2]2008 2010 2012 2014 2016 2018 2020 2022 2024 2026 2028 2030
Fig. 2 Estimation result of the unit cost of fossil fuel power generation (won /KWh)
A great majority of new and renewable energy R&D programs in Korea are programs for developing hydrogen and fuel cells, solar and wind energy technologies. In this study, we chose to focus on projects for solar and wind power technology development. In 2008, the unit cost of solar power generation stood at 716.4 won /KWh, and the unit cost of wind power generation 107.29 won /KWh. The initial unit cost of power generation from new and renewable sources was set to 347.7 won /KWh, a price determined by taking into account the amount of solar and wind power generated during the same year. After 2008, there are two possible case scenarios. The first is the scenario in which technology development efforts would lead to the decrease in unit cost of power generation from new and renewable sources, and grid parity is eventually reached by power from new and renewable energy sources by the year 2020, as forecasted in the 3rd Master Plan for the Development, Utilization and Supply of New and Renewable Energy Technology (2009-2030). Under the other scenario, the R&D programs currently underway would result in a decline of unit costs of solar power generation and wind power generation by an average annual rate of 4% and 2%, respectively, as forecasted by the Ministry of Commerce, Industry and Energy (August 30, 2006). These two scenarios are visualized into a diagram in Fig. 3. The top curve shows the change in unit costs, based on the above rate of decline, and the bottom curve, the change in unit costs when grid parity is reached.
0.00
50.00
100.00
150.00
200.00
250.00
300.00
350.00
400.00
[image:3.595.320.546.621.738.2]2008 2010 2012 2014 2016 2018 2020 2022 2024 2026 2028 2030
Fig. 3 Estimation result of the unit cost of renewable energy power generation(won /KWh)
the ‘New and Renewable Energy R&D Strategy 2030,’ is as shown in Fig. 4:
0 200 400 600 800 1000 1200 1400
2008 2010 2012 2014 2016 2018 2020 2022 2024 2026 2028 2030
Fig. 4 R&D Investment plan for renewable energy(Hundred Mil. won)
The share of the total electrical power market, captured by power generated from new and renewable energy sources, after the deployment of energy technologies developed through the R&D programs currently underway, is indicated in Fig. 5 by X j k( , ), the line of market penetration.
Fig. 5 Estimation result of market
pe 0 2000 4000 6000 8000 10000 12000 14000 16000 18000 20000
2008 2010 2012 2014 2016 2018 2020 2022 2024 2026 2028 2030
netra tion of renewable energy(GWh)
The top curve in Fig. 5 is the line of market penetration if new and renewable energy technologies are deployed in 2008. In this case, the combined total amount of solar and wind power generation would reach about 18,600 GWh in 2030. If new and renewable energy technologies are deployed in 2009, the total amount of solar and wind power generation would be slightly less, to stand at 17,800 GWh.
For the empirical analysis using the real option model, we also assumed two case scenarios, depending on the volatility of the unit cost of fossil fuel power generation and the trend in the unit cost of power generation from new and renewable energy sources; the two key parameters. For the volatility of the unit cost of fossil fuel power generation, we used the corresponding figure for oil-fired power generation: 22.53% during the most recent ten-year period and 27.34% during the past twenty-year period. Two trends were assumed for the unit cost of power generation from new and renewable sources, as shown in Fig. 3: one for the case where renewable energies reach grid parity, and the other for the case where the unit cost declines progressively at a certain average annual rate. The four scenarios used for the empirical analysis are summarized in Table 1 and the input data for all cases are shown in Table 2.
TABLE I Scenario 1
volatility() Trend of unit cost of RE CASE 1 22.53% grid parity
CASE 2 27.34% grid parity
CASE 3 22.53% declining
CASE 4 27.34% declining
TABLE II Input data
Variable Unit Case 1 Case 2 Case 3 Case 4
C(0,0) won/KWh 347.0 Same as 1 Same as 1 Same as 1
C(n,0) won/KWh 347.0 Same as 1 Same as 1 Same as 1
C(n,n) won/KWh 65.31 65.31 156.82 156.82
S(0,0) won/KWh 86.0 Same as 1 Same as 1 Same as 1
N Year 22 Same as 1 Same as 1 Same as 1
f
r % 4.04 Same as 1 Same as 1 Same as 1
- 0.96 Same as 1 Same as 1 Same as 1
% 22.53% 27.34% 22.53% 27.34%
p - 0.54 Same as 1 Same as 1 Same as 1
R won Fig. 4 Same as 1 Same as 1 Same as 1
A won Fig. 4 Same as 1 Same as 1 Same as 1
M won 0 Same as 1 Same as 1 Same as 1
X(j, k) KWh Fig. 5 Same as 1 Same as 1 Same as 1
B. Results of DCF Model
While the unit cost of fossil fuel-fired power generation rises over time, the unit cost of power generation from new and renewable energy sources drops progressively. This means that the unit cost of fossil fuel-fired power generation would be higher at some point in time in the future, than the unit cost of power generation from new and renewable energy sources. In the case of Korea, our results show that, assuming that the unit cost of power generation from new and renewable energy sources reach grid parity, the unit cost for solar power would fall at an average annual rate of 4%, and the unit cost for wind power at an average annual rate of 2%. Finally, by the year 2027, the price relationship between fossil fuel-fired power generation and power generation from new and renewable energy sources would be reversed. Once this point is reached, new and renewable energy will be competitive against fossil fuel power, even without R&D projects for developing new technologies, as the unit cost of power generation for the latter will keep rising.
TABLE III Results of DCF model Trend of RE cost R&D NPV
(Hundred mil. Won) CASE 5 grid parity stop -18,972
CASE 6 grid parity continue 9,687
CASE 7 declining stop -86,468
CASE 8 declining continue -84,761
After the unit cost relationship between fossil fuels and new and renewable energy is reversed, our results indicate that the cash flow turns from negative to positive, and the volume of cash flow would be greater, when the R&D programs are continued, than when they are discontinued. A likely explanation would be that the profit realized from the continuation of R&D resulting in a further decline in the unit cost of power generation from new and renewable sources is greater than the cost of investment in R&D.
C. Results of Real Option Model
The results of the real option analysis are provided in Fig. 6, according to the case scenario.
92
84.6
40.8 44.5
0 10 20 30 40 50 60 70 80 90 100
CASE 1 CASE 2 CASE 3 CASE 4
Fig. 6 Results of Real Option model
The results show that the option value of new and renewable energy technologies ranges from 40.8 trillion won at the lowest to 92.0 trillion won at the highest. The results also indicate that the real option value is greater, when new and renewable energy reaches grid parity. Given the colossal amount of money (2.4 trillion won) invested in R&D over the preceding twenty-two years, the total real option value of new and renewable energy technologies proved to be commensurately huge. The total real option value is enormous also because the figure includes both the option value of already developed new and renewable energy technologies and those that will be developed from future R&D projects.
The binomial lattice of option values, under case 3, for instance, shows that it is best to continuously invest in new and renewable energy technology R&D until 2012. Meanwhile, if the price of fossil fuel power continues a downtrend until 2013, a node at which the abandonment option is recommended appears; in which case, the decision to further invest in new and renewable energy technology R&D must be reviewed. If the price of fossil fuel power resumes its upward march in 2014, this would be the optimal time to re-invest in R&D. On the other hand, if the price of fossil fuel power continues to drop until 2020, all nodes
appearing thereafter are those at which the abandonment option is recommended, suggesting that it is better, in this case, not to invest in R&D. The first node at which the industrial application and diffusion of new and renewable energy technologies resulting from R&D are recommended appears in 2025, which means that now is the time to prepare for the diffusion of new and renewable energy technologies. In conclusion, investment in new and renewable energy R&D should continue until 2012, and starting from 2025, the industrial application of the new energy technologies resulting from R&D must be actively considered. Meanwhile, the results show that, if the unit cost of fossil fuel-fired power generation continuously falls until 2020, the economically-rational decision would be to abandon the R&D programs. However, this last case scenario is rather unrealistic, given that we are rapidly approaching the depletion of fossil fuels. Hence, a more sensible interpretation of the results would be that R&D in new and renewable energy must be continued.
Finally, under case 3, the option value of new and renewable energy R&D stands at 40.8 trillion won, which, when compared to -8.48 trillion won and -8.65 trillion won, the NPV obtained using the DCF model, is worth about 49 trillion won in total option value. These results suggest that investment in new and renewable energy R&D makes ample economic sense, when the uncertainty of the future and flexibility of decision-making are taken into consideration.
IV. CONCLUDING REMARKS
This study estimated the value of new and renewable energy R&D in Korea, using a real option model. The value of new and renewable energy R&D, including its option value, estimated by taking into consideration decision options available in an uncertain future environment, was far greater than the NPV obtained from the DCF model, suggesting that related R&D projects represent a good investment value. The option value of R&D proved to be yet greater when and if new and renewable energy reaches grid parity.
Future research should expand on this work and take into consideration additional factors, such as technological uncertainty related to the success of individual new and renewable energy R&D projects, uncertainty related to R&D investment and the environmental effects of the utilization of new energy technologies developed from R&D projects (reduction in carbon dioxide emissions, etc.).
REFERENCES
[1] New and Renewable Energy RD&D Strategy 2030, Korea Energy Management Corporation, New and Renewable Energy Center, 2007. [2] G. Davis and B. Owens, "Optimizing the level of renewable electric
R&D expenditures using real options analysis," Energy Policy, vol. 31, no. 15, pp. 1589-1608, 2003.
[3] W. C. Yoon, Economic evaluation of energy-related project using real option. Korea Energy Economics Institute, 2001.
[4] A. Siddiqui, C. Marnay and R. Wiser, "Real options valuation of US federal renewable energy research, development, demonstration, and deployment," Energy Policy, vol. 35, pp. 265-279, 2007.
[image:5.595.56.280.341.466.2]D. J. Lee received B.E., M.S. and Ph. D. degree in Industrial Engineering from Seoul National University, South Korea. After working at Waseda University as a post-doctoral researcher (Tokyo, Japan), he joined Kyung Hee University in 2000, where he is currently a professor and the department chairman of Industrial & Management Systems Engineering. His research interests include investment analysis using real option, economic analysis of technological systems, and applied game theory in network economics. D
K-T Kim received B.E., M.S. degree in Industrial Engineering from Kyung Hee University, South Korea. Now he is a Ph.D. candidate in the Dept. of Industrial & Management Systems Engineering, Kyung Hee University. His research interests include economic analysis of energy technology and applied game theory in mobile network. D