Performance of the Building in Different Seismic
Zones
M Afrin1, VLS. Banu2
1, 2
Civil Engineering Department, Malla Reddy Engineering College, Hyderabad
Abstract: Earthquake, any sudden shaking of the ground caused by the passage of seismic waves through earth’s rocks. Seismic waves are produced when some form of energy stored in Earth’s crust is suddenly released Hundreds of thousands of people have been killed by earthquakes despite scientists being able to predict and forewarn in advance and engineers construct earthquake-safe buildings.Non-linear analysis is necessary to evaluate the seismic demand of the proposed or existing structure, as linear analysis is inadequate in assessing the seismic demand under severe earthquakes. Pushover analysis is an analysis method to efficiently evaluate the post yield behaviour of the structure. In this article non-linear static analysis (pushover analysis) has been done to understand the behaviour of G+10 multi-storeyed residential building located in different seismic zones (II, III, IV, V) of India having similar geometrical properties using ETABS 2013. The behaviour of multi storied building has been investigated in terms of force-displacement relationships, inelastic behaviour of structure and sequential hinge formations etc. Plastic hinge formation gives real behaviour of the structure.
Keywords: Non-linear static analysis, different seismic zones, shear, displacement, drift, hinge formation.
I. INTRODUCTION
An earthquake is a trembling or a shaking movement of the ground, caused by the slippage or rupture of a fault within the Earth's crust. A sudden slippage or rupture along a fault line results in an abrupt release of elastic energy stored in rocks that are subjected to great strain. This energy can be built up and stored over a long time and then released in seconds or minutes. Strain on the rocks results in more elastic energy being stored which leads to far greater possibility of an earthquake event. The sudden release of energy during an earthquake causes low-frequency sound waves called seismic waves to propagate through the Earth's crust or along its surface.
Hundreds of thousands of people have been killed by earthquakes despite scientists being able to predict and forewarn in advance and engineers construct earthquake-safe buildings.
Earthquake analysis and design principles are developed due to the earthquake consequences and damage of the structures. Earthquake analysis methods are divided into following four categories
1) Seismic coefficient method (Equivalent linear static analysis)
2) Response spectrum method (Linear dynamic analysis)
3) Pushover method (Non-linear static analysis)
4) Time history analysis (Non-linear dynamic analysis)
Linear static analysis or seismic coefficient method is a conventional elastic design method which doesn’t give realistic values when the earthquake is severe.
Non-linear analysis is necessary to capture the response of structures under moderate to extreme earthquakes.
Nonlinear dynamic analysis (Time history analysis) requires site specific ground motion studies. The evaluations of dynamic earthquake parameters are inevitable and on the other hand it is computational, complex, time consuming and not feasible for most of the practical applications.
It is generally believe that the conventional elastic design analysis method cannot capture many important aspects that control the seismic performance of the building.
The capacity of building to undergo inelastic deformations governs the structural behavior of building during seismic ground motions.
For that reason, the evaluation of building should consider the inelastic deformation demanded due to seismic loading.
II. BUILDING MODELLING ANALYSIS
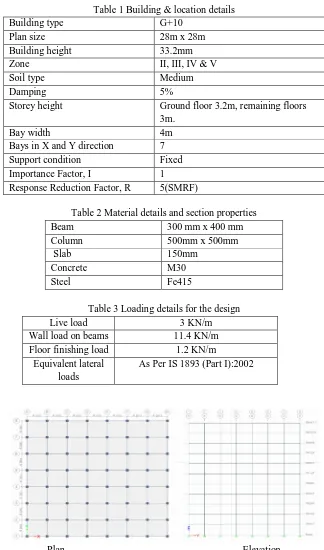
[image:2.612.142.466.163.713.2]A G+10 reinforced concrete building is modelled, analysed and studied. The study is carried out in all the seismic zones of India and conclusions are drawn. The input data required for the design of G+10 building are presented in the tables below. Table 1 show the building details such as plan size, total height of the building, floor height and location details such as zone, soil type etc. The factors such as importance factor, response reduction factor values are taken from IS 1893 (Part 1): 2002. Table 2 shows the material properties and section properties. Table 3 shows the loading details on the building for designing.
Table 1 Building & location details
Building type G+10
Plan size 28m x 28m
Building height 33.2mm
Zone II, III, IV & V
Soil type Medium
Damping 5%
Storey height Ground floor 3.2m, remaining floors
3m.
Bay width 4m
Bays in X and Y direction 7
Support condition Fixed
Importance Factor, I 1
Response Reduction Factor, R 5(SMRF)
Table 2 Material details and section properties
Table 3 Loading details for the design
Live load 3 KN/m
Wall load on beams 11.4 KN/m
Floor finishing load 1.2 KN/m
Equivalent lateral loads
As Per IS 1893 (Part I):2002
Plan Elevation
Beam 300 mm x 400 mm
Column 500mm x 500mm
Slab 150mm
Concrete M30
[image:2.612.144.469.175.359.2]ISO Metric View
III. OBJECTVES AND NEED OF STUDY
A. Pushover Analysis
The pushover analysis of a structure is a static non-linear analysis under permanent vertical loads and gradually increasing lateral loads. The equivalent static lateral loads approximately represent earthquake induced forces. A plot of the total base shear versus top displacement in a structure is obtained by this analysis that would indicate any premature failure or weakness. The analysis is carried out upto failure, thus it enables determination of collapse load and ductility capacity. On a building frame, and plastic rotation is monitored, and lateral inelastic forces versus displacement response for the complete structure is analytically computed. This type of analysis enables weakness in the structure to be identified. The decision to retrofit can be taken in such studies.
B. Purpose Of The Structure
Pushover analysis is an analysis method to efficiently evaluate the post yield behaviour of the structure.
Pushover Analysis in the recent years is becoming a popular method of predicting seismic forces and deformation demands for the purpose of performance evaluation of existing and new structures.
C. Building Performance Level
1) Point A is the original state (OL) of Structure.
2) Point B represents yielding. No deformation occurs in the hinge up to point B.
3) Point C represents the ultimate capacity/Limit for pushover analysis.
4) Point D represents a residual strength limit in the structure. After this limit Structure initialize collapsing.
a) Operational level (OL): As per this performance level building are expected to sustain no permanent damages. Structure retains original strength and stiffness. Major cracking is seen in partition walls and ceilings as well as in the structural elements. b) Immediate occupancy level (IO): Buildings meeting this performance level are expected to sustain no drift and structure retains
original strength and stiffness. Minor cracking in partition walls and structural elements is observed.
c) Life Safety Level (LS): This level is indicated when some residual strength and stiffness is left available in the structure. Among the non-structural elements failing hazard mitigates but many architectural and mechanical and mechanical systems get damaged.
d) Collapse Prevention Level (CP): Buildings meeting this performance level are expected to have little residual strength and stiffness, but the load bearing structural elements function such as load bearing walls and columns. Building is expected to sustain large permanent drifts, failure of partitions infill and parapets and extensive damage to non-structural elements. At this level the building remains in collapse level.
IV. RESULTS & DISCUSSIONS
A. General
The selected building models are analyzed using pushover analysis. Pushover analysis was performed first by considering response spectrum analysis for defining gravity load case for different seismic zones (II, III, IV& V) and then a lateral pushover analysis was performed in a displacement control manner for zone V.
B. Results from Response Spectrum
Seismic analysis carried out by the help of ETABS and the results of Story Shear, story displacement and story drift from Response spectrum analysis.
C. Displacement Values for Earth Quake
D. Displacement values for Response Spectrum
STORIES ZONE II ZONE III ZONE IV ZONE V
BASE 0 0 0 0
STORY 01 0.8 1.2 1.9 2.8
STORY 02 1.9 3.1 4.7 7
STORY 03 3.2 5.1 7.6 11.5
STORY 04 4.4 7.1 10.6 15.9
STORY 05 5.6 9 13.5 20.3
STORY 06 6.8 10.8 16.3 24.4
STORY 07 7.8 12.5 18.8 28.2
STORY 08 8.8 14 21 31.6
STORY 09 9.5 15.3 22.9 34.4
STORY 10 10.1 16.2 24.3 36.4
E. Storey Shear
F. Storey Drift
V. RESULTS FROM PUSHOVER ANALYSIS:
Performance point in the zones IV for the considered building. Performance point is explained in the form of Spectral displacement Vs. Spectral acceleration graphs. Performance point gives the global behaviour of the building. The results will obtain in the form of capacity and demand curves. Formation of plastic hinges gives real behaviour of structure and their elements. Capacity curve was shown in green colour where as demand curve was shown in red colour. The intersecting point of both the curves gives performance
Table3 Target displacement results:
Displacement (mm) 420.5
Shear (kN) 17497.7248
Table4 Performance point results:
Displacement(mm) 261.1
Shear (kN) 14.89
Structural displacement, Sa 0.131
Structural acceleration, Sd(mm) 214.2
T secant(sec) 2.541
Damping ratio, Beff 0.1485
Capacity Curve And Demand Curve
Target Displacement
\\\
VI. CONCLUSIONS
The pushover analysis is a simple way to explore the nonlinear behavior of the buildings. The results obtained in terms of pushover demand, capacity spectrum and plastic hinges the real behavior of structure.
From the pushovr analysis results the target displacement of the building is 420mm, then building performance point is 261mm so that my building is in safe .
From the the hinge results my building status is A> B & B>IO
Story displacement : The displacement of building models increases with the increasing of seismic Zones. The displacement is very high at roof and very low at the base. The displacement for ZONE II is 10.5mm and ZONE IV is 37.7. This means base shear increases by more than 27% if seismic ZONE changes from II to V.
Story displacement results from Resonse Spectrum analysis increases with the increasing of seismic zones. The dispalcement for ZONE II is 0.007573mm and ZONE V is 0.02726mm.
It is concluded that the storey drift increases with the increasing of seismic zone factor. And the maximum storey drift is available at
ZONE V for the max. The storey drift at 3rd floor for ZONE II is 0.000414 and storey drift for ZONE V is 0.001491m. This means
the storey drift is increased when compared to ZONE II to ZONE V.
The Storey Shear is decreased as the building height increased and reduced at top floor in all the building models subjected to seismic loads considered. The storey shear is maximum at the base.The storey shear for ZONE II at the first floor1053 and at top floor 240 & for ZONE V at first floor 3792 and at top floor 867 This means the storey shear is increases when compare to ZONE II to ZONE V.
REFERENCES
[1] IS: 1893 (Part 1), (2007), Indian Standard Criteria for Earthquake Resistant Design of Structures, Bureau of Indian Standards, New Delhi. [2] IS: 456, (2000), Indian Standard Code of Practice for Plain and Reinforced Concrete, Bureau of Indian Standards, New Delhi.
[3] IS: 13920, (1993), Indian Standard Code of Practice for Ductile Detailing of Reinforced Concrete Structures Subjected to Seismic Forces, Bureau of Indian Standards, New Delhi.
[4] Mariopaz-Structure Dynamics: Theory and Computations, (Second Edition), CBS Publishers &Distributors-NewDelhi, 2004. [5] CSI, (2011), extended 3D analysis of building structures (ETABS), Computers and Structures Inc., USA.
[6] Habibullah, A., & Stephen, P. (1998), ‘Practical Three Dimensional Nonlinear Static Pushover Analysis’, Published in Structure Magazine, Winter. [7] V. Mani Deep et al(2017) “pushover analysis of RC building :comparative study on seismic zones of India”.
[8] Narla Mohan, A Mounika vardhan ,(2017) : “ANALYSIS OF G+20 RC BUILDING IN DIFFERENT ZONES USING ETABS”. [9] Rakesh Yadav et al (2017): “Performance Levels of RC Structures by Non-Linear Pushover Analysis”
[10] Riza Ainul Hakim et al(2014):” Application of Pushover Analysis for Evaluating Seismic Performance of RC Building”. [11] Akshay V. Raut et al(2014): “ Pushover Analysis of G+3 Reinforced Concrete Building with soft storey”