©IJRASET: All Rights are Reserved
81
HISTOGRAM BASED TECHNIQUES BPDFHE CLAHE AHE HEContrast Enhancement of MRI Brain Images using
Histogram Equalization Technique’s
Akhil Yechuri1, Vijay Sankar Maddisetty2, Chakradhar Ravipati3, Vamsi Sai Pallapati4, Sai Ram Manigandla5, Munwar Ali Shaik6
1, 2, 3, 4, 5
B.Tech Students, 6Assistant Professor, Dept of ECE, ESWAR college of Engineering , Narasaraopet, A.P, India
Abstract: The Image analysis is difficult in the Magnetic Resonance Imaging(MRI) which are having poor image quality. Especially the bygone, artifacts inherent images and low contrast between tissues and inter individual variability makes affect on the accuracy of clinical diagnosis. Consequently, So we need image enhancement techniques to improve the relevant image contents while preserving the actual details features. This paper presents comparative study of the most commonly used Histogram-based techniques, Mainly Histogram equalization(HE),Adaptive Histogram Equalization(AHE),Contrast Limited Adaptive Histogram equalization(CLAHE) and Brightness Preserving Dynamic Fuzzy Histogram equalization(BPDFHE) techniques, Dealing with contrast enhancement of MRI images.
I. INTRODUCTION
Image processing is a vast and demanding area and its application used in various fields like medical images, satellite images and also industrial applications .The Image Processing techniques ,Image enhancement techniques are comprehensively used as part of the radiology in the field of medical imaging .Magnetic Resonance Imaging(MRI) is a medical imaging technique to study the anatomy of the body .MRI of the brain is a secure and effortless test that uses a magnetic field and radio waves to generate in depth images of the brain and the brain stem and cerebrum and brain tumor ,bleeding and swelling etc .Original MRI images are generally having low contrast. It is difficult for doctors to analyze them .So, it is need to be enhance the details of the image to give the proper diagnosis from the specialist doctors .The main motive of the enhancement is to improve the existence of the image as far as human brightness observation .The main function of image enhancement is to complete the hidden part in an image and to enhance the low contrast image. Which helps to get the exact image. A tumor threat depends on a combination of different factors such as type of the tumor, location, size of the tumor and the way the tumor is spread and develop and glioma is the most common primary brain tumor in adults. Regarding the nature and appearance of the brain tumor. Just one MRI technique is not enough for segmentation after brain tumor including all areas. So, we are going with enhancement of the image by the contrast manipulation to get the better quality of the image. A very well preferable technique for contrast upgrade is Histogram Equalization(HE).
Histogram Equalization has good performance for images such as human brain or different parts of body etc.
This Histogram Equalization increases or improve the contrast of the MRI brain images. Even though there are number of strategies or techniques to improve the nature of MRI images, need for future improvement in which, Histogram Equalization(HE),Adaptive Histogram Equalization(AHE),Contrast Limited Adaptive Histogram Equalization(CLAHE),Brightness Preserving Dynamic Fuzzy Histogram Equalization(BPDFHE) techniques are used to improve or enhance the quality of MRI images and natural images.
II. HISTOGRAM BASED TECHNIQUES
Contrast Enhancement of MRI brain images by using histogram based techniques are classified in to four types as shown below:
©IJRASET: All Rights are Reserved
82
A. Histogram Equalization (HE)
Histogram equalization (HE) is a popular image enhancement method. HE works by stretching and equalizing the histogram through the intensity range by means of probability distribution function (PDF) and cumulative distribution function (CDF). HE is used as a basic method in the enhancement process by many researchers.
The histogram is a graph which shows the frequency of occurring of data in the whole data set. It plots the number of pixels for each tonal value. Consider an image with M total possible intensity levels. Then, the histogram of the image in [0, M-1] is defined as a discrete function:
P(rk )=nk/n Where,
rk is the kth intensity level in the interval.
nk is the number of pixels in the image whose intensity level is rk. n is the total number of pixels in the image.
Histogram equalization is an image enhancement technique which enhances the contrast of an image by spreading the intensity values over the entire available dynamic range. This is achieved through a transformation function T(r), which can be defined by the Cumulative Distribution Function (CDF) of a given Probability Density Function (PDF) of gray levels in an image.
1) Continuous Case: This is for intensity levels that are continuous quantities normalized to the range [0, 1]. Let, Pr(r) is the PDF of the intensity levels.
Then, the required transformation on the input levels to obtain the output level S is:
(1)
where w is a dummy variable of integration. Then, it can be shown that the PDF of the output levels is uniform, i.e.,
(2)
The above transformation generates an image whose intensity levels are equally likely and also, it covers the entire range [0, 1]. This intensity level equalization process results in an image with increased dynamic range with a tendency to have higher contrast.
2) Discrete Case: In the case of discrete quantities, we deal with summations and hence, the equalization transformation becomes:
(3) where Sk is the intensity value of the output image corresponding to value rk in the input image.
B. Adaptive Histogram Equalization(Ahe)
It is different from ordinary histogram equalization in the sense that it is not global and it computes many histograms corresponding to different sections of an image . So, it is possible to enhance the local contrast of an image through AHE.
With AHE, the information of all intensity ranges of an image can be viewed simultaneously and thereby solving the problem of many ordinary devices which are unable to depict the full dynamic intensity range. Here, first, a contextual region is defined for every pixel in the image. The contextual region is the region centered about that particular pixel. Then, the intensity values for this region are used to find the histogram equalization mapping function. The mapping function thereby obtained is applied to the pixel being processed in the region and hence, the resultant image produced after each pixel in the image is mapping differently.
©IJRASET: All Rights are Reserved
83
Fuzzy Histogram Computation Partitioning of the Histogram Dynamic Histogram Equalization of the partitions Normalizationof the image brightnessC. Contrast Limited Adaptive Histogram Equalization(CLAHE):
The major difference between Adaptive histogram equalization (AHE) and Contrast limited adaptive histogram equalization (CLAHE) is contrast limiting. The CLAHE produces clipping limit for histogram to overcome the noise amplification problem. The CLAHE method divides the image in to relative regions and applies the histogram equalization process to each region. CLAHE has two parameters clip limit(CL) and block size which are mainly control image enhancement quality. By increasing the clip limit the image brightness will be increased. Similarly by increasing block size the range becomes larger due to these the image contrast also increases. CLAHE is one of the most widely and established method for the successful enhancement of low-contrast images. The CLAHE method consists the following 7 steps
1) Dividing the original intensity image into non-overlapping contextual regions. The total number of image tiles is equal to MXN
, and 8X8 is a good value to preserve the image chromatic data.
2) Calculating the histogram of each contextual region according to gray levels present in the array image.
3) Calculating the contrast limited histogram of the contextual region by clipping limit value. (4). Redistribute the remain pixels until the remaining pixels have been all distributed.
4) Enhancing intensity values in each region by Rayleigh distribution. (6). Reducing abruptly changing effect
5) Calculating the new gray level assignment of pixels within a sub-matrix contextual region by using a bi-linear interpolation between four different mappings in order to eliminate boundary artifacts.
D. Histogram Stretching and Clip-Limit Process
[image:3.612.97.515.400.536.2]Under- and over-contrast occur in an underwater image whereas the amount of pixels is cumulatively concentrated at low and high intensity levels. Hence, stretching and clip-limit processes are applied to the image histogram of respective regions to prevent under- and over-contrast effects. For this purpose, the histogram of a region from the previous step is generated and the LUT is built. The clip-limit visual process is shown in Fig. 2, in which the spikes in the histogram higher than the clip limit will be cut off. The excessive numbers of pixels are equally distributed to all intensity levels, thereby increasing the number of pixels at all intensity levels. In this case, a normalized value of the clip limit is set at 0.01.
Fig. 2. Applying clip limit to the histogram of image.
E. Brightness Preserving Dynamic Fuzzy Histogram Equalization
In Brightness Preserving Dynamic Fuzzy Histogram Equalization(BPDFHE) technique manipulates the image. The image Histogram in such a way that no remapping of Histogram peaks takes place, While only redistribution of gray level values in the valley portions between the two consecutive peaks take place. The BPDFHE technique consist of following operational stages represent in the following flow chart.
©IJRASET: All Rights are Reserved
84
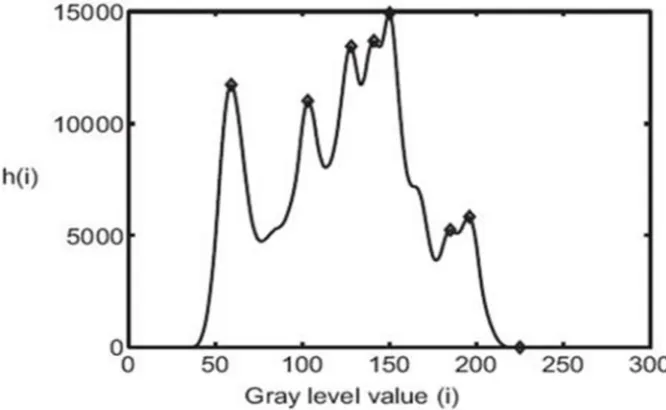
The following sub-sections contains the details of steps involved.1) Fuzzy Histogram Equalization: A Fuzzy Histogram is a sequence of real number h(i), i€{0,1,2 L-1} where h(i) is the frequency of occurrence of gray levels that are “Around i” .By considering the gray value I(x,y) as a fuzzy number. The Fuzzy Histogram is computed as
(4) Where the Triangular Fuzzy membership function defined as
(5) And (a,b) is the support of the membership function.
Fuzzy statistics is able to handle the inexactness of gray values in a much better way compared to classical crisp histograms thus producing a smooth histogram. Thus the use of fuzzy histogram is suitable for this particular application.
2) Partitioning of The Histogram: The local maxima based partitioning of the histogram, to obtain multiple sub-histograms, is performed in this step. This way every valley portion between two consecutive local maxima forms a partition. When the dynamic equalization of these partitions is performed the peaks of the histogram do not get remapped and this results in better preservation of the mean image-brightness while increasing the contrast.
a) Detection of Local Maxima: The local maxima in the Fuzzy Histogram are located using the first and second derivative of the Fuzzy histogram. Since the histogram is a discrete data sequence, we use the central difference operator for approximating a discrete derivative
(6)
[image:4.612.137.470.464.669.2]Where, ḣ(i) represents the first order derivative of the Fuzzy histogram h(i) corresponding to the ith intensiy level.
Fig. 4.Fuzzy histogram with marked local maxima.
©IJRASET: All Rights are Reserved
85
The local maxima points are then indicated for those values of intensity levels where zero crossings of the first order derivative aredetected along with a negative value of the second order derivative
However, points of ambiguity arise in most situations as perfect zero crossings do not occur at integral values of intensity levels. In such situations, generally two neighboring pairs are detected as points of maxima. The ambiguity can be resolved by preserving the point with the highest count among the neighboring pair of maxima.
b) Creating Partitions: The local maxima points in the fuzzy histogram can now be used to form the partitions. Let (n+1) intensity levels corresponding to the local maxima, detected in the previous stage of operation, be denoted by {m0,m1, ,mn}.
Assuming the original fuzzy histogram to have a spread in the range of [Imax,Imin] ,then the (n+1) sub-histogram obtained after partitioning are
3) Dynamic Histogram Equalzation Of The Sub-Histogram: The sub-histograms obtained are individually equalized by the DHE technique. The equalization method uses a spanning function based on total number of pixels in the partition to perform equalization. It involves two stages of operation, namely, mapping partitions to a dynamic range and histogram equalization.
a) Mapping Partitions to a Dynamic Range: The following set of equations give the parameters that are useful in dynamic equalization process.
b) Equalizing each Sub-histogram: The method for equalizing each partition of the histogram is similar to that used for global histogram equalization. For the the i sub histogram, the remapped values are obtained as
4) Normalization of The Image Brightness: The image obtained after the dynamic histogram equalization of each sub histogram is has the mean brightness that is slightly different than the input image. To remove this difference the normalization process is applied on the output images. Let mi and mo be the mean brightness levels of the input image and the image (f) obtained after dynamic histogram equalization stage. If g is the output image of BPDFHE technique then the gray level value at the pixel location (x,y) For the image g is given as
©IJRASET: All Rights are Reserved
86
III. EXPERIMENTAL RESULTS
The work is executed on MATLAB Software with various MRI images. Taken from the internet source. First the different Histogram based techniques mentioned in the previous section are applied to the images and then the performance of Histogram based techniques are Analyzed .
©IJRASET: All Rights are Reserved
87
IV.CONCLUSION
In this Work Different Histogram based techniques are applied on MRI BRAIN image. It was clearly observed that Aadaptive Histogram Equalization (AHE) technique produce better results compare to Histogram equalization (HE), Contrast Limited Adaptive Histogram Equalization (CLAHE) AND Brightness Preserving Dynamic Fuzzy Histogram Equalization(BPDFHE) techniques. Future work focus on extending the algorithms by using advanced methods to improve the results.
REFERENCES
[1] SK.Y Muneer Ahamed, Bharat Kumar.M, Narasiha Rao.J, Showri Babu.N, Munwar Ali Shaik. “An Improved Underwater Image Enhancement Technique”,2018.
[2] R. C. Gonzalez and R. E. Woods. “Digital Image Processing”. 3rd ed. Prentice Hall, 2002.
[3] HAVAEI, Mohammad, DAVY, Axel, WARDE-FARLEY, David, et al. Brain tumor segmentation with deep neural networks. Medical image analysis, 2017, vol. 35, p. 18-31
[4] MOHAN, J., KRISHNAVENI, V., et GUO, Yanhui. A survey on the magnetic resonance image denoising methods. Biomedical Signal Processing and Control, 2014, vol. 9, p. 56-69.
[5] ALEXANDER, M. E., BAUMGARTNER, R., SUMMERS, A. R., et al. A wavelet-based method for improving signal-to-noise ratio and contrast in MR images. Magnetic Resonance Imaging, 2000, vol. 18, no 2, p. 169-180.
[6] ANAND, C. Shyam et SAHAMBI, Jyotinder S. Wavelet domain nonlinear filtering for MRI denoising. Magnetic Resonance Imaging, 2010, vol. 28, no 6, p. 842-861.
[7] Isa IS, et al. Automatic contrast enhancement of brain MR images using Average Intensity Replacement based on Adaptive Histogram Equalization (AIR-AHE). Biocybern Biomed Eng (2017).
[8] SENTHILKUMARAN, N. et THIMMIARAJA, J. Histogram equalization for image enhancement using MRI brain images. In Computing and Communication Technologies (WCCCT), 2014 World Congress on. IEEE, 2014. p. 80-83.
[9] Chiao-Min Chen1 et al , Automatic Contrast Enhancement of Brain MR Images Using Hierarchical Correlation Histogram Analysis, J. Med. Biol. Eng. (2015) 35:724–734 DOI 10.1007/s40846-015-0096-6.
[10] ZIMMERMAN, John B., PIZER, Stephen M., STAAB, Edward V., et al. An evaluation of the effectiveness of adaptive histogram equalization for contrast enhancement. IEEE Transactions on Medical Imaging, 1988, vol. 7, no 4, p. 304-312.
[11] IBRAHIM, Haidi et KONG, Nicholas Sia Pik. Brightness preserving dynamic histogram equalization for image contrast enhancement. IEEE Transactions on Consumer Electronics, 2007, vol. 53, no 4.
[12] KONG, Nicholas Sia Pik et IBRAHIM, Haidi. Color image enhancement using brightness preserving dynamic histogram equalization. IEEE Transactions on Consumer Electronics, 2008, vol. 54
[13] MENZE, Bjoern H., JAKAB, Andras, BAUER, Stefan, et al. The multimodal brain tumor image segmentation benchmark(BRATS). IEEE transactions on medical imaging, 2015, vol. 34, no 10, p. 1993-2024
[14] TANG, Jing Rui et ISA, Nor Ashidi Mat. Adaptive image enhancement based on bi-histogram equalization with a clipping limit. Computers & Electrical Engineering, 2014, vol. 40, no 8, p. 86-10.
©IJRASET: All Rights are Reserved
88
AUTHORSAkhil Yechuri is presently studying final year B.tech in Electronics and Communication engineering in ESWAR college of engineering Narasaraopet, Andhra Pradesh ,India. Akhil research interests include Digital Signal Processing and Digital image processing.
Vijay Sankar Maadisetty is presently studying final year B.tech in Electronics and Communication engineering in ESWAR college of engineering Narasaraopet, Andhra Pradesh ,India. Vijay Sankar research interests include Digital Signal Processing and Digital image processing.
Chakradhar Ravipati is presently studying final year B.tech in Electronics and Communication engineering in ESWAR college of engineering Narasaraopet, Andhra Pradesh ,India. Chakradhar research interests include Digital Signal Processing and Digital image processing.
©IJRASET: All Rights are Reserved