Abstract— Stock investment has become an important investment activity in Thailand. However, investors often lose money due to unclear investment objectives. Therefore, an investment decision support system to assist investors in making good decisions has become an important research issue. Thus, this paper introduces an intelligent decision-making model, based on the application of Fuzzy Logic and Neurofuzzy system (NFs) technology. Our proposed system can decide a trading strategy for each day and produce a high profit for each stock. Our decision-making model is used to capture the knowledge in technical indicators for making decisions such as buy, hold and sell. Finally, the experimental results have shown higher profits than the Neural Network (NN) and “Buy & Hold” models for each stock index. The results are very encouraging and can be implemented in a Decision- Trading System during the trading day.
Index Terms— Intelligence System, Fuzzy Logic, Neuro-Fuzzy System, Stock Index, Decision Making System.
I. INTRODUCTION
The prediction of financial market indicators is a topic of considerably practical interest and, if successful, may involve substantial pecuniary rewards. People tend to invest in equity because of its high returns over time. Considerable efforts have been put into the investigation of stock markets. The main objective of the researchers is to create a tool, which could be used for the prediction of stock market fluctuations; the main motivation for this is financial gain. In the financial marketplace, traders have to be fast, thus creating the need for powerful tools for decision making in order to work efficiently, and most importantly, to generate profit.
The use of Artificial Intelligence (AI) had a big influence on the forecasting and investment decision-making technologies. There are a number of examples using neural networks in equity market applications, which include forecasting the value of a stock index [4,5], recognition of patterns in trading charts[12], rating of corporate bonds[8], estimation of the market price of options[11], and the indication of trading signals of selling and buying[3,12].
Even though most people agree on the complex and nonlinear nature of economic systems, there is skepticism as to whether new approaches to nonlinear modeling, such as neural networks, can improve economic and financial forecasts. Some researchers claim that neural networks may not offer any major improvement over conventional linear
Manuscript received July 26, 2011; Monruthai Radeerom obtained her MS Degrees in Information Technology from the Rangsit University in 2007. She is currently a Ph. D candidate of Computer Science at Faculty of Information Technology, Rangsit University, Pathumtani, Thailand 12000 (phone: 084-004-2262; e-mail: mradeerom@ yahoo.com).
M.L. K. Kasemsan is with the Director of the Master of science program in Information Technology, Faculty of Information Technology, Rangsit University, Pathumtani, Thailand 12000 (Phone: (662) 997-2200-30 ext. 5555, Fax: (662) 997-2200 ext. 5577, e-mail: [email protected]).
forecasting approaches [8, 12]. In addition, there is a great variety of neural computing paradigms involving various architectures, learning rates, etc., and hence, precise and informative comparisons may be difficult to make. In recent years, an increasing amount of research in the emerging and promising field of financial engineering has been incorporating Neurofuzzy approaches [10, 12]. Almost all models are focused on the prediction of stock prices. The difference of our proposed model is that we are focusing on decision-making in stock markets, but not on forecasting in stock markets.
In contrast to our previous work [14], we are not making a direct prediction of stock markets, but we are working on a one-day forward decision-making tool for buying/selling stocks. We are developing a decision-making model which works beyond the application of Fuzzy Logic and Neuro-Fuzzy systems (NFs). At first, our proposed trading strategy based on Fuzzy Logic captured knowledge from experts who are making decisions to buy, hold, or sell from technical analysis as well as input from our proposed trading systems based on NFs. Moreover, optimization algorithms based on the rate of the return profit of each stock index constructed our NFs model. In this paper, we present a decision-making model which combines technical analysis and NFs models. The technical analysis model evaluated knowledge about buy, hold and sell strategies from each technique. Our proposed model used results from the technical analysis model to input into our NFs. The NFs trading system decides the buy, sell and hold strategy for each stock index. The objective of this model is to analyze the stock daily and to make one day forward decisions related to the purchase of stocks.
The paper is organized as follows: Section 2 presents the background about the Neural Network and the Neuro-Fuzzy system; Section 3 presents the NFs decision-making model; Sections 4 is devoted to experimental investigations and the evaluation of the decision-making model. This section provides the basis for the selection of different variables used in the model, and models the structure. The main conclusions of the work are presented in Section 5, with remarks on future directions.
II. NEURAL NETWORK AND NEUROFUZZY APPROACHES FOR THE INTELLIGENCE PORTFOLIO MANAGEMENT SYSTEM
A. Neural Networks (NNs) for Modeling and Identification
The neural networks are used for two main tasks: function approximation and pattern classification. In function approximation, the neural network is trained to approximate a
Intelligence Trading System for Thai Stock Index Based
on Fuzzy Logic and Neurofuzzy System
mapping between its inputs and outputs. Many neural network models have been proven as universal approximations, i.e. the network can approximate any continuous arbitrary function accurately. The pattern classification problem can be regarded as a specific case of the function approximation. The mapping is done from the input space to a finite number of output classes.
Fig 1 A feedforward neural network with one hidden layer [19]
For function approximation, a well-known model of NNs is a feed forward multi-layer neural network (MNN). It has one input layer, one output layer and a number of hidden layers between them. For illustration purposes, consider a MNN with one hidden layer (Figure 1). The input-layer neurons do not perform any computations. They merely distribute the inputs to the weights of the hidden layer. In the neurons of the hidden layer, first the weighted sum of the inputs is computed
m
j
X
W
x
w
z
i T h j p i i h ijj
(
)
,
1
,
2
,
,
1
(1)It is then passed through a nonlinear activationfunction, such
as the tangent hyperbolic:
j m z z v j j
j , 1,2, ,
) 2 exp( 1 ) 2 exp( 1
(2)
Other typical activationfunctions are the threshold function
(hard limiter) and the sigmoid function. The neurons in the output layer are linear, i.e., only the weighted sum of their inputs is computed:
n l X W v w yl h j T o l j o
jl ( ) , 1,2, ,
1
(3)
Training is the adaptation of weights in a multi-layer network such that the error between the desired output and the network output is minimized. A network with one hidden layer is sufficient for most approximation tasks. More layers can give a better fit, but the training time takes longer. Choosing the right number of neurons in the hidden layer is essential for a good result. Too few neurons give a poor fit, while too many neurons result in overtraining of the net (poor
generalization of unseen data). A compromise is usually sought by trial and error methods.
The back propagation algorithm [16] has emerged as one of the most widely used learning procedures for multi-layer networks. There are many variations of the back propagation algorithm, several of which will be discussed inthe next section. The simplest implementation of back propagation learning updates the network weights and biases in the direction that the performance function decreases most rapidly.
B. Neurofuzzy System (NFs) for Modeling and
Identification
Both neural networks and the fuzzy system imitate the human reasoning process. In fuzzy systems, relationships are represented explicitly in forms of if-then rules. In neural networks, the relations are not explicitly given, but are coded in designed networks and parameters. Neurofuzzy systems combine the semantic transparency of rule-based fuzzy systems with the learning capability of neural networks. Depending on the structure of if-then rules, two main types of fuzzy models are distinguished as mamdani (or linguistic) and takagi-sugeno models [18]. The mamdani model is typically used in knowledge-based (expert) systems, while the takagi-sugeno model is used in data-driven systems
In this paper, we consider only the Takagi - Sugeno-Kang (TSK) model. Takagi, Sugeno and Kang [18] formalized a systematic approach for generating fuzzy rules from input-output data pairs. The fuzzy if-then rules, for the pure fuzzy inference system, are of the following form:
if x1isA1andx2isA2 andxNisAN theny f(x) (4)
Where T N
N A A A
x x x
x[ 1, 2,..., ] , 1, 2,, fuzzy sets are in
the antecedent, while
y
is a crisp function in the consequent part. The function is a polynomial function of input variablesN
x
x
x
x
1,
2,
3,
,
. The aggregated values of the membershipfunction for the vector are assumed either in a form of the MIN operator or in the product form. The M fuzzy rules in the form Eq. (4) are N membership functions
1,
2,
3,,
N. Each antecedent is followed by the consequent:
N j j ij ii p p x
y
1
0
(5)
Where
p
ij are the adjustable coefficients, forM
i1,2,3,, and j 1,2,3,,N.
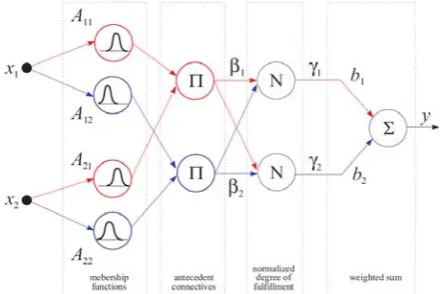
The first-order TSK fuzzy model could be expressed in a similar fashion. Consider an example with two rules:
20 2 22 1 21 2 22 2 12 1 10 2 12 1 11 1 21 2 11 1 p x p x p y then and A is x and A is x if p x p x p y then and A is x and A is x if
corresponding network is given in Figure 2. Applying fuzzy singleton, a generalized bell function such as membership function and algebraic product aggregation of input variables, at the existence of M rules the Neurofuzzy TSK system output signal upon excitation by the vector, is described by:
Fig.2 An example of a first-order TSK fuzzy model with two rules systems [1]
M
k
N
j j kj k
j r N j M
r r j
N j
x p p
x x x
y
1 1
0 1
1 1
) (
)] ( [
1 )
(
(6)
The adjusted parameters of the system are nonlinear parameters of bell function ( ( )
,
( ),
(k)j k j k
j
b
c
), the fuzzifier functions and linear parameters (weight) of the TSK function for every j1,2,,N and k1,2,,M . In contrast to themamdani fuzzy inference system, the TSK model generates crisp output values instead of fuzzy ones. This network is simplified. Thus, the defuzzifier is not necessary. So, the learning of the Neurofuzzy network, which adapts parameters of the bell shape membership functions ( ( )
,
( ),
(k)j k j k
j
b
c
)and consequent coefficients,
p
ij can be done either in supervised or self-organizing modes. In this study, we apply a hybrid method which is a one-shot least-squares estimation of consequent parameters with iterative gradient-based optimization of membership functions. The important problem in the TSK network is to determine the number of rules that should be used in modeling data. More rules mean better representation of data processing, but increased complexity of the network and a high cost of data processing. Therefore, a procedure for automatically determining the number of rules is required. In our solution, each rule should be associated with one cluster of data. Fuzzy c-means is a supervised algorithm, because it is necessary to indicate how many clusters C looks for. If C is not known beforehand, it is necessary to apply an unsupervised algorithm. Subtractive clustering is based on a measure of the density of data points in the feature space [1]. The idea is to find regions in the feature space with high densities of data points. The point with the highest number of neighbors is selected as the center for acluster. The data points within a prespecified data, fuzzy radius are then removed (subtracted), and the algorithm looks for a new point having the highest number of neighbors. This process continues until all data points are examined.
[image:3.595.62.284.144.291.2]In conclusion, Figure 3 summarizes the Neurofuzzy Networks System (NFs). Construction process data called “training data sets,” can be used to construct Neurofuzzy systems. We do not need prior knowledge ala “knowledge-based (expert) systems”. In this way, the membership functions of input variables are designed by the subtractive clustering method. Fuzzy rules (including the associated parameters) are constructed from scratch by using numerical data. And the parameters of this model (the membership functions, consequent parameters) are then fine-tuned by process data.
Fig. 3 Constructing Neurofuzzy Networks
III. METHODOLOGY FOR THE INTELLIGENCE PORTFOLIO MANAGEMENT SYSTEM
A. Decision-Making Model for the Stock Market System
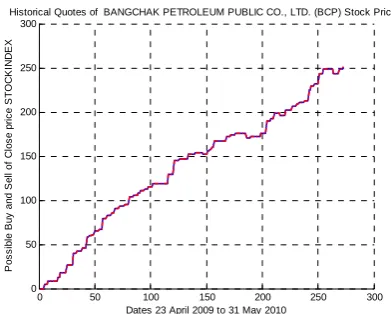
Many stock market traders use conventional statistical techniques for decision-making in purchasing and selling [7]. Popular techniques use fundamental and technical analysis. They are more than capable of creating net profits within the stock market, but they require a lot of knowledge and experience. Because stock markets are affected by many highly interrelated economic, political and even psychological factors, and these factors interact with each other in a very complex manner, it is generally very difficult to forecast the movements of stock markets (see Figure 4). Figure 4 shows historical quotes of Bangchak Petroleum Public Co., Ltd. (BCP) stock prices. It is a high nonlinear system. In this paper, we are working on one day decision making for buying/selling stocks. For that we are developing a decision-making model, besides the application of an intelligence system. We selected a Neurofuzzy system (NFs), which are now studied and incorporated into the emerging and promising field of financial engineering [2, 8, 10, 14].
We proposed NFs for our decision-making model, which we call Intelligence Trading System. The model scenario represents one time calculations made in order to produce decisions concerning the trading of stocks. For this paper, historical data of daily stock returns was used for the time interval. In the first step of the model realization, technical analysis techniques are used for the decision strategy recommendation. The recommendations (R) represent the
Experts
Fuzzy Inference System N
e u r o ‐ F u z z y
S y s t e m
Input
Output
(If – Then Rule, Fuzzy Reasoning)
Training
Data
Test
Data Tuning(NN)
System
evaluation (errors) Membership
Functions
Subtractive
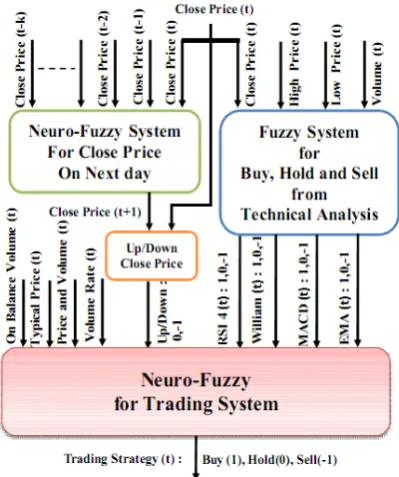
relative rank of investment attraction to each stock in the interval [−1, 1]. The values −1, 0, and 1 represent recommendations: Sell, Hold and Buy, respectively. After that, the recommendations are included in the input of our proposed intelligence system. The intelligence system output is the evaluating recommendation based on several decided courses of action from various technical techniques used by investors. The proposed Fuzzy Logic and NFs for the intelligence trading system are shown in Figure 5.
Fig. 4 Historical Quotes of Bangchak Petroleum Public Co., Ltd. (BCP) Stock Prices
B. Preprocessing of the Proposed NFs Input
Technical analysts usually use indicators to predict future buy and sell signals. The major types of indicators are Moving Average Convergence/Divergence (MACD), Williams’s %R (W), Relative Strength Index (RSI), Exponential Moving Average (EMA), On Balance Volume, etc., and they correspond on close price and volume. These indicators can be derived from the real stock composite index. Each indicator is included in the input signal for the intelligence system. And, the target for training is the buy and sell signal as shown on fig. 5.
For daily data, indicators can help traders identify trends and turning points. The moving average is a popular and simple indicator for trends. Stochastic and RSI are some simple indicators which help traders identify turning points. Some example indicators are defined as follows,
) (
) (
1
100 100
change negative
change positive RSI
(7)
In general, stock price data has a bias due to differences in name and spans. Normalization can be used to reduce the range of the data set to values appropriate for inputs to the activation function being used. The normalization and scaling formula is
min) (max
min) (max 2
x
y , (8)
Where
xis the data before normalizing,
yis the data after normalizing.
Fig. 5 The scenario of decision-making model
Because the index prices and moving averages are in the same scale, the same maximum and minimum data are used to normalize them. The max is derived from the maximum value of the linked time series; similarly minimum is derived from the minimum value of the linked time series. The maximum and minimum values are from the training and validation data sets. The outputs of the neural network will be rescaled back to the original value according to the same formula.
C. Evaluating Function for the NFs Decision-Making Model
For NFs portfolio management, the expected returns are calculated considering the stock market. That is, the value obtained on the last investigation day is considered the profit. The traders‘s profit is calculated as
Profit(n) = Stock Value(n) - Investment value (9) Where n is the number of trading days.
And the Rate of Return Profit (RoRP) is
Profit(n)
RoRP 100
Investment value
(10) IV. RESULTS AND DISCUSSION
The model realization could be run using different groups of stocks (like a Banking group, Energy group, etc.), indexes, or other groups of securities. For that, we are using market orders, as it allows for the simulation of buying stocks, when the stock exchange is nearly closed. All the experimental investigations were run according to the scenario presented above, and were focused on the estimation of Rate of Return Profit (RoRP). At the beginning of each realization, the start investment is assumed to be 1,000,000 Baht (Approximately USD 29,412). The data set, including the Stock Exchange of Thailand (SET) index, Historical Quotes of Bangchak Petroleum public Co., Ltd. (BCP) Stock Prices, Siam
23-Apr-200910 22-Sep-2009 21-Feb-2010 23-Jul-2010
11 12 13 14 15 16
Dates 1 December 2009 to 31 May 2010
C
los
e P
ri
c
e o
f S
T
O
C
K
IN
D
E
X
[image:4.595.66.273.195.355.2]Commercial Bank (SCB) and Petroleum Authority of Thailand (PTT) stock index, has been divided into two different sets: the training data and test data. The stock index data is from April 23, 2009 to July 23, 2010 totaling 304 records. The first 274 records are training data, and the rest of the data, i.e., 30 records, will be test data. Moreover, the data for stock prices includes the buy-sell strategy, closing price and its technical data. Consequently, max-min normalization can be used to reduce the range of the data set to appropriate values for inputs and output used in the training and testing method.
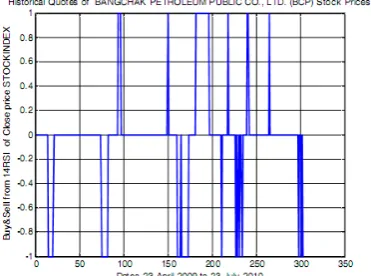
Fig. 6 The 14 periods RSI index (RSI14 (t)), calculated close price (t)
A. Input Variables
[image:5.595.68.269.205.370.2]Technical indexes are calculated from the variation of stock price, trading volumes and time, according to a set of formulas to reflect the current tendency of the stock price fluctuations. These indexes can be applied for decision making in evaluating the phenomena of an oversold or overbought stock. For input data, several technical indexes are described as shown in Table 1. There are 12 total inputs and only one output.
Fig. 7 The Buy (1), Hold (0), Sell (-1) evaluated by RSI14(t)
[image:5.595.77.263.516.654.2]
Table 1 Input of NFs portfolio management
B. Evaluating Decision-Making System Based on
Neurofuzzy Model
We now compare the performance of our proposed NFs with NNs, including three types of learning algorithm methods. The learning methods are the Batch Gradient Descent (TRAINGD), Scaled Conjugate Gradient (TRAINSCG), and Levenberg-Marquardt (TRAINLM) methods. The neural network model has one hidden layer with 30 nodes. And, learning iteration is 10000 epochs. After we trained their learning method, we found scaled conjugate better than other learning methods. Actually, we can conclude that our proposed Neurofuzzy demonstrated four relation types considerably better than the NNs with scaled conjugate gradient learning.
After developing the intelligence trading system, we were given 1,000,000 baht for investment at the beginning of the testing period. The decision to buy and sell stocks is given by the proposed intelligence output. We translated the produced RoRP results that verify the effectiveness of the trading system. Table 2 shows a Financial Simulation Model for calculating profit in our trading strategy. Results from the training days and testing days are shown in Figure 7 and 8, respectively.
Moreover, our proposed decision-making NFs model compared RoRP performance with Buy & Hold Strategy and NNs. The antithesis of buy and hold is the concept of day trading in which money can be made in the short term if an individual tries to short on the peaks, and buy on the lows with greater money coming with greater volatility.
The performance of each stock index is illustrated on Table 3. It reflects the performances of investment strategies in the NN, buy and hold, and NFs model, respectively. Each line implies the performance of the NFs system in terms of cumulative profit rate of return gained from each stock index. In the case of experimental results, NFs display a greater rate of return than the “buy, sell and hold” model and NN model. The results differences in the stock index results are small. It is more valuable to calculate the loss and gains in terms of profitability in practice.
NO. DESCRIPTION
1 Clos e price (t) 2 Typical price (t)
3 Volume rate of change (t) 4 Price and Volume Tre nd (t) 5 Price rate of change 12 (t) 6 On-Balance Volume (t) 7 Buy & Se ll from RSI 4 Days (t) 8 Buy & Se ll from RSI 9 Days (t) 9 Buy & Se ll from RSI 14 Days (t) 10 Buy & Se ll from William 10 Days (t) 11 Buy & Se ll from MACD 10 Days (t) 12 Buy & Se ll from EMA 10 and 25 Days (t)
1 Buy(1), Hold(0) and Se ll(-1) INPUT
Fig. 8 Comparison profit between Possible Rate of Return Profit (Possible RoRP) and Profit from our proposed NFs Trading System in Training Days
[image:6.595.53.283.493.618.2]Fig. 9 Comparison profit between Possible Rate of Return Profit (Possible RoRP) and Profit from our proposed NFs Trading System in Testing Days.
Table 2Example ofFinancial Simulation Model in trading strategy
Table 3 Rate of Return Profit (RoRP) gained from each trading stock index
V. CONCLUSION
This paper presented our decision-making model based on the application of NFs. The model was applied in order to make a one-step forward decision, considering historical data of daily stock returns. The experimental investigation has shown our NFs trading system formulates a trading strategy which achieves more stable results and higher profits when compared with NNs and the Buy and Hold strategy. For future work, several issues could be considered. Other techniques, such as support vector machines and genetic algorithms can be applied for further comparisons. Other stock index groups, stock exchanges, or industries could be considered for further comparisons as well.
ACKNOWLEDGMENTS
We would like to thank everyone who added their insight for the creation of this paper, and also thank conference participants for their helpful comments and valuable discussions. We would also like to thank the Graduate Fund for Ph.D. Students, Rangsit University, Pathumthanee, Thailand for their assistance.
REFERENCES
[1] Babuska, A. R., (2002) ‘ Neuro-fuzzy methods for modeling and identification’, Recent Advances in intelligent Paradigms and Application, pp. 161–186.
[2] Cardon, O., Herrera, F. and Villar, P. (2000) ‘Analysis and Guidelines to Obtain A Good Uniform Fuzzy rule Based System Using simulated Annealing’, , Int’l J. of Approximated Reason 25, No. 3, pp. 187–215. [3] Chapman, A. J. (1994) ‘Stock market reading systems through neural
networks: developing a model’ , Int’l J. of Apply Expert Systems, Vol. 2, No. 2 pp. 88-100
[4] Chen A.S., Leuny, M.T., and Daoun, H. (2003) ‘Application of Neural Networks to an Emerging Financial Market: Forecasting and Trading The Taiwan Stock Index’, Computers and Operations Research, Vol. 30, pp. 901 – 902.
[5] Conner, N.O. and Madden, M. (2006) ‘A Neural Network Approach to Pre-diction Stock Exchange Movements Using External Factor’, Knowledge Based System, Vol. 19, pp. 371 – 378.
[6] James N.K. Liu and Raymond W.M. KWong (2006) ‘Automatic Extraction and Identification of chart Patterns Towards Financial Forecast’, Applied soft Computing, Vol. 1, pp. 1 – 12.
[7] Doeksen, B., Abraham, A., Thomas, J. and Paprzycki, M. (2005) ‘Real Stock Trading Using Soft Computing Models’, IEEE Int’l Conf. on Information Technology: Coding and Computing, Las Vegas, Nevada, USA, pp. 123-129.
[8] Dutta, S. and Shekhar, S. (1990) ‘Bond rating: A non-conservative application of neural networks’, IEEE Int’l Conf. on Neural Networks, San Diego, CA , USA, pp. 124 – 130.
[9] Farber, J.D. and Sidorowich, J.J. (1988) ‘Can new approaches to nonlinear modeling improve economic forecasts? ’, The Economy As An Evolving Complex System, pp. 99–115.
[10] Hiemstra, Y. (1995) ‘Modeling Structured Nonlinear Knowledge to Predict Stock Markets: Theory’, Evidena and Applications, Irwin, pp. 163–175.
[11] Hutchinson, J. M., Lo, A and Poggio, T. (1994) ‘A nonparametric approach to pricing and hedging derivative securities via learning networks’, Int’l J. of Finance, Vol. 49, pp. 851-889.
[12] James, N.K., Raymond, W.M. and Wong, K. (2006) ‘Automatic Extraction and Identification of chart Patterns towards Financial Forecast’, Applied soft Computing, Vol. 1, pp. 1 – 12.
[13] LeBaron, B. and Weigend, A. S. (1994) ‘Evaluating neural network predictors by bootstrapping’, Int’l Conf. on Neural Information Process, Seoul, Korea, pp. 1207–1212.
[14] Radeerom, M., Srisa-an, C., K., Kasemsan M. L.K. (2008) ‘Prediction Method for Real Thai Stock Index Based on Neurofuzzy Approach’, Lecture Notes in Electrical Engineering : Trends in Intelligent Systems and Computer Engineering, Vol. 6, pp. 327–347.
0 50 100 150 200 250 300
0 50 100 150 200 250 300
Historical Quotes of BANGCHAK PETROLEUM PUBLIC CO., LTD. (BCP) Stock Prices
P
os
s
ibl
e B
uy
a
nd S
el
l
o
f C
los
e pri
c
e
S
T
O
C
K
IN
D
E
X
Dates 23 April 2009 to 31 May 2010
0 5 10 15 20 25 30
0 0.5 1 1.5 2 2.5 3 3.5 4 4.5 5
Historical Quotes of BANGCHAK PETROLEUM PUBLIC CO., LTD. (BCP) Stock Prices
P
os
s
ibl
e B
uy
a
nd S
el
l
o
f C
los
e pri
c
e
S
T
O
C
K
IN
D
E
X
Dates 1 June 2010 to 23 July 2010
Stock
Index # of Shared Cash(Baht) # of Shared Cash(Baht)
12.00
1 STAY ‐ 1,000,000.00 1 STAY ‐ 1,000,000.00
12.00
0 HOLD ‐ 1,000,000.00 1 HOLD ‐ 1,000,000.00
12.00
1 BUY 83,333 0 HOLD ‐ 1,000,000.00
12.50
0 HOLD 83,333 1 BUY 80,000 ‐
13.00
‐1 SELL ‐ 1,083,329.00 0 HOLD 80,000 12.70
0 HOLD ‐ 1,083,329.00 0 HOLD 80,000
12.60
0 HOLD ‐ 1,083,329.00 0 HOLD 80,000
12.55
0 HOLD ‐ 1,083,329.00 ‐1 SELL ‐ 1,004,000.00
12.45
0 HOLD ‐ 1,083,329.00 0 HOLD ‐ 1,004,000.00
12.40
1 BUY 87,365 0 HOLD ‐ 1,004,000.00
12.45
‐1 SELL ‐ 1,087,694.25 ‐1 SELL ‐ 1,004,000.00
….. … …… ……. …… … …… ……. ……
Action Action
Possible Buy&Hold NFs Buy & Sell
STOCK INDEX STOCK GROUP
Possible NN NF Buy & Hold
BCP Energy 254 240 254 50
PTT Energy 320 300 320 80
SCB Banking 180 160 180 70
STOCK INDEX STOCK GROUP
Possible NN NF Buy & Hold
BCP Energy 4.5 3.3 4.3 0.8
PTT Energy 7.1 4.5 6.9 1.5
SCB Banking 3.2 2.1 2.9 0.5
Profits of Training Day (274 Days), (%)
![Fig 1 A feedforward neural network with one hidden layer [19]](https://thumb-us.123doks.com/thumbv2/123dok_us/1285898.657402/2.595.76.261.171.301/fig-feedforward-neural-network-hidden-layer.webp)