International Journal for Research in Applied Science & Engineering Technology (IJRASET
)
ISSN: 2321-9653; IC Value: 45.98; SJ Impact Factor: 6.887 Volume 6 Issue VI, June 2018- Available at www.ijraset.com
Detection and Classification of Leukaemia using
Artificial Neural Network
Prasidhi G. Fal Desai1, Geeta Shet2
1, 2
Department of Electronics and Telecommunication, Goa College of Engineering
Abstract: Blood is the very important biological fluid present in human beings, which has various functions. Leukaemia is a blood disease which affects the normal functioning of the blood. The number of cases of leukaemia reported every year in India is approximately close to 1 million. Detection and classification of Leukaemia into its subtypes manually by humans is difficult and time consuming. Hence an automatic system to identify and classify Leukaemia may overcome this drawback. Technique proposed in this paper aims at quick detection of leukaemia images, and classifies them into their respective subtype. This is achieved using image processing with the help of MATLAB software. Images used are microscopic blood smear images. Using K- means clustering algorithm images are segmented and a Artificial Neural Network (ANN) is designed based on the features extracted. This neural network is trained to classify the images into their respective type.
Keywords: Leukaemia, segmentation, Artificial Neural Network
I. INTRODUCTION
Leukaemia originates in the blood cells and produces a large number of abnormal white blood cells. This affects normal blood cells. And as a result ability of blood cells to fight against infections and other diseases reduces. Leukaemia has main four subtypes, which are Acute Lymphocytic Leukaemia (ALL), Acute Myelogenous Leukaemia (AML), Chronic Lymphocytic Leukaemia (CLL) and Chronic Myleginous Leukaemia (CML).
Traditionally leukaemia disease is detected manually by experts under microscope. This manual examination of the disease is time consuming, costly and totally depends on expert’s knowledge and skills. Since leukaemia shows symptoms which resembles to normal minor disease it is very difficult to indentify it at very first stage. It is very important to identify it at early stages. Hence manual examination methods are not suitable.
Detection of leukaemia and its classification using an automated system may overcome the drawbacks of the traditional methods. Using a digital image processing it is possible to detect the leukaemia image and classify it into its respective type. Different types of image processing algorithms have been designed and developed to detect the leukaemia cells in the images. Microscopic blood cell images of different types of leukaemia are taken as the input to these systems. Image processing is composed of various techniques such as image pre-processing, image segmentation, feature extraction and classification. Segmentation and classification are very important steps in image processing. Classification accuracy depends on the correct segmented outputs.
This paper proposed a computer based system for correct identification of leukaemia images. K-means algorithm is used to segment the leukaemia images. Artificial neural network is designed and created for classification purpose. ANN is trained based on the features extracted from the image dataset.
Sos Agaian, Monica Madhukar, and Anthony T. Chronopoulos, in [1] suggest leukaemia image segmentation using k-means clustering algorithm. Mashiat Fatma, Jaya Sharma, in [2], proposed a system for leukaemia classification using neural network.
II. PROCESS OVERVIEW
Fig.1. Basic block diagram of proposed technique.
A. Input
Digital image processing uses images as its input. These images can be real time images or pre captured stored images. Images are stored in the matrix form hence it becomes easy to work with image data in the MATLAB. In this proposed system images taken are microscopic blood smear images. These images are obtained from online database. Total 50 images are used.
B. Image Pre-Processing
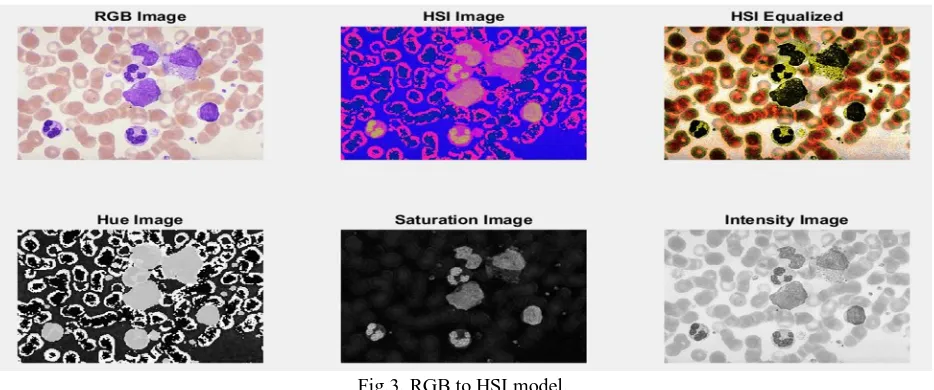
Image pre-processing step is the very first step where different operations are performed on the image. At these step images are adjusted, enhanced, filtered to make the image suitable for further processing. In the proposed method image is converted to gray scale, reshaped and resized wherever it is needed. The RGB image is converted to Hue Intensity saturation (HIS) colour model. The saturation image is then used later for further processing.
C. Image Segmentation
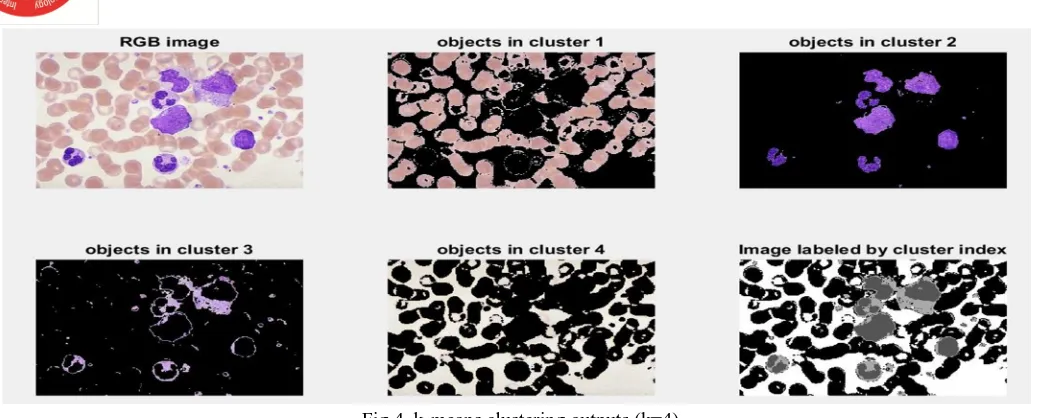
Segmentation is the most important step in any image processing algorithm. Segmentation process aims to give only the desired part from the entire image. In this case it partitions the leukaemia cells from the rest of the image. There are various segmentation algorithms. And lot of research is going on segmentation algorithms. The accuracy of further steps that is feature extraction and classification totally depends on the segmented output. In this proposed system k-means clustering algorithm is used for segmenting the leukaemia cells.
K-means clustering divides the image into k number of clusters. This k value has to be pre-assigned in the system. In this k value is selected as 4. This value is selected for the used dataset by trying and testing. This value might change for different datasets.
D. Feature Extraction
Once image is segmented, segmented output image is used for feature extraction. Features of segmented image are extracted and used for classification. There are various types of features those can be extracted. Depending on the type of results required features are selected. In the proposed system statistical features those are extracted are energy, covariance, sum entropy, entropy, difference entropy, contrast, and correlation and information measure of correlation. These extracted features are used to train the Artificial Neural Network.
E. Classification
International Journal for Research in Applied Science & Engineering Technology (IJRASET
)
ISSN: 2321-9653; IC Value: 45.98; SJ Impact Factor: 6.887 Volume 6 Issue VI, June 2018- Available at www.ijraset.com
ready to classify the test images. Accuracy of ANN is totally depends on the correct training. It learns from the training dataset hence the dataset has to be correct.
F. Graphical User Interface (GUI)
GUI is the tool available in MATLAB which allows code to be executed step wise. GUI makes it user friendly. And any non professional can use it easily.
III.EXPERIMENTAL RESULTS
[image:3.612.57.573.227.424.2]An automated system to detect leukaemia cells and classify it into their respective type is designed and created successfully . Images are segmented using k-means segmentation algorithm. Various features are extracted successfully. Using these features a multilayer feed forward ANN network is trained. Total 38 images are used for training the ANN network. Following figures show the obtained results.
[image:3.612.80.547.488.683.2]Fig.2. GUI display showing selected image
Figure 2 shows the GUI that is created for the proposed system. It has various push buttons. Once the present step is executed only then next push button enables. “Select image” allows browsing and selecting the image from the folder. Figure 2 shows the selected image. Once image is selected “RGB to HSI” button is enabled.
Fig.3. RGB to HSI model.
Fig.4. k-means clustering outputs (k=4).
Figure 4 shows k-means clustering output. K value is taken as 4 for the used dataset. It shows all four cluster of the selected image.
Fig.5. Detected CML cluster.
Figures 5, 6, 7 and 8 show obtained results. It shows the detected cluster and its type for four different images.
International Journal for Research in Applied Science & Engineering Technology (IJRASET
)
ISSN: 2321-9653; IC Value: 45.98; SJ Impact Factor: 6.887 Volume 6 Issue VI, June 2018- Available at www.ijraset.com
Fig.7. Detected ALL image.
Fig.8. Detected CLL image.
IV.CONCLUSION
In this paper we have proposed a technique for detection and classification of Leukaemia into its types. For this k means clustering is used for segmentation. K value has been selected as 4. It gives 95% of segmentation accuracy for the used dataset. Various statistical features are extracted for classification purpose. ANN network is designed and trained for classification. 38 images have been used for training purpose. It gives 94.7% of classification accuracy. K-means algorithm has a drawback that it needs user to pre assign the k value. More work can be done to overcome this drawback. Larger dataset can be used and applied to the system in order to test the results. Different segmentation and classification algorithms can be used.
REFERENCES
[1] Sos Agaian, Senior Member, IEEE, Monica Madhukar, and Anthony T. Chronopoulos, Senior Member, IEEE “Automated Screening System for Acute Myelogenous Leukemia Detection in Blood Microscopic Images” IEEE SYSTEMS JOURNAL, 2014 IEEE.
[2] Romel Bhattacharjee, Lalit Mohan Saini, “Robust Technique for the Detection of Acute Lymphoblastic Leukaemia” 2015 IEEE Power, Communication and Information Technology Conference (PCITC) Siksha O Anusandhan University, Bhubaneswar, India.
[3] Mashiat Fatma, Jaya Sharma, “Identification and Classification of Acute Leukemia Using Neural Network”, 2014 International Conference on Medical Imaging, m-Health and Emerging Communication Systems (MedCom).
[5] Jakkrich Laosai and Kosin Chamnongthai, “Acute Leukemia Classification by Using SVM and K-Means Clustering”, Proceedings of the International Electrical Engineering Congress 2014
[6] Ashwini Rejintal, Aswini N, “Image Processing Based Leukemia Cancer Cell Detection”, IEEE International Conference On Recent Trends In Electronics Information Communication Technology, May 20-21, 2016, India.
[7] Ansha Beevi S.1, Remya R.S.2, “An Overview on Acute Lymphocytic Leukemia Detection using Cell Image Segmentation”, IOSR Journal of Computer Engineering (IOSR-JCE) e-ISSN: 2278-0661,p-ISSN: 2278-8727, PP 22-29.
[8] Mausumi Maitra, Rahul Kumar Gupta, Manali Mukherjee, “Detection and Counting of Red Blood Cells in Blood Cell Images using Hough Transform”, international Journal of Computer Applications (0975 8887) Volume 53 No.16, September 2012.
[9] A.S.Abdul Nasir, M.Y.Mashor, H.Rosline, “Unsupervised Colour Segmentation of White Blood Cell for Acute Leukaemia Images”, 2011 IEEE Conference. [10] Rupinder Kaur Sandhu, Dr. Raman Maini, “Automated Detection of Leukaemia”, Volume 8, No. 5, May-June 2017 International Journal of Advanced
Research in Computer Science.
[11] Malwinder singh1,Meenakshi bansal 2,” A Survey on Various K-Means algorithms for Clustering”, IJCSNS International Journal of Computer Science and Network Security, VOL.15 No.6, June 2015.
[12] Biplab kanti das, Krishna kumar jha, Himadri sekhar dutta, “A New approach for Segmentation and Identification of Disease Affected Blood Cells”, 2014 International Conference on Intelligent Computing Applications.
[13] Rege M.V.1, Dr.B.W. Gawli2, “Detection of Leukemia in Human blood sample through Image Processing”, A Review IJMTER-2015
[14] J.Hari,A.Sai Prasad,S.Koteswara Rao, “Separation and Counting of Blood cells using Geometrical Features and Distance Transformed Watershed”, 2014 2nd International Conference on Devices, Circuits and Systems (ICDCS).
[15] S. Pavithra, J. Bagyamani, “White Blood Cell Analysis Using Watershed and Circular Hough Transform Technique”, International Journal of Computational Intelligence and Informatics, Vol. 5: No. 2, September 2015.
[16] Tapas Kanungo, Senior Member, IEEE, David M. Mount, Member, IEEE, Nathan S. Netanyahu, Member, IEEE, Christine D. Piatko, Ruth Silverman, and Angela Y. Wu, Senior Member, IEEE, “An Efficient k-Means Clustering Algorithm; Analysis and Implementation”, IEEE TRANSACTIONS ON PATTERN ANALYSIS AND MACHINE INTELLIGENCE, VOL. 24, NO. 7, JULY 2002.
[17] S.Kareem, R.C.S Morling and I.Kale, “A Novel Method to Count the Red Blood Cells in Thin Blood Films”, 2011 IEEE.
[18] Yogesh Karunakar, Dr. Alhad Kuwadekar, “An unparagoned application for Red Blood Cell Counting using Marker Controlled Watershed Algorithm for Android mobile.”, 2011 Fifth International Conference on Next Generation Mobile Applications and Services.
[19] Mr. Dixit Kolhatkar, Ms. Nisha Wankhade, “Detection and Counting of Blood Cells using Image Segmentation: A Review”, 2016 World Conference on Futuristic Trends in Research and Innovation for Social Welfare (WCFTR16).