Classification by Object Recognition in Satellite
Images by using Data Mining
Muhammad Shahbaz, Aziz Guergachi, Aneela Noreen, Muhammad Shaheen
Abstract— In this paper, an approach for classification of satellite images has been presented. Satellite images are rich in geographical information. Geographical information can be used in a number of ways. Our purposed system does classification of satellite images. In the classification of images, an important step is recognition of objects from the satellite image. We proposed a technique for recognizing objects from satellite image. For object recognition, we extracted attributes from satellite images under two domains: Organization of color pixels and pixel intensity. Extracted attributes helps to identify objects that lies inside the satellite image. On the basis of the identified objects, we classified satellite images with the help of decision tree. The system has been tested for 42 satellite images that are acquired from different areas of the world. The results showed an accuracy of 80% .Accuracy can be boosted up by adding more samples and objects in training phase.
Index Term—classification of images, data mining, decision tree, object recognition, satellite images
I. INTRODUCTION
Remotely sensed images have a lot of geographical information inside it. Geographical information can be useful for different sectors like government, business, science, engineering and research institutes. Geographical information can be used for city and regional planning, analysis of natural resources in an area and improvement in vegetation of an area. These are few examples but there can be gazillions of its advantages.
Manuscript received February 22, 2012; revised March 20, 2012. This work was supported in part by NSERC (Natural Science and Engineering Research of Canada). and Higher Education Commission (HEC) Pakistan.
M. Shahbaz is with Department of Computer Science and Engineering, University of Engineering and Technology, Lahore, Pakistan.
[email protected]. He is currently on Sabbatical Leave at Information Technology Management, TRS,Ryerson University,Toronto,
ON, Canada [email protected]
A. Guergachi is with Information Technology Management, TRS,Ryerson
University,Toronto, ON, Canada [email protected]
M. Shaheen is with Department of Computer Science,University of Arid
Agriculture,Rawalpindi, Pakistan [email protected]
A. Noreen was with Department of Computer Science and Engineering,
Remotely sensed images that we can acquire through sensors, radars and satellites are very large in numbers. As technology advances, such as image digitization and storage, quantity of images has also improved [2]. Each image has a lot of information inside it. Each image can have a number of objects. It is very difficult for any human to go through each image and extract and store useful patterns. An automatic mechanism is needed to extract objects from the image and then do classification of the image.
A number of techniques have been proposed for object recognition. Adnan A. Y. Mustafa [1] proposed an object recognition scheme by matching boundary signature. For this purpose, he introduced four boundary signatures: the Curvature Boundary Signature (SCB), the Direction Boundary Signature (SAB), the Distance Boundary Signature (SDB) and the Parameter Boundary Signature (SPB). These signatures can be constructed by using boundary’s local and global geometric shape attributes. This approach is based on the shape of the object. For shape of object, boundary of object is required to compute. But some objects don’t have distinct boundaries. Soil, ecological zone are good examples that don’t have distinct sharp boundaries.
Ender Ozcan et al. [3] proposed a methodology for partial shape matching by using genetic algorithms. For this purpose, they described features of model shapes in form of line segments and angles. For recognition purpose, they matched input shape with model shapes. In search, GAs uses a population of individuals of fixed size. New solutions can be produced by using operators.
Farzin Mokhtarian et al. [4] proposed a method that was based on the maxima of curvature zero crossing contours. They used it for representing it as feature vector of Curvature Scale Space (CSS) image that can be used for describing the shapes of object boundary counters. In their purposed matching algorithm, they compared two sets of maxima. Then they assigned a matching value as a measure of similarity.
They used resulting pixel error after projective refinement to prove whether a generated hypothesis is true or false.
For recognizing objects, Mariana Tsaneva et al. [6] used transform methods e.g. Gabor filter and wavelet transform for texture analysis. The drawback of this technique is that wavelet performance is not satisfactory in image processing when bandwidth is not high and images are in compressed form.
Jean-Baptiste Bordes et al. [7] prescribed an algorithm that integrates an angular local descriptor and radial one. It also used the co-efficient that are produced as a result of the Fourier analysis. Their proposed algorithm work for roundabout detection but it is not for general object detection. Secondly proposed methodology is not fast enough.
Jiebo Luo et al. [8] proposed a methodology for characterizing satellite images that was based on the color- and structure-based vocabularies. The drawback of this methodology is usage of larger vocabulary. Large vocabulary provides only small gain in accuracy but it requires a greater computation cost.
Most of the object recognition algorithms don’t produce satisfactory results when boundaries of the objects are not constant, clear and sharp enough. Desert, sea and ecological zone are well known examples of such objects that don’t have distinct boundaries. [2] So we propose a methodology that is independent of the shape of the object.
In our proposed object recognition methodology, we shall focus on two major domains that are: pixel intensity and
organization of color pixels. We shall use these two domains to calculate the attributes from the image. Decision tree shall be helpful for taking decision about the object by using attributes that are extracted from the image for object recognition. The attributes shall be stored in a database that shall serve as knowledge base which will be useful for classification of satellite images based on similarities.
II. SYSTEM DESCRIPTION
Our system has two modes, one of them is the operational mode and another one is training mode.
In training mode, we used a number of sample images for each object. We acquired the sample images of the objects from the Google Earth. After acquiring the images, we employed the pixel intensity and organization of color pixels to each image. As a result of employment of pixel intensity and organization of color pixels on each image, we extracted attributes from each image and then these attributes were stored in the database. Based on the result of Pixel Intensity and Organization of Color Pixels, we make a decision tree that shall be helpful for object recognition from new incoming images.
[image:2.595.73.531.417.709.2]In operational mode, we provide a satellite image that has some objects. We employee the pixel intensity and organization of color pixels to incoming satellite image and extract attributes from the image. Afterward the extracted attributes are given to decision tree for making decision about the presence of the object.
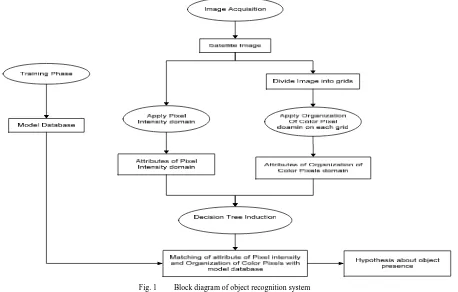
Fig. 1 Block diagram of object recognition system
Fig. 2 Block diagram of pixel intensity
In fig 1, there is a block diagram of an object recognition system. The input to the system is the satellite image. For recognizing object from satellite image, first we employed Pixel intensity to extracts attributes from the input image. We then employed Organization of color pixels on the image to extract attributes. In organization of color pixels, we divide the image into grids and for each grid we computed attributes of organization of color pixels. On the basis of the attributes extracted under the Pixel intensity domain and organization of color pixel, we have drawn ID3decision tree with the help of database established in the training mode in which an hypothesis is made about presence of objects in image.
A. Object Recognition Scheme
An object can be recognized by its form, texture and color. If we deal with the form of the object then boundary of an object is very important. In satellite image one of the major issues is the boundary of the object as some objects like soil don’t have distinct boundary [2]. To
is independent of the object boundary. Color and texture can play prominent role in object recognition because color is an important factor in object recognition rather than intensity [9]. The proposed object recognition algorithm shall get cue from color and texture of the object for making decision about the presence of the object. The algorithm is also independent of rotational, size and translational invariance.
1) Pixel intensity
Fig.2. shows all the attributes of the pixel intensity domain that are computed from satellite image that are acquired through the Google Earth.
Color histogram represents the distribution of color pixels inside the image. In simple words, we can say that the Color histogram is the counting of each color inside an image. Color histogram refers to the joint probabilities of intensities of three color channels. Color histogram can be defined as [11]:
Where R, G and B refer to three color channels and N refers to number of pixels in the image. Color histogram can be computed by counting the number of pixels of each color from an image. It is more convenient approach to converts three channel histogram into a single variable histogram. This transformation can be achieved by using the following equation [11]:
Where Nr and Ng are the number of bins for colors red and green respectively and m shall be the single variable histogram.
Histogram can be computed by using the equation[10]:
݄ሺ݉ሻ ൌ ݊
Where mk is kth single value color, nk is the number of pixels in the image having single value color mk and h(mk) is the single value color histogram .
If we deal an image that lies in RGB color space then the computation complexity of image shall be 256x256x256= 16,777,216. For reducing the computation complexity of the color space, we shall prefer to quantize the color space. We can discrete the color of the image into the finite number of bins. In our case we divide the RGB color space into 3 bins. As a result of three bins, the color of image 16777216 is quantized to the 3x3x3=27 colors. The range of bin1 lies between 0-85 intensities, range of bin2 lies between 86-172 intensities and bin 3 lies between 173-255 intensities. After quantization of RGB level, we convert three channels color into a single variable. Afterward we compute the color histogram of single color variable.
Texture of object is also useful in object recognition process. For extracting the texture information of the image, we computed the entropy of the image. Entropy is another attribute of our pixel intensity domain. Entropy is a statistical measure of randomness. Entropy can be useful for characterizing the texture of the input image. We can utilize entropy for measuring the information that lies in the signal. Entropy typically represents the uniformity [12, 13].
For computing the entropy of the image, we transform image into the gray scale. After getting the grayscale image, we shall compute the histogram of gray scale image. After computing the histogram, entropy of grayscale image can be computed by using the following equation [14]:
Another attribute of the pixel intensity domain is the mean of RGB image. Mean is the statistical measure that is used for determining the central value from the distribution of data set. Mean can be computed by the dividing sum of all elements of data set to the number of data set. We can compute the mean of RGB image by using the following equation [15]:
Another attribute of the pixel intensity domain is the standard deviation of RGB image. Standard deviation is a statistical measure that can be used for measuring the dispersion inside the data set. If we take the square root of the standard deviation then we shall acquire the variance. We can compute the standard deviation of RGB image by using the following equation [16]:
Where µ is the mean of all elements of the data set.
The last attribute of the pixel intensity domain is the variance of RGB image. Variance is a statistical measure that can be used to measure how far value lies from mean. It is used for measuring dispersion. Variance can be measured by using the following equation [15]:
After extracting all of the attributes of the pixel intensity domain, the attributes handover to the decision tree induction module that make a hypothesis about the presence of the object.
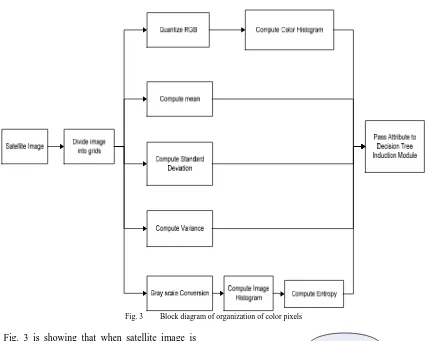
2) Organization of color pixel
For improving our object recognition method, we introduced another domain that is Organization of color pixels. In Organization of color pixels, we divide our image into the number of equal size grids and extracts useful attributes from each grid.
From each grid, we computed a number of useful attributes that might help in recognizing an object from the image. These attributes are color histogram of image, mean, standard deviation and variance of RGB color space and entropy of gray scale image.
Fig. 3 Block diagram of organization of color pixels
Fig. 3 is showing that when satellite image is provided to the system for computing the attributes of Organization of color pixels then first it is divided into number of grids and afterward all the attributes of the organization of color pixels are computed from each grid. For each grid, we shall compute quantized color histogram, mean, standard deviation, variance and entropy.
After extracting all of the attributes of organization of color pixel from each grid of an image, the attributes are mapped in a decision tree induction module that makes an hypothesis about the presence of the object.
3) Decision tree induction
This module is helpful in making decision about the object inside an image. We stored the evaluated attributes in a database.
In training phase, a number of objects for each class are taken. For each object belonging to a certain class we extracted the attributes under pixel intensity domain and organization of color pixels. These all attributes are helpful for recognizing objects from satellite image. After acquiring attributes from training phase, we make a decision tree that shall be helpful for making
B. Classification Of images
The images are extracted from Google Earth and rectified for classification purposes. The objects from the image are recognized on the basis of algorithm proposed in Section 3. Afterward recognized objects are passed to a decision tree that makes a decision in which class satellite image lies. We generalized our image classification scheme to determine if hydrocarbons are present in a particular area or not.
Fig.4. shows the block diagram of the image classification scheme. First of all we shall recognize objects from a satellite image then passed identified object to a decision tree that make a decision either hydrocarbons is present in that area or not.
C. Summary of Algorithm
We can summarize our proposed algorithm as: 1. Acquire the satellite image from the Google
earth.
2. Apply Pixel intensity domain on satellite image for calculating attributes under Pixel Intensity domain .
3. Apply Organization of Color Pixel domain
on satellite image. For this purpose, we divide our satellite image into a number of grids and calculate attribute of each grid.
4. Pass calculated attributes from Step 2 and 3 to the decision tree.
5. Decision tree makes a decision about the presence of the objects inside the image.
6. After identification of the object,
information is passed over to the classification module
7. Classification module has a decision tree that makes a decision about the presence of the hydrocarbon inside an area.
III EXPERIIMETNS AND RESULTS
For verifying our purposed scheme, we focused on five classes of objects that are tree, greenery, water, soil and rocks.
[image:6.595.55.506.295.668.2]For performing experiment, we took a number of satellite images from Google Earth. Some of them are shown in Fig. 5 (on next page):
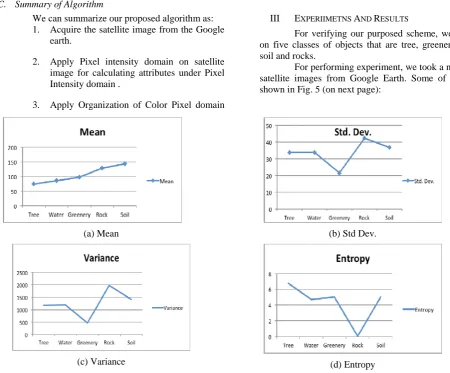
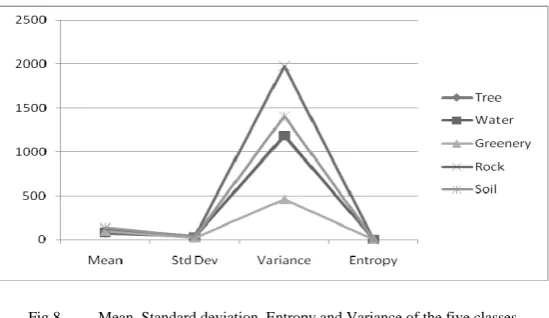
Fig 6. Attributes of Pixel intensity domain (a) Mean of RGB of the five classes (Tree, Water, Greenary, Rock and Soil) (b) Standard deviation of RGB
of the five classes (c) Variance of RGB of the five classes and (d) Entropy of RGB of the five classes
(a) Mean (b) Std Dev.
(c) Variance (d) Entropy
Fig 5. Satellite Image from Google Earth.
[image:7.595.76.497.98.488.2]We took a number of images of each class. For object recognition from satellite images, we used our proposed object recognition scheme as we described in Section 3. For each image of each class, we applied the Pixel intensity and Organization of Color Pixel domain. As a result of this we acquired the attribute of both domains.
Fig.6. shows the mean, standard deviation, variance and entropy of RGB of the five classes. As you can see in the figure that value of each attribute of each class is different from another class that is helpful for differentiate one class from another classes.
Fig.7. shows the mean, standard deviation, entropy and variance of the five classes. These four attributes play a
(a) Quantized Color for Tree (b) Quantized Color for Water
(c) Quantized Color for Greenery (d) Quantized Color for Rock
(e) Quantized Color for Soil
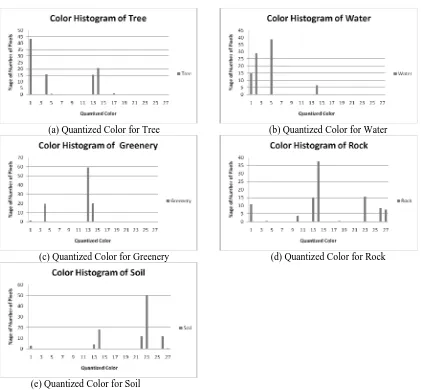
Fig 7. Attribute of Pixel intensity domain: Color Histogram: (a) Color Histogram of Tree (b) Color Histogram of Water (c) Color
[image:7.595.69.264.543.676.2]Fig 8. Mean, Standard deviation, Entropy and Variance of the five classes
Fig.8. shows the quantized color histogram of the five classes. Fig.8. (a) shows quantized color histogram of tree. As you can see in the figure that peak of histogram is remarkably high for the color set 1,4,13 and 14. These colors play an important role in differentiating tree from other objects. Fig.8. (b) shows the quantized color histogram of the water. As you can see, peak of histogram is remarkably high for the color set 1, 2, 5 and 14. Fig.8. (c) shows the quantized color histogram of the greenery. As you can see for greenery class that peak of histogram is remarkably high for the color set 4, 13 and 14. Fig.8. (d) shows the quantized color histogram of the rock. As you can see in the figure that peak of histogram is remarkably high for the color set 1, 13,14,23,26 and 27. Fig.8. (e) shows the quantized color histogram of the soil. As you can see in the figure that peak of histogram is remarkably high for the color set 13,14,22,23 and 26.
Fig.9. shows the quantized color histogram of the tree, water, greenery, rock and soil. As you can see in the figure that peak of histogram varies from class to class
that is helpful for differentiate each class from another class.
After extracting attributes from the pixel intensity and organization of color pixel, these attributes are hand over to the decision tree induction module for making hypothesis about the presence of the object. For identifying objects from an image, this information was passed over to the image classification module that decides either hydrocarbon is present in the area of given image or not.
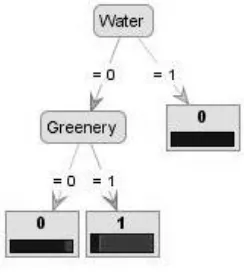
[image:8.595.152.445.529.678.2]In our experiments, we consider only five types of the classes: tree, water, greenery, rock and soil. These classes can be useful for finding the presence of the hydrocarbon in an area. We took total 42 samples of different area from which some of area has hydrocarbon and others don’t have. We make a database that has the information of the five classes and presence of hydrocarbons. From this data, we make decision tree on the base of presence of hydrocarbons and our five classes: tree, water, greenery, rock and soil. Rapid miner is used to build the decision tree and the result is shown in Fig 10.
Fig 9. Quantized color histogram of the tree, water, greenery, rock and soil
Fig 10. Decision tree for classification of hydrocarbon
The figure above shows the decision tree for classification of hydrocarbon. In Fig..10, 1 indicates the presence and 0 indicates the absence. From decision tree, we can conclude that water and greenery play an important role in making decision about the presence of hydrocarbons in an area. From decision tree, we can easily infer that if there is water in an area then there can be chance of presence of hydrocarbons in that area. If water is not present but greenery is present then there can also be chance of hydrocarbons in that region.
IV. CONCLUSION
In this research paper, we have proposed a method for classification of satellite images by using data mining technique. Major concern in classification of images is the object recognition from satellite image. Our object recognition technique is based on two domains that are Pixel intensity and organization of color pixels. All of the attributes that are extracted under Pixel Intensity and Organization of Color Pixel domain are helpful for making hypothesis about object’s identification. Our purposed object recognition scheme is also independent of rotational, size and translational invariance. It is also computationally efficient. After recognition of objects from an image, information is handed over to decision tree that makes decision about the presence of hydrocarbon inside that area.
Our proposed methodology has been tested for 42 satellite images. The experimental results are satisfactory and show that the system’s accuracy is around 80%. The proposed model shows a higher degree of robustness and accuracy for the object recognition process.
We focused on only five classes: tree, water, greenery, rock and soil. Our image classification scheme can be improved by adding more classes. Addition of sub
soil) can also boost the performance of our proposed methodology. For example: sub class of water can be lake water, sea water, river water and water covered with greenery etc.
For hydrocarbon classification we just consider the classes that were related to natural phenomena. Tree, water, greenery, rock and soil are part of nature. Similar classification scheme can be employed for enemy attack detection but the classes used for this activity should be related to enemy attack. Unnecessary human movement, presence of tanks, unwanted bushes and sand blocks etc can be an indication of enemy attack.
REFERENCES
[1] Adnan A. Y. Mustafa,Linda G. Shapiro and Mark A. Ganter,"3D
Object Recognition from Color Intensity Images", 13th Int. Conf. on Pattern Recognition, Vienna, Austria, pp. 25-30, August, 1996.
[2] Z.A. Aghbari, "Effective Image Mining by Representing Color
Histograms as Time Series", presented at JACIII, 2009, pp.109-114.
[3] Ender Ozcan and Chilukuri K. Mohan, "Partial shape matching
using genetic algorithms", Pattern Recognition Letters, Elsevier Science .V 18, pp. 987-992,1997.
[4] Farzin Mokhtarian,Sadegh Abbasi and Josef Kittler,"Robust and
Efficient Shape Indexing through Curvature Scale Space", British Machine Vision Conference ,Edinburgh, pg. 53-62, 1996.
[5] Kyoung Sig Roh and In So Kweon,"2-D Object Recognition using
Invariant Contour Descriptor and Projective Refinement", Pattern Recognition, Elsevier Science. V31, N 4, pp. 441-455, 1998.
[6] Mariana Tsaneva and Doyno Petkov, "Recognition Of Objects On
The Earth's Surface Through Texture Analysis Of Satellite Images", In Proceeding of the Third Scientific Conference with International Participation Space, Ecology, Nanotechnology, Safety 27–29 June 2007, Varna, Bulgaria.
[7] Jean-Baptiste Bordes and Michel Roux, "Detection of
Roundabouts in satellite image", ISPRS, Ankara (Turkey) , February 2006.
[8] Jiebo Luo, Wei Hao, Dale McIntyre, Dhiraj Joshi and Jie Yu,
"Recognizing Picture-Taking Environment from Satellite Images: A Feasibility Study", Pattern Recognition, 2008. ICPR 2008.
[9] Frank J. Seinstra and Jan-Mark Geusebroek, "Color-Based Object
Recognition by a Grid-Connected Robot Dog", ECCV Demonstrator, 2006.
[10] Rafael C. Gonzalez and Richard E. Woods, "Digital Image
Processing, 2nd edition", Prentice Hall, 2001, ISBN:0201180758, pp. 120-139.
[11] J. R. Smith and S.-F. Chang. " Tools and techniques for color
image retrieval", Symposium on Electronic Imaging: Science and Technology - Storage & Retrieval for Image and Video Databases IV, volume 2670, San Jose, CA, February 1996. IS&T/SPIE.
[12] M.Petrou, P.G.Sevilla, “Image Processing Dealing with Texture,
Wiley, ISBN: 047002628, pp. 282-529.
[13] Image Processing Toolbox, For use with MATLAB, The Maths
Work Inc, 2001
[14] Shannon, C. E. "A Mathematical Theory of Communication." The
Bell System Technical J. 27, 379-423 and 623-656, July and Oct. 1948.
[15] Kenney, J. F. and Keeping, E. S. Mathematics of Statistics, Pt. 1,
3rd ed. Princeton, NJ: Van Nostrand, 1962