ECG-based Detection and Prediction Models of Sudden
Cardiac Death: Current Performances and New
Perspectives on Signal Processing Techniques
https://doi.org/10.3991/ijoe.v15i15.11688
Mohd Zubir Suboh (), Rosmina Jaafar, Nazrul Anuar Nayan
Universiti Kebangsaan Malaysia, Bangi, Malaysia
Noor Hasmiza Harun
Universiti Kuala Lumpur, Gombak, Malaysia
Abstract—Heart disease remains the main leading cause of death globally
and around 50% of the patients died due to sudden cardiac death (SCD). Early detection and prediction of SCD have become an important topic of research and it is crucial for cardiac patient’s survival. Electrocardiography (ECG) has always been the first screening method for patient with cardiac complaints and it is proven as an important predictor of SCD. ECG parameters such as RR in-terval, QT duration, QRS complex curve, J-point elevation and T-wave alternan are found effective in differentiating normal and SCD subjects. The objectives of this paper are to give an overview of SCD and to analyze multiple important ECG-based SCD detection and prediction models in terms of processing tech-niques and performance wise. Detail discussions are made in four major stages of the models developed including ECG data, signal pre-processing and pro-cessing techniques as well as classification methods. Heart rate variability (HRV) is found as an important SCD predictor as it is widely used in detecting or predicting SCD. Studies showed the possibility of SCD to be detected as ear-ly as one hour prior to the event using linear and non-linear features of HRV. Currently, up to 3 hours of analysis has been carried out. However, the best prediction models are only able to detect SCD at 6 minutes before the event with acceptable accuracy of 92.77%. A few arguments and recommendation in terms of data preparation, processing and classification techniques, as well as utilizing photoplethysmography with ECG are pointed out in this paper so that future analysis can be done with better accuracy of SCD detection accuracy.
Keywords—Electrocardiography, sudden cardiac death, sudden cardiac arrest,
photoplethysmography
1
Introduction
of death for 15 years especially in middle-income and high-income countries [1]. As in 2015, American Heart Association (AHA) reported that heart disease is the main leading cause of death in the United States where IHD is the main contributor with the percentage of 43.8% [2]. IHD can cause myocardial infarction (MI) and normally lead to sudden cardiac arrest (SCA), which eventually caused sudden cardiac death (SCD) if not treated within minutes. Moreover, approximately 50% deaths of the heart dis-ease patients are due to SCD [3,4]. Due to these facts, SCD detection and prediction has become a major research interest since early detection of this event could save many lives.
There are many techniques that can be used to diagnose SCD, electrocardiography (ECG) is one of them. ECG features are widely used as the prediction input as it is non-invasive and radioactive free diagnostic tool. ECG has been recognized equally effective in predicting the SCD event as compared to the other invasive techniques [5]. A few studies of ECG-based SCD detection have demonstrated the possibility of SCD to be detected as early as 30 minutes or 1 hour before it happens, using heart rate variability (HRV) as its main feature [6–8].
For SCD prediction, researchers have greatly achieved a promising accuracy, more than 90%, as early as six minutes before the event [9–13]. Various linear and non-linear methods have been used to achieve such accuracy, utilizing the ECG’s features in time, frequency and time-frequency domains. Nevertheless, six minutes is still far from early, as patient or medical team most likely does not have enough time to re-spond to the situation. Thus, current available models are still impractical for clinical uses due to some limitations such as limited data set, biases in data collection, risk categorization issues and non-standardization methods for early detection [4,14–15].
This paper highlights the epidemiology of SCD and shows how ECG is important in detecting or predicting the event. Potential ECG features for SCD detection has been summarized and discussed in this paper. A few significant models of ECG-based detection and prediction are compared in terms of data preparation, processing tech-nique and classification methods. The importance of sample length determination and peak detection are emphasized for more reliable output in future analysis. Recom-mendation are given on the use of new machine learning techniques as well as simul-taneously analyzing photoplethysmography (PPG) and ECG to improve the perfor-mance of SCD detection and prediction models.
2
Sudden Cardiac Death
Anyone could have SCA, regardless of their age, gender, with known or unknown disease possessed. Figure 1 shows the number of sudden cardiac death per 100 000 population by age in 2015 provided by American Heart Association [17]. The trend demonstrates that the risk factors of SCD is increasing with age. In general, congeni-tal disorder that specifically affect the myocardium or the electrical system, are the cause of death for infants and young children [16]. As for adults with aged over 30 years, coronary artery disease (CAD) and left ventricles hypertrophy, due to longstanding blood pressure, are the main leading causes of SCD [12]. Other causes of SCD are valvular heart diseases and ion-channel disorder including Burgada syn-drome, long QT syndrome (LQTS), short QT syndrome (SQTS), prolong corrected QT (QTc), Wolf-Parkinson-White syndrome (WPW) and catecholaminergic poly-morphic ventricular tachycardia (CPVT). A few guidelines have been made to suggest prevention strategies, clinical and patient management to detect or prevent SCD [15,16, 18–20].
Fig. 1. Death rate of sudden cardiac death by age in 2015 [17]
Around 50% to 70% of SCD occurs due to arrhythmia [21]. Arrhythmia is a mech-anism of SCD occurrence where electrical disturbance existed in the heart that makes the heart beats too slowly (bradycardia), too fast (tachycardia) or with irregular rhythms. Normally, SCA is manifesting to abnormal rhythm such as ventricular tach-ycardia (VT) which might lead to fatal ventricular fibrillation (VFib) [22]. Both of the ventricular arrhythmias contribute 84% of SCD compared to bradycardia, 16% [10]. Statistic also shows that VT and VFib are also the cause of SCD to the post MI pa-tients [23].
an important platform to diagnose the disease. ECG is proven as important markers as studies show that 95% of the SCA patients are having abnormal ECG [22, 24]. Im-plantable cardioverter defibrillators (ICDs) are recommended for SCD patients to correct potentially lethal arrhythmias and reduce the risk of sudden death but it costly and impracticable for certain patients [25].
3
ECG-based Detection and Prediction Models
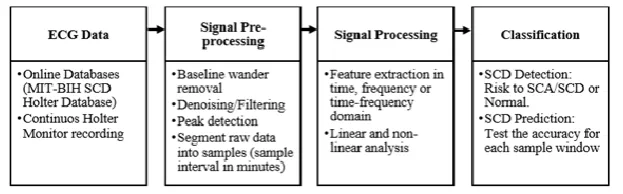
Developing SCD detection or prediction model that solely based on ECG signal remains as a challenging task. These models are normally developed in four main stages, which include ECG data acquisition, signal pre-processing, signal processing and classification of the ECG signals. These processes are simplified as in Figure 2.
Fig. 2. Stages of SCD detection or prediction models
3.1 ECG data
SCA is triggered as a result of malfunction of the heart that cause arrhythmia. Ar-rhythmic ECG data of patients who survived the first cardiac arrest or heart failure patients are normally chosen for this kind of analysis since these patients have more risk to SCD [21, 23, 24, 26]. ECG recording of these specific group is very challeng-ing as it took huge effort from medical doctors and patients for years of monitorchalleng-ing.
non-arrhythmic ECG database (NSRDB) for normal sinus rhythm. Both NSRDB and SDDB are commonly used together for SCD detection or prediction models.
3.2 Signal pre-processing
Recorded ECG signals are subjected to noise such as baseline wander, power line frequency and motion artefacts from subject movement during recording process. High frequency noise is normally removed in analogue circuits which is embedded in the recording devices. Low frequency baseline wander is removed by applying digital filter through coding. Shen et al [28] applied 1Hz to 50Hz IIR filter to remove base-line wander in their hardware while Raka et al [22] chose different bandwidth of 0.5Hz to 45Hz for the filter. Houshyarifar et al [9] and Ebrahimzahed et al [12] used two stages moving average filter while Devi et al [6] and Nayan et al [29] have used Fast Fourier Transform to identify and remove the noise. Meanwhile, Acharya et al [10] have used wavelet technique for denoising processes. Daubechies 6 (db6) mother wavelet and discrete wavelet transform were applied up to second level of filtering to get the clean signal.
Once clean signals are obtained, data were segmented into samples. Various sam-ple length is used to extract the ECG features in the available SCD detection and pre-diction models. Normally one-minute sample starting right before the event of VFib to allow minute-by-minute prediction for up to 3 hours recording [9,10,12,22]. How-ever, Vanitha and Sheela et al [7,8] have used overlapping 10-minute sample window to analyze half an hour SDDB recordings while Devi et al [6] used four minutes sam-ple duration for the same purpose. These variations could affect HRV analysis on the frequency domain. Ordinarily, five-minute sample window is used to extract the low and high frequency components and longer window is needed for comprehensive assessment in the very low frequency (VLF) range of the signal [30]. Hence, VLF is not suggested to be used as the input feature for small size window sample.
3.3 Signal processing
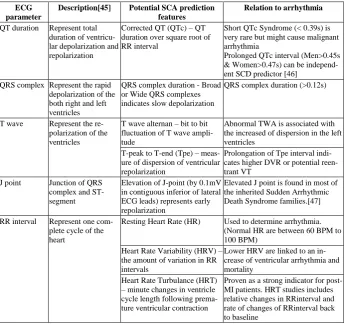
The third stage is to extract features from the ECG sample. There are multiple pa-rameters of ECG signal used as features to differentiate normal and SCD risk patients. Abdelghani and Morin [3] have done an outstanding review on these parameters as important predictors of SCA. Advantageous and disadvantageous of each parameter was properly described and discussed. Summary of these parameters can be found in Table 1. Linear and non-linear features can be extracted out from these parameters but most of the features are independent. Abdelghani and Morin have suggested to com-bine these features for multifactorial risk stratification as it is found that heart rate turbulence (HRT), J-point elevation as well as T-peak to T-end (Tpe) features have the potential to be the next future predictor of SCA.
Table 1. Potential ECG predictors of SCA
ECG parameter
Description[45] Potential SCA prediction features
Relation to arrhythmia
QT duration Represent total duration of ventricu-lar depoventricu-larization and repolarization
Corrected QT (QTc) – QT duration over square root of RR interval
Short QTc Syndrome (< 0.39s) is very rare but might cause malignant arrhythmia
Prolonged QTc interval (Men>0.45s & Women>0.47s) can be independ-ent SCD predictor [46]
QRS complex Represent the rapid depolarization of the both right and left ventricles
QRS complex duration - Broad or Wide QRS complexes indicates slow depolarization
QRS complex duration (>0.12s)
T wave Represent the re-polarization of the ventricles
T wave alternan – bit to bit fluctuation of T wave ampli-tude
Abnormal TWA is associated with the increased of dispersion in the left ventricles
T-peak to T-end (Tpe) – meas-ure of dispersion of ventricular repolarization
Prolongation of Tpe interval indi-cates higher DVR or potential reen-trant VT
J point Junction of QRS complex and ST-segment
Elevation of J-point (by 0.1mV in contiguous inferior of lateral ECG leads) represents early repolarization
Elevated J point is found in most of the inherited Sudden Arrhythmic Death Syndrome families.[47]
RR interval Represent one com-plete cycle of the heart
Resting Heart Rate (HR) Used to determine arrhythmia. (Normal HR are between 60 BPM to 100 BPM)
Heart Rate Variability (HRV) – the amount of variation in RR intervals
Lower HRV are linked to an in-crease of ventricular arrhythmia and mortality
Heart Rate Turbulance (HRT) – minute changes in ventricle cycle length following prema-ture ventricular contraction
Proven as a strong indicator for post-MI patients. HRT studies includes relative changes in RRinterval and rate of changes of RRinterval back to baseline
multi-ple leads are needed for the analysis. Hence, mean resting heart rate and HRV have become the main features to predict SCD. HRV started to be used in cardiology by Axelrod et al in 1980 [40]. Kleiger et al [41] and Bigger et al [42] have proven that HRV are related to severe ventricular arrhythmia and sudden death. Van Hoogenhuyze et al [43] show the importance of mean and standard deviation values of HRV as they found that low HRV values are associated with patients who experi-ence SCD. In 1996, Voss et al [23] have used non-linear dynamic method of HRV data to classify normal, low risk and high risk patients to SCD while Malik et al [44] shows HRV can be accepted as an independent predictor of SCD after Acute Myocar-dial Infarction (AMI). These findings have motivated more studies to explore HRV in modelling SCD predictors. Standard measurement of HRV related linear parameters in time domain are given in Equation (1) to Equation (6).
Mean of RR interval
(1)
Standard Deviation of RR interval
(2)
Square root of the mean of the sum of squares of differences between adjacent
(3)
Standard deviation of differences between adjacent RR intervals
(4)
Where
(5)
(6)
repre-sent synchronization between respiration cycles and HRV while low frequency com-ponents represent oscillations relation of the regulation of blood pressure and vasomo-tor [48]. Ratio of HF and LF is also used as additional non-linear feature for the anal-ysis.
Non-linear information contains in ECG are equally important to the linear infor-mation as ECG itself is a linear signal. Ebrahimzahed et al [13] extracted the non-linear information of HRV using smoothed pseudo Wigner-Ville transform (SPWVT) and segmented the signal into 15 windows based on the frequencies group. Combina-tion of these features to the other classical feature have significantly increase the clas-sification accuracy of their model. The study is extended to four-minute prediction prior to SCD event by using other non-linear methods, Detrended Fluctuation Analy-sis (DFA) and Poincare plot (graphical plot of correlation between successive RR intervals). Acharya et al [10] have used 18 non-linear features from wavelet coeffi-cients of recurrence plot, fractal dimensions, Hurst’s exponent, approximate entropy, sample entropy, DFA as well as correlation dimension (CD) for four-minute tion of SCD [10, 11]. Houshyarifar et al [9] extended the study to six-minute predic-tion using two linear and six non-linear bipsectrum features and produced slightly better prediction accuracy compared to Acharya at fourth minute prediction.
3.4 Classification and prediction performance
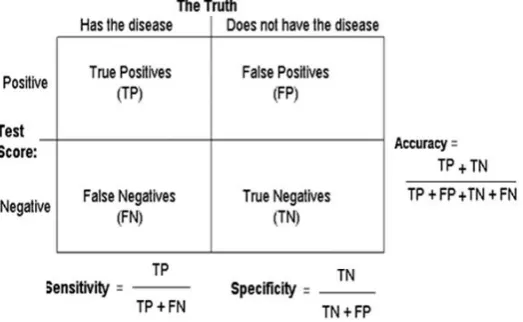
Linear and non-linear features extracted from ECG samples are classified into two categories, normal and have risk to SCD. Various machine learning techniques are applied in the classification to obtain the specificity, sensitivity and accuracy of the prediction model. Specificity refers to the ability of the prediction model to classify normal features as normal while sensitivity refers to the ability of the model to detect abnormal features as abnormal [49]. Accuracy can be determined by using both speci-ficity and sensitivity data to show overall performance of the system. This is shown in Figure 3.
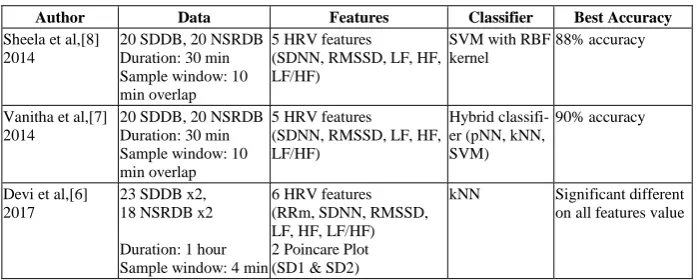
Multiple classifiers such as Linear Discriminant Analysis (LDA), Support Vector Machine (SVM), Artificial Neural Network (ANN), k-Nearest Neighborhood (kNN) and Decision Tree (DT) methods are used to optimize the classification output. Acharya et al. even introduced sudden cardiac death index (SCDI) to classify healthy and SCD subjects using a single number value based on selected non-linear features. For performance comparison, nine similar researches that used SDDB are selected in this paper. Most of them used HRV features of one-minute sample window. Table 2 simplifies all the researches in terms of data used, feature extracted, classification techniques as well as the best prediction accuracy obtained.
Based to Table 2, more than 90% prediction accuracy are achieved with non-linear features compared to solely depending on linear feature as used in [4], [13] and [22]. Best accuracy of 99.73% and 98.68% was recorded at first minute and second minute prediction, which showed higher fluctuation of heart rate right before the event of SCA. Raka et al [22] have tested only HRV features on 3 hours recording of MIT-BIH SCD Holter Database and obtained maximum accuracy 83.9% at 2 minutes prior to the SCA event. However, they have found reasonable prediction accuracy of around 80% at 40 minutes to 50 minutes time, which should provide patient enough time to respond to the predicted situation. Currently, the best prediction time is only at 6 minutes before SCD event with confidence classification accuracy of 92.5% by Houshyarifar et al [9].
A few preliminary studies showed that SCD can be detected as early as thirty minutes or one hour before the event. Vanitha and Sheela et al [7,8] tested HRV fea-tures on 30 minutes signals using 10 minutes overlapping samples and obtained up to 90% accuracy using SVM and Hybrid classifier. Devi et al [6] proved that there are significant differences on HRV values of normal and SCD patients after studying a total of one-hour duration of the data using HRV and Poincare plot features.
Table 2. Comparison of technique and performance of SCD detection and prediction models that used MIT-BIH SCD Holter database
Author Data Features Classifier Best Accuracy
Sheela et al,[8] 2014
20 SDDB, 20 NSRDB Duration: 30 min Sample window: 10 min overlap
5 HRV features (SDNN, RMSSD, LF, HF, LF/HF)
SVM with RBF kernel
88% accuracy
Vanitha et al,[7] 2014
20 SDDB, 20 NSRDB Duration: 30 min Sample window: 10 min overlap
5 HRV features (SDNN, RMSSD, LF, HF, LF/HF)
Hybrid classifi-er (pNN, kNN, SVM)
90% accuracy
Devi et al,[6] 2017
23 SDDB x2, 18 NSRDB x2
Duration: 1 hour Sample window: 4 min
6 HRV features (RRm, SDNN, RMSSD, LF, HF, LF/HF) 2 Poincare Plot (SD1 & SD2)
Raka et al,[22] 2017
10 SDDB, 10 NSRDB Duration: 3 hours Sample window: 1 min
4 HRV features (RRm, RR interval, RMSSD, SDSD)
LDA, Linear SVM, Non-linear fine gusion SVM
3 h = 78.4% 2 h =77.8% 1 h = 77.1% 50 min = 80.6% 10 min = 82.3% 6 min = 78.6% 5 min = 78.5% 4 min = 78.5% 3 min = 82.6% 2 min = 83.9% 1 min = 81.2% Houshyarifar et
al,[9] 2016
23 SDDB, 18 NSRDB Duration: 6 min Sample window: 1 min
2 HRV features (RMSDD, SDNN)
6 bispectrum features (non-linear higher order spectral (HOS))
LDA, SVM, kNN
4 min = 94.46% 5 min = 91.07% 6 min = 92.77%
Acharya et al,[10] 2015
20 SDDB, 18 NSRDB Duration: 4 min Sample window: 1 min
18 non-linear features from wavelet coefficients 1. Fractal Dimension 2. Hurst's Exponent 3. Approximate entropy 4. Sample Entropy 5. Detrended Fluctuation Analysis
6. Correlation Dimension
Decision tree, kNN, SVM (Polyno-mial & RBF Kernel Fc, SCD Index (SCDI)
1 min = 92.11% 2 min = 98.68% 3 min = 93.42% 4 min = 92.5%
Acharya et al,[11] 2015
20 SDDB 18 NSRDB Duration: 4 min Sample window: 1 min
Non-linear methods (Recurrence Quantification Analysis (RQA) & Entro-pies)
DT, KNN, PNN, SVM
1 min = 92.1% 2 min = 86.8% 3 min = 81.5% 4 min = 86.8% Ebrahimzahed et
al,[12] 2014
35 SDDB 35 NSRDB Duration: 4 min Sample window: 1 min
9 HRV features (RRm, SDNN, RMSSD, SDSD, PNN50, VLF, LF, HF, LF/HF)
11 Linear TF domain features (SPWVT of HRV) 4 Non-linear features (3 Poincare and 1 DFA)
kNN, ANN
1 min = 99.73% 2 min = 96.52% 3 min = 90.36% 4 min = 83.93%
Ebrahimzahed et al,[13] 2011
35 SDDB 35 NSRDB Duration: 2 min Sample window: 1 min
7 HRV features (RRm, SDNN, RMSSD, SDSD, PNN50, VLF, LF, HF, LF/HF)
8 Linear TF domain fea-tures (SPWVT of HRV)
kNN, ANN
Classical features 1 min = 72.83% 2min = 72.38%
TF features 1 min = 99.16% 2 min = 91.23%
4
Discussion and Recommendation for Future Works
portable and wearable device similar to Holter Monitor is highly encouraged to assist the data collection.
Sample length determination among the studies is varies and not standard. It is suggested to use five-minute sample window since it is adequate to extract HRV fea-tures. Peak detection method should be described in detail as it is the most importance steps before doing any analysis. Samples with incorrect peaks should be removed from the analysis to avoid false classification. In term of processing technique, studies have shown that combination of non-linear features to linear features of HRV could greatly increase the classification accuracy. Combination of other ECG parameters such as heart rate turbulence, J-point elevation and Tpe characteristics to HRV can be done as they have the potential to be a good predictor of SCD.
As for classification, Deep Learning (DL) method such as Convolution Neural Network (CNN) is more popular nowadays in classifying ECG signal compared to the usual supervised learning methods described in Table 3 [51]. Instead of manually extracted the ECG features, DL algorithms are able to transform a higher-level com-plexity input in its subsequent layers of processing unit in producing the predicted output. Recurrent neural network (Recurrent NN) also has been used to detect ar-rhythmias, analyze wave fluctuation and relates it to the cardiovascular events [52]. Predicting SCD using these techniques could be helpful in future works.
Combination of other physiological marker with ECG such as photoplethysmogra-phy (PPG) might also contribute to better detection and prediction of sudden cardiac death. This combination is rarely found in cardiovascular disease diagnosis [53]. Uti-lizing simple, portable, low cost and non-invasive biomarker like PPG is surely de-manded as it is well recognized for analyzing oxygen saturation, arterial pulse, heart rate, blood flow, vessel elasticity as well as tissue viability [54,55]. Pulsatile time series information is effective to differentiate normal sinus rhythm with atrial fibrilla-tion using RMSDD, Shanon Entropy and Sample Entropy features [56].
PPG also have been used to classify multiple cardiac arrhythmia. Paradkar et al [57] have used PPG alone in classifying five types of malignant arrhythmia on Physionet Challenge 2015 dataset. At the same time, Mahri et al [58] have utilized second derivative PPG (SDPPG) to classify 32 MI and 32 healthy control subjects while Banerjee et al [59] used PPG to extract morphological features in classifying coronary artery disease. Muhajir et al [60] have evaluated finger PPG fitness index among young women with cardiovascular risk factor and found the correlation be-tween aortic stiffness and CVD risk factors using pulse wave velocity.
5
Conclusion
This paper highlighted the importance of early prediction of SCD in order to pro-vide enough time for patients in preventing, responding or receiving proper treatment by the time they are experiencing cardiac arrest. Multiple parameters of non-invasive ECG in detecting and predicting SCD have been summarized. Linear and non-linear features extracted from the parameters are combined to classify healthy and SCD subjects with better accuracy. Among these features, HRV is found as an important independent SCD predictor as it provides a method for assessing cardiac autonomic control. A five-minute sample window is suggested as to minimize loss of infor-mation in frequency component analysis of HRV. Combination of HRV with other features such as HRT, J-point elevation and Tpe characteristic should increase the prediction time to SCD. For the time being, current performances of all SCD predic-tion models are still poor, where confidence predicpredic-tion accuracy is only found at sixth minute prior to the SCD event. Deep learning method such as CNN and Recurrent NN are recommended to detect and predict the event. Relation of PPG and ECG to SCD can be explored as PPG have the potential to detect arrhythmia.
6
Acknowledgement
Authors would like to thank Universiti Kebangsaan Malaysia for partly supporting this work through the Research University Grant (GUP-2018-050).
7
References
[1]WHO, “Global Health Estimates 2016: Deaths by Cause, Age, Sex, by Country and by Region, 2000-2016,” 2018.
[2]E. J. Benjamin et al., “Heart disease and stroke statistics - 2018 update: A report from the
American Heart Association,” Circulation, vol. 137, no. 12, pp. E67–E492, 2018.
https://doi.org/10.1161/cir.0000000000000573
[3]S. A. Abdelghani, T. M. Rosenthal, and D. P. Morin, “Surface Electrocardiogram Predictors of Sudden Cardiac Arrest.,” Ochsner J., vol. 16, no. 3, pp. 280–9, 2016. [4]C. X. Wong et al., “Epidemiology of Sudden Cardiac Death: Global and Regional
Perspectives,” Hear. Lung Circ., vol. 28, no. 1, pp. 6–14, 2019.
[5]R. Mrowka, H. Theres, A. Patzak, and G. Baumann, “Alternans-like phenomena due to filtering of electrocardiographic data,” Comput. Cardiol., vol. 25, pp. 725–727, 1998.
https://doi.org/10.1109/cic.1998.731976
[6]R. Devi, “Early Stage Prediction of Sudden Cardiac Death Using Linear and Non-Linear Features of Heart Rate Variability,” in Proceedings of the 2017 International Conference on Wireless Communications, Signal Processing and Networking, WiSPNET 2017, 2017, pp. 2005–2008.https://doi.org/10.1109/wispnet.2017.8300112
[8]C. J. Sheela and L. Vanitha, “Prediction of sudden cardiac death using support vector machine,” in International Conference on Circuits, Power and Computing Technologies (ICCPCT 2014), 2014, pp. 377–381.https://doi.org/10.1109/iccpct.2014.7054771
[9]V. Houshyarifar and M. Chehel Amirani, “An approach to predict Sudden Cardiac Death (SCD) using time domain and bispectrum features from HRV signal,” Biomed. Mater. Eng., vol. 27, no. 2–3, pp. 275–285, 2016.https://doi.org/10.3233/bme-161583
[10]U. R. Acharya et al., “An integrated index for detection of Sudden Cardiac Death using
Discrete Wavelet Transform and nonlinear features,” Knowledge-Based Syst., vol. 83, no. 1, pp. 149–158, 2015.https://doi.org/10.1016/j.knosys.2015.03.015
[11]U. R. Acharya, H. Fujita, V. K. Sudarshan, D. N. Ghista, W. J. E. Lim, and J. E. Koh, “Automated Prediction of Sudden Cardiac Death Risk Using Kolmogorov Complexity and Recurrence Quantification Analysis Features Extracted from HRV Signals,” in
Proceedings - 2015 IEEE International Conference on Systems, Man, and Cybernetics, SMC 2015, 2015, pp. 1110–1115.https://doi.org/10.1109/smc.2015.199
[12]E. Ebrahimzadeh, M. Pooyan, and A. Bijar, “A novel approach to predict sudden cardiac death (SCD) using nonlinear and time-frequency analyses from HRV signals,” PLoS One, vol. 9, no. 2, pp. 1–14, 2014.https://doi.org/10.1371/journal.pone.0081896
[13]E. Ebrahimzadeh and M. Pooyan, “Early detection of sudden cardiac death by using classical linear techniques and time-frequency methods on electrocardiogram signals,” J. Biomed. Sci. Eng., vol. 04, no. 11, pp. 699–706, 2011. https://doi.org/10.4236/jbise.2011. 411087
[14]J. J. Goldberger et al., “Risk stratification for arrhythmic sudden cardiac death: Identifying
the roadblocks,” Circulation, vol. 123, no. 21, pp. 2423–2430, 2011. https://doi.org/10. 1161/circulationaha.110.959734
[15]H. V. Huikuri, T. H. Mäkikallio, M. J. P. Raatikainen, J. Perkiömäki, A. Castellanos, and R. J. Myerburg, “Prediction of Sudden Cardiac Death,” Circulation, vol. 108, no. 1, pp. 110–115, 2003.https://doi.org/10.1161/01.cir.0000077519.18416.43
[16]A. Merghani, R. Narain, and S. Sharma, “Sudden cardiac death: Detecting the warning signs,” Clin. Med. J. R. Coll. Physicians London, vol. 13, no. 6, pp. 614–617, 2013.https: //doi.org/10.7861/clinmedicine.13-6-614
[17]E. J. Benjamin et al., “Heart Disease and Stroke Statistics-2019 Update: A Report From
the American Heart Association,” Circulation, vol. 139, no. 10, pp. e56–e66, 2019. [18]O. Yousuf, J. Chrispin, G. F. Tomaselli, and R. D. Berger, “Clinical Management and
Prevention of Sudden Cardiac Death,” Circ. Res., vol. 116, no. 12, 2015.https://doi.org/10. 1161/circresaha.116.304555
[19]S. Halvorsen et al., “ESC Guidelines for the management of acute myocardial infarction in
patients presenting with ST-segment elevation,” Eur. Heart J., vol. 33, no. 20, pp. 2569– 2619, 2012.
[20]F. M. Kusumoto et al., “Systematic Review for the 2017 AHA/ACC/HRS Guideline for
Management of Patients With Ventricular Arrhythmias and the Prevention of Sudden Cardiac Death,” Circulation, vol. 138, no. 13, pp. e392–e414, 2018. https://doi.org/10. 1161/cir.0000000000000616
[21]G. Manis, S. Nikolopoulos, P. Arsenos, K. Gatzoulis, P. Dilaveris, and C. Stefanadis, “Risk stratification for Arrhythmic Sudden Cardiac Death in heart failure patients using machine learning techniques,” Comput. Cardiol. 2013, vol. 40, pp. 141–144, 2013. [22]A. Raka, G. Naik, and R. Chai, “Computational Algorithms Underlying the Time-Based
[23]A. Voss et al., “The application of methods of non-linear dynamics for the improved and
predictive recognition of patients threatened by sudden cardiac death,” Cardiovasc. Res., vol. 31, no. 3, pp. 419–433, 1996.https://doi.org/10.1016/0008-6363(96)00008-9
[24]V. Goyal, D. S. Jassal, and N. S. Dhalla, “Pathophysiology and prevention of sudden cardiac death,” Can. J. Physiol. Pharmacol., vol. 94, no. 3, pp. 237–244, 2015. https:// doi.org/10.1139/cjpp-2015-0366
[25]M. Packer, “Compelling First-Line Drug and Device Therapies for the Prevention of Sudden Death in Patients With Chronic Heart Failure and a Reduced Ejection Fraction Who Are Candidates for an Implantable Cardioverter-Defibrillator,” Circ. Arrhythm. Electrophysiol., vol. 12, no. 6, p. e007430, 2019. https://doi.org/10.1161/circep.119.00 7430
[26]G. Karwiky, C. Ahmad, W. Caesarendra, R. Ismail, and D. Kurniawan, “Suddent cardiac death predictor based on spatial QRS-T angle feature and support vector machine case study for cardiac disease detection in Indonesia,” in IECBES 2016 - IEEE-EMBS Conference on Biomedical Engineering and Sciences, 2016, pp. 186–192. https://doi.org/ 10.1109/iecbes.2016.7843440
[27]A. L. Goldberger et al., “PhysioBank, PhysioToolkit, and PhysioNet: Components of a New Reseach Resource for COmplex Physiologic Signals,” Circulation, vol. 101, no. 23, 2000.https://doi.org/10.1161/01.cir.101.23.e215
[28]T. W. Shen, H. P. Shen, C. H. Lin, and Y. L. Ou, “Detection and prediction of Sudden Cardiac Death (SCD) for personal healthcare,” in Annual International Conference of the IEEE Engineering in Medicine and Biology - Proceedings, 2007, pp. 2575–2578. https:// doi.org/10.1109/iembs.2007.4352855
[29]N. A. Nayan, N. S. Risman, and R. Jaafar, “A portable respiratory rate estimation system with a passive single-lead electrocardiogram acquisition module,” Technol. Heal. Care, vol. 24, no. 4, pp. 591–597, Jul. 2016.https://doi.org/10.3233/thc-161145
[30]R. McCraty and F. Shaffer, “Heart rate variability: New perspectives on physiological mechanisms, assessment of self-regulatory capacity, and health risk,” Glob. Adv. Heal. Med., vol. 4, no. 1, pp. 46–61, 2015.https://doi.org/10.7453/gahmj.2014.073
[31]J. Pan and W. J. Tompkins, “A Real-Time QRS Detection Algorithm,” IEEE Trans. Biomed. Eng., vol. BME-32, no. 3, pp. 230–236, 1985. https://doi.org/10.1109/tbme. 1985.325532
[32]H. Rabbani, M. Parsa Mahjoob, E. Farahabadi, and A. Farahabadi, “R peak detection in electrocardiogram signal based on an optimal combination of wavelet transform, Hilbert transform, and adaptive thresholding,” J. Med. Signals Sens., 2011. https://doi.org/10. 4103/2228-7477.95292
[33]B. Abibullaev and H. D. Seo, “A new QRS detection method using wavelets and artificial neural networks,” J. Med. Syst., vol. 35, no. 4, pp. 683–691, 2011.https://doi.org/10.1007/ s10916-009-9405-3
[34]Z. Zidelmal, A. Amirou, M. Adnane, and A. Belouchrani, “QRS detection based on wavelet coefficients,” Comput. Methods Programs Biomed., vol. 107, no. 3, pp. 490–496, 2012. https://doi.org/10.1016/j.cmpb.2011.12.004
[35]W. Jenkal, R. Latif, A. Dliou, O. El B’charri, and M. Bsiss, “Clustering in vehicular ad-hoc network using artificial neural network,” Int. Rev. Comput. Softw., vol. 11, no. 6, pp. 479–488, 2016.https://doi.org/10.15866/irecos.v11i6.9232
[37]J. Behar, J. Oster, Q. Li, and G. D. Clifford, “ECG signal quality during arrhythmia and its application to false alarm reduction,” IEEE Trans. Biomed. Eng., vol. 60, no. 6, pp. 1660– 1666, 2013.https://doi.org/10.1109/tbme.2013.2240452
[38]Q. Zhang, A. I. Manriquez, C. Médigue, Y. Papelier, and M. Sorine, “An algorithm for robust and efficient location of T-wave ends in electrocardiograms,” IEEE Trans. Biomed. Eng., vol. 53, no. 12, pp. 2544–2552, 2006.https://doi.org/10.1109/tbme.2006.884644
[39]N. A. Nayan and H. A. Hamid, “Evaluation of patient electrocardiogram datasets using signal quality indexing,” Bull. Electr. Eng. Informatics, vol. 8, no. 2, pp. 521–528, 2019. [40]G. Ernst, “Hidden Signals—The History and Methods of Heart Rate Variability,” Front.
Public Heal., vol. 5, no. October, pp. 1–12, 2017.
[41]R. E. Kleiger, J. P. Miller, J. T. Bigger, and A. J. Moss, “Decreased heart rate variability and its association with increased mortality after acute myocardial infarction,” Am. J. Cardiol., vol. 59, no. 4, pp. 256–262, 1987.https://doi.org/10.1016/0002-9149(87)90795-8
[42]J. T. Bigger, J. L. Fleiss, L. M. Rolnitzky, and R. C. Steinman, “The ability of several short-term measures of RR variability to predict mortality after myocardial infarction,”
Circulation, vol. 88, no. 3, pp. 927–934, 1993.https://doi.org/10.1161/01.cir.88.3.927
[43]D. Van Hoogenhuyze et al., “Reproducibility and relation to mean heart rate of heart rate variability in normal subjects and in patients with congestive heart failure secondary to coronary artery disease,” Am. J. Cardiol., vol. 68, no. 17, pp. 1668–1676, 1991. https:// doi.org/10.1016/0002-9149(91)90327-h
[44]M. Malik et al., “Heart rate variability: Standards of Measurement, Physiological,” Eur. Heart J., vol. 17, pp. 354–381, 1996.
[45]Dr Araz Rawshani, “ECG interpretation: Characteristics of the normal ECG (P-wave, QRS complex, ST segment, T-wave),” The ECG Book, 2019. [Online]. Available:
https://ecgwaves.com/ecg-topic/ecg-normal-p-wave-qrs-complex-st-segment-t-wave-j-point/. https://doi.org/10.1007/978-1-59745-408-7_5
[46]S. M. J. M. Straus et al., “Prolonged QTc interval and risk of sudden cardiac death in a
population of older adults,” J. Am. Coll. Cardiol., vol. 47, no. 2, pp. 362–367, 2006. [47]L. M. Nunn et al., “Prevalence of J-point elevation in sudden arrhythmic death syndrome
families,” J. Am. Coll. Cardiol., vol. 58, no. 3, pp. 286–290, 2011.
[48]Y. Miki et al., “Long-range correlations in amplitude variability of HF and LF components
of heart rate variability,” in Proceedings of the Annual International Conference of the IEEE Engineering in Medicine and Biology Society, EMBS, 2016, vol. 2016-Octob, pp. 6218–6221.https://doi.org/10.1109/embc.2016.7592149
[49]D. Sharma, U. B. Yadav, and P. Sharma, “The concept of sensitivity and specificity in relation to two types of errors and its application in medical research.,” J. Reliab. Stat. Stud., vol. 2, no. 2, pp. 53–58, 2009.
[50]F. Meng et al., “Machine learning for prediction of sudden cardiac death in heart failure patients with low left ventricular ejection fraction: Study protocol for a retroprospective multicentre registry in China,” BMJ Open, 2019. https://doi.org/10.1136/bmjopen-2018-023724
[51]U. R. Acharya, H. Fujita, O. S. Lih, Y. Hagiwara, J. H. Tan, and M. Adam, “Automated detection of arrhythmias using different intervals of tachycardia ECG segments with convolutional neural network,” Inf. Sci. (Ny)., vol. 405, 2017. https://doi.org/10.1016/ j.ins.2017.04.012
[53]W. Liu, X. Fang, Q. Chen, Y. Li, and T. Li, “Reliability analysis of an integrated device of ECG, PPG and pressure pulse wave for cardiovascular disease,” Microelectron. Reliab., vol. 87, no. June, pp. 183–187, 2018.https://doi.org/10.1016/j.microrel.2018.06.008
[54]J. Allen, “Photoplethysmography and its application in clinical physiological measurement.,” Physiol. Meas., vol. 28, no. 3, pp. R1-39, 2007. https://doi.org/10.1088/ 0967-3334/28/3/r01
[55]N. Selvaraj, A. Jaryal, J. Santhosh, K. K. Deepak, and S. Anand, “Assessment of heart rate variability derived from finger-tip photoplethysmography as compared to electrocardio graphy,” J. Med. Eng. Technol., vol. 32, no. 6, pp. 479–484, 2008.https://doi.org/10.1080/ 03091900701781317
[56]J. Lee, B. A. Reyes, D. D. McManus, O. Mathias, and K. H. Chon, “Atrial fibrillation detection using a smart phone,” Proc. Annu. Int. Conf. IEEE Eng. Med. Biol. Soc. EMBS, pp. 1177–1180, 2012.https://doi.org/10.1109/embc.2012.6346146
[57]N. Paradkar and S. R. Chowdhury, “Cardiac arrhythmia detection using photoplethysmography,” Proc. Annu. Int. Conf. IEEE Eng. Med. Biol. Soc. EMBS, pp. 113–116, 2017.
[58]N. Mahri, K. Gan, R. Meswari, M. H. Jaafar, M. Alauddin, and M. Ali, “Utilization of second derivative photoplethysmographic features for myocardial infarction classification,” J. Med. Eng. 8 Technol., vol. 0, no. 0, p. 000, 2017. https://doi.org/10. 1080/03091902.2017.1299229
[59]R. Banerjee, S. Bhattacharya, and S. Alam, “Time series and morphological feature extraction for classifying coronary artery disease from photoplethysmogram,” ICASSP, IEEE Int. Conf. Acoust. Speech Signal Process, vol. 2018-April, pp. 950–954, 2018.
https://doi.org/10.1109/icassp.2018.8462604
[60]M. Muhajir et al., “Evaluation of finger photoplethysmography fitness index on young
women with cardiovascular disease risk factors,” Sains Malaysiana, vol. 47, no. 10, pp. 2481–2489, 2018.https://doi.org/10.17576/jsm-2018-4710-25
[61]A. Reisner, P. Shaltis, D. Mccombie, and H. H. Asada, “REVIEW ARTICLE Utility of the Photoplethysmogram in Circulatory,” Pulse, vol. 108, no. 5, pp. 950–958, 2008.https:// doi.org/10.1097/aln.0b013e31816c89e1
[62]L. F. Polania, L. K. Mestha, D. T. Huang, and J. P. Couderc, “Method for classifying cardiac arrhythmias using photoplethysmography,” Proc. Annu. Int. Conf. IEEE Eng. Med. Biol. Soc. EMBS, vol. 2015-Novem, no. 1, pp. 6574–6577, 2015.https://doi.org/10.1109/ embc.2015.7319899
[63]B. K. Radha, B. Harsoor, and R. Das, “A Novel Framework for Prediction and Detection of Myocardial Ischemia with Single Lead ECG and PAT,” in Proceedings of the 2018 3rd IEEE International Conference on Research in Intelligent and Computing in Engineering, RICE 2018, 2018, pp. 1–6.https://doi.org/10.1109/rice.2018.8509036
8
Authors
Dr. Rosmina Jaafar is senior lecturer at the Dept. Electrical, Electronics & Sys-tems Engineering, Faculty of Engineering & Built Environment, Universiti Kebang-saan Malaysia (UKM), 43600 Bangi, Malaysia. She has attained her Ph.D in Electri-cal, Electronic & Systems Engineering UKM in 2009. Her main research interest is biomedical engineering that includes signal processing, imaging and medical infor-matics as well as medical electronics & instrumentation.
Ir. Dr. Nazrul Anuar Nayan is a professional engineer and a senior lecturer at the Faculty of Engineering & Built Environment, Universiti Kebangsaan Malaysia (UKM), 43600 Bangi, Malaysia. He obtained his Ph.D in Electronics and Information Systems Engineering at Gifu University, Japan in 2011. He has also gone for a-two year post-doctoral research programme at The Institute of Biomedical Engineering, Univ. of Oxford, United Kingdom. His research interests lie in the field of Big Data in Healthcare, Digital Integrated Circuit Design and Computational Thinking.
Dr. Noor Hasmiza Harun is senior lecturer at the Medical Engineering Technolo-gy Section, Universiti Kuala Lumpur (UniKL), 53100 Gombak, Malaysia. She has attained her Ph.D in Instrumentation Engineering from Universiti Putra Malaysia in 2015. Her main research interest is biomedical engineering that includes medical electronics & instrumentation, rehabilitation engineering and inductive sensor.
![Fig. 1. Death rate of sudden cardiac death by age in 2015 [17]](https://thumb-us.123doks.com/thumbv2/123dok_us/556432.2055074/3.595.163.433.329.476/fig-death-rate-sudden-cardiac-death-age.webp)