International PhD Program in Biomolecular Sciences
Centre for Integrative Biology
XXVIII Cycle
“Identification and functional characterization
of microRNA regulatory elements in
Brassicaceae
”
Tutor
Dr. Claudio Varotto
Fondazione Edmund Mach
Ph.D. Thesis of Yu Wei
University of Trento
Fondazione Edmund Machdi San Michele all'Adige
Table of Contents
Abstract ... 1
LIST OF Abbreviations ... 4
LIST OF FIGURES ... 4
LIST OF TABLES ... 6
Introduction ... 7
Acknowledgement ... 10
Chapter 1. Current review of miRNA ... 12
1.1 miRNAs definition ... 12
1.2 Biogenesis of miRNA ... 14
1.3 Plant miRNA and animal miRNA ... 19
1.4 MiRNAs are involved in plant developmental regulation ... 20
1.4.1 SAM development ... 20
1.4.2 Leaf development ... 21
1.4.3 Root development ... 23
1.4.4 Floral organs development ... 24
1.5 The regulation of miRNA390 in plants ... 24
1.6 Promoter structure of plant miRNAs and cis-regulatory elements as well as transcription factors (TFs) ... 27
1.7 Public databases for cis-regulatory elements study ... 29
1.8.1 Computational ... 30
1.8.2 Experimental ... 31
1.9 DNA sequencing ... 34
Chapter 2. Design, hypotheses and objectives of the project ... 35
2.1 Aim of this study ... 35
2.2 Hypotheses ... 35
2.2.1 Hypothesis1 ... 35
2.2.2 Hypothesis2 ... 36
2.3 Objectives ... 36
2.3.1 Objective1 ... 36
2.3.2 Objective2 ... 36
2.3.3 Objective3 ... 36
2.3.4 Objective4 ... 36
Chapter 3. Identification of putative cis-regulatory elements of conserved miRNAs…………. ... 38
3.1 Materials and methods ... 38
3.1.1 Computational analysis ... 38
3.2 Results ... 50
3.2.1 Sequences generated ... 50
3.2.4 Identification of putative miRNA390a and miRNA390b cis
-regulatory elements ... 64
3.2.5 Phylogenetic analysis based on miR390 promoter regions . 68 3.3 Discussion ... 72
Chapter 4. GUS-fused constructs of WT miRNA390 promoters and WT miRNA390a promoter undergone site-directed mutagenesis ... 77
4.1 Methods ... 77
4.1.1 Plant materials ... 77
4.1.2 Create p-ENTRY clone of miRNA390a and miRNA390b upstream promoter regions ... 77
4.1.3 Performing the LR recombination reaction to generate the destination plasmids ... 78
4.1.4 Transformation of destination vectors into A.thaliana ... 78
4.1.5 T1 transgenic seedlings screening ... 79
4.1.7 T2 plants segregation analysis ... 80
4.1.8 Histochemical detection and GUS staining on seedlings and inforescence ... 81
4.1.9 Electrophoresis ... 81
4.1.10 Site-directed mutagenesis of identified elements in miRNA390a promoter ... 82
4.2 Results ... 83
4.2.2 GUS histochemical detection of expression patterns of
pMIR390a:GUS-GFP and pMIR390b:GUS-GFP on 7d-old seedlings .. 86
4.2.3 GUS histochemical detection of expression patterns of miRNA390a and miRNA390b on 38d-old inflorescence ... 87
4.2.4 Site-directed mutagenesis of identified elements in miRNA390a promoter ... 87
4.2.5 Establishment of transgenic lines ... 89
4.2.6 Characterization of GUS expression of 7d-old seedlings from 6 mutagenized constructs in the promoter of miR390a ... 90
4.3 Discussion ... 91
4.3.1 Possible sub-functionalization of miR390a and miR390b in plant development ... 91
4.3.2 Site-mutagenized promoter construction of miR390a in Arabidopsis. ... 93
Chapter 5. Functional characterization of miRNA390a cis-regulatory elements under iron-stress treatments ... 95
5.1 Methods ... 95
5.1.1 Iron-deficient treatment ... 95
5.1.2 GUS histochemical assay ... 96
MIR390a:GUS-5.2.2 GUS histochemical assay of 7d-old seedlings under
iron-sufficient/deficient treatment ... 98
5.2.3 GUS histochemical assay of 38d-old inflorescence under iron-sufficient/deficient treatment ... 101
5.3 Discussion ... 103
Chapter 6. Conclusion, discussion and perspective ... 105
6.1 Conclusion ... 105
6.2 Discussion ... 106
6.2.1 Advantages ... 106
6.2.2 Disadvantages ... 108
6.3 Perspective ... 109
Appendix ... 124
1. Supplementary tables and figures ... 124
Abstract
As a class of short non-coding RNAs, microRNAs can regulate gene expression by a post-transcriptional pathway through repressing or degrading mRNA. In the evolutionary history, many plant microRNAs are highly conserved from green alge to land plants. In recent years, dramatic studies demonstrate that microRNAs play a crucial in plant growth and development, in response to environmental stresses. Some microRNAs can response to plant hormones, while some others are tissue or cell specific. The understanding of how these microRNAs are regulated at the transcriptional level is just initiated.
With the aim to understand the regulatory mechanism of plant microRNA in evolutionary tem, and identify the most relevant cis-regulatory elements in some microRNAs for improving the agriculture in the future, this study was carried out.
microRNA390 is one of the many conserved microRNAs, it can indirectly regulate the ARFs expression level by targeting TAS3, and consequently regulate lateral organ and later root development in plants. In order to understand the regulatory mechanism of microRNAs in an evolutionary term, microRNA390a and microRNA390b in Arabidopsis were chosen and studied.
In 16 phylogenetically related species within Brassicaceae, we analyzed the microRNA promoter sequences and identified overall conserved cREs in microRNA390 promoter regions, and accompanied with functional characterization, we obtained a good view of microRNA390 regulatory network.
MEME program and PlantCARE database, subsequently compared the motif similarities by TOMTOM program, we eventually obtained the putative ones met the required E-value. In the meantime, we reconstructed the phylogenetic trees of both paralogs by MEGA7 program. We identified 6 and 5 overall conserved cREs. Subsequently, we experimentally validated the putative cREs by Arabidopsis
transformation and site-specific mutagenesis.
The results we have obtained were as follows:
(1)There were totally 29 microRNA loci in 9 families identified to be highly conserved, and totally 104 putative motifs were predicted in their promoter regions.
(2)The reconstructed phylogenetic trees based on miRNA390a and miRNA390b promoter sequences respectively were compared with the the phylogenetic relationships (species trees) in known Brassicaceae
phylogeny. The data derived from both promoter sequences were inconsistent with Brassicaceae phylogeny. This implied that there might be multiple copies of specific cREs in some specific species, hence the promoter sequences evolution of microRNA is not reflective of species phylogeny.
floral organ. These differences indicated possible sub-functionalization with respect to their ancestral miR390 during the evolutionary process. (4)Based on the six putative cREs identified in miRNA390a and the reliable
WT constructs, we also constructed six GUS-fused promoters that undergone site-specific mutagenesis. The GUS assay demonstrated that the activity of putative cis-elements varied with distance to TSS. Mutations of proximal sites (m2 and m3) enhanced expression thereby M2 and M3 were likely to be silencers; while mutations of distal elements (m5 and m6) tended to decrease the promoter expression, hence M5 and M6 probably work as enhancers. These evidences suggest there was a specific modular cooperativity of miR390a cREs in regulating gene expression and mediating plant development.
LIST OF Abbreviations
3’-UTR 3’-untranslated regions
A adenosine
AdoMet cofactor S-adenosyl-methionine
AGO Argonaute
AP1 APETALA1
ARF auxin response factors
As Arsenite
AtHsp90 Arabidopsis heat shock protein 90
bHLH basic helix-loop-helix transcription factors
bZIP Basic Leucine Zipper
Cd Cadmium
CBC nuclear cap-binding complex
cREs cis-regulatory elements
Cu Copper
COPT2 copper transporter2
C cytosine
D-bodies dicing bodies
DDL RNA-binding protein DAWDLE
DNA Deoxyribonucleic acid
DRB4 DOUBLE-STRANDED RNA-BINDING PROTEIN
dsRBD dsRNA binding domain
FUS3 FUSCA3
HEN1 HUA ENHANCER1
HESO1 HEN1 suppressor1
HST HASTY protein
HYL HYPONASTIC LEAVES1
IDE Iron-deficiency responsive cis-element 1
IDF iron-deficient condition
ISF iron-sufficient condition
MID (Chapter 1.2) middle
MID (Chapter 3.1.1.2) multiplex index
miRNAs microRNAs
MREs Metal response elements
MYB myeloblastosis
ORF open reading frame sequences
PAZ Piwi/Argonaute/Zwille
PCR Polymerase chain reaction
phyA phytochrome A
pri-miRNA primary miRNA precursor
qRT-PCR quantitative real-time PCR
RDR6 RNA-DEPENDENT RNA POLYMERASE6
RISC RNA-induced silencing complex
RNA ribonucleic acid
SE C2H2-zinc finger protein SERRATE
SFF Standard Flowgram Format
SGS3 Sequences Over-Represented in Light-Induced
Promoters 5
siRNAs SUPRESSORS OF GENE SILENCING
SORLIP5 small interfering RNAs
sRNAs small RNAs
stRNAs small temporal RNAs
TAS TELOMERE-box
tasiRNAs TRANSPORT-INHIBITOR-RESISTANT1
TELO-box trans-acting short-interfering RNAs precursor
TIR1 trans-acting short-interfering RNAs
TSS translation start site
U uridine
WT wild type
LIST OF FIGURES
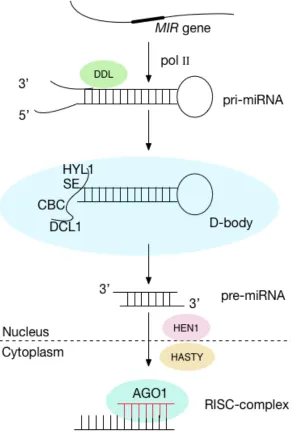
Figure 1-1 Scheme of plant microRNA biogenesis. ... 18
Figure 1–2 Schematic of miRNA390 function pathway in plant ... 26
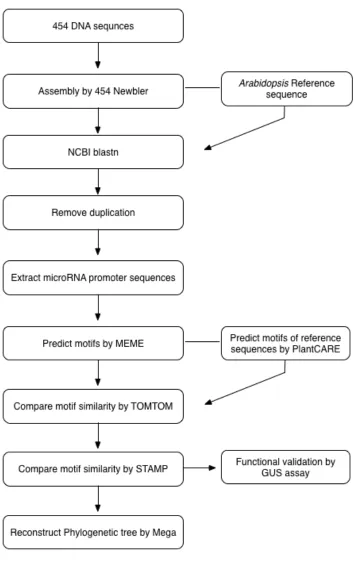
Figure 3-1 Flowchart of microRNAs cREs identification and validation .... 49
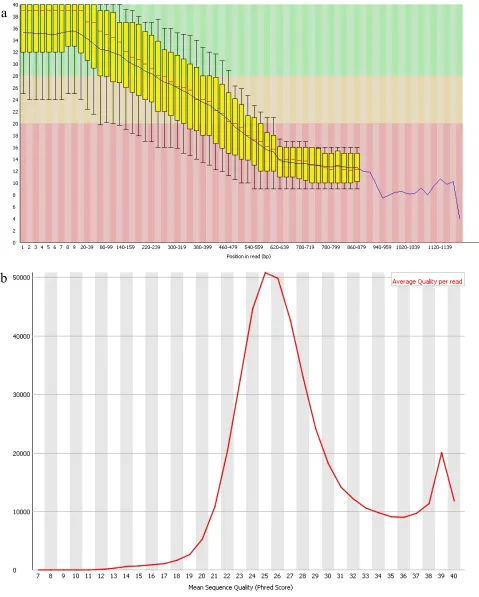
Figure 3–2 Fastqc analysis of fastq sequences from total datasets of 16 species.. ... 51
Figure 3–3 Phylogenetic reconstruction of miR390a in Brassicaceae ... 71
Figure 3–4 Phylogenetic reconstruction of miR390b in Brassicaceae ... 71
Figure 3–6 Alignment of the motif regions in miRNA390b promoter ... 75
Figure 3–6 Alignment of the motif regions in miRNA390b promoter ... 75
Figure 4–1 Simplified view of the miR390a promoter construct ... 78
Figure 4-2 Vector Maps of pENTRY and pKGWFS7 ... 84
Figure 4–3 p-ENTRY Colony PCR of pMIR390a:GUS-GFP and pMIR390b:GUS-GFP in Pentry/D-TOPO ... 84
Figure 4-4 Purified plasmid DNA of pMIR390a:GUS-GFP and pMIR390b:GUS-GFP in pKGWFS7. ... 85
Figure 4–5 Genotyping PCR for confirming pMIR390a:GUS-GFP. ... 85
Figure 4–6 GUS staining of transgenic Arabidopsis carrying p MIR390a:GUS-GFP and pMIR390b:GUS-GFP. ... 85
Figure 4–7 Alignments of A. thaliana miRNA390a and miRNA390b stem-loop sequences on forward strand. ... 86
Figure 5–1 GUS expression patterns of pMIR390a:GUS-GFP homozygous treated with different time-course of iron-sufficient(ISF)/deficient(IDF) condition ... 97
Figure 5–2 GUS assay of pMIR390a:GUS-GFP and site-mutagenized constructs m3 as well as m6 7d-old T2 transgenic plants under Iron-sufficient (ISF) /deficient (IDF) stresses. ... 101 Figure 5–3 GUS assay of pMIR390a:GUS-GFP and site-mutagenized constructs m3 and m6 38d-old T2 transgenic plants inflorescence under Iron-sufficient/deficient stresses. ... 101
LIST OF TABLES
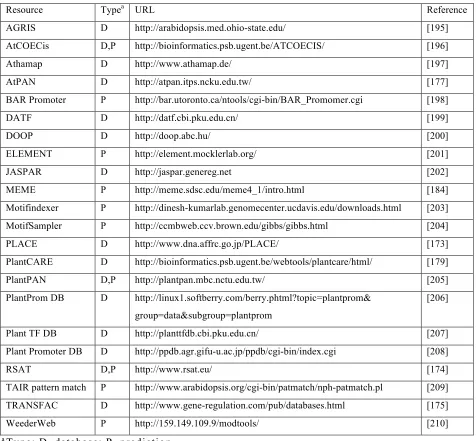
Table 1-1 Selected web-based resources for cis-regulatory element study .. 33
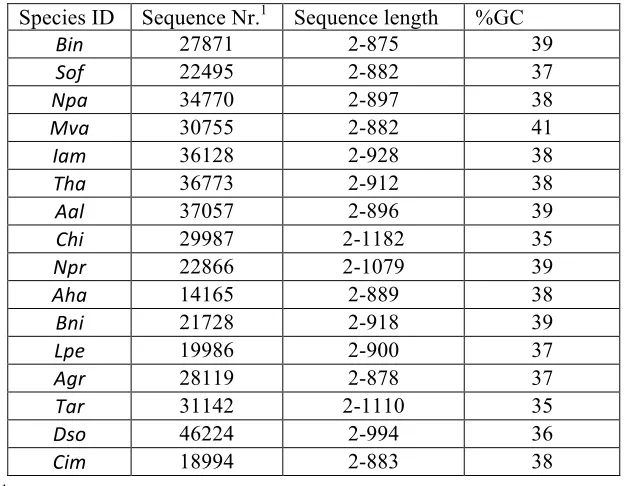
Table 3-1 Summary of numbers and length scope of sequences from different species ... 50
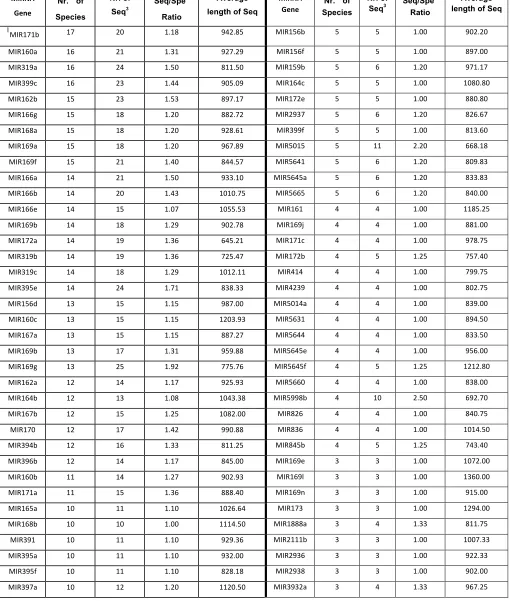
Table 3-2 summary of the miRNAs (by loci) detected ... 53
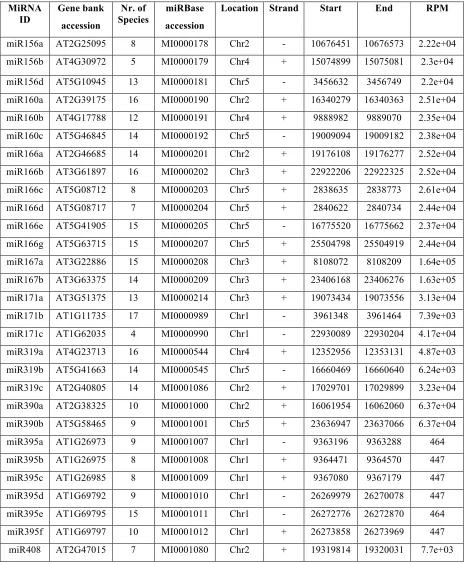
Table 3-3 Summary of identified conserved miRNAs genes ... 58
Table 3-4 motifs identified in microRNA156 family ... 59
Table 3-5 motifs identified in microRNA160 family ... 59
Table 3-6 motifs identified in microRNA166 family ... 60
Table 3-7 motifs identified in microRNA167 family ... 61
Table 3-8 motifs identified in microRNA171 family ... 61
Table 3-9 motifs identified in microRNA319 family ... 62
Table 3-10 motifs identified in microRNA395 family ... 62
Table 3-11 motifs identified in microRNA408 family ... 63
Table 3-12 Summary of motifs detected in miRNA390a promoter ... 74
Table 3-13 Summary of motifs detected in miRNA390a promoter ... 76
Table 4-1 GUS staining patterns summary of pMIR390a:GUS-GFP and pMIR390b:GUS-GFP in 7d-old seedlings and 38d-old inflorescence ... 87
Table 4-2 summary of cis-elements sequences performed for site specific mutagenesis ... 88
Table 4-3 Summary of A. thaliana transgenic plants of different constructs screening ... 89
Introduction
The group of long non-coding miRNAs are fundamental, sequence-specific regulatory elements of eukaryotic genomes. Many plant miRNAs are evolutionarily conserved, and they are known to play essential roles in the regulation of various fundamental processes in plant growth and development, in responding to both biotic and abiotic stresses, as well as in the regulation of the silencing pathway themselves. Generally, promoter sequence evolution is reflective of species phylogeny, and the level of evolutionary conservation of promoter regions could be further attributed to their cis-regulatory motifs [1]. Regardless of the relevance, the transcriptional machinery study of plant microRNAs is still at the early stage. Comparative approaches to detect regulatory elements in the promoter regions provided a pathway to understand the regulatory mechanism of plant microRNA [2]. Some computational performances on animals for relevant tasks have achieved promising results. However, due to the phylogenetically distant plant species used, the evolving computational studies in predicting and identifying cis-regulatory elements in plant microRNAs promoter regions are just initiated.
microRNA390 is one class of the highly conserved microRNA groups, it is mainly expressed in the lateral root primordia [3], and play important role in mediating the processes in response to several stresses [4], including heavy metal stresses [5].
In an attempt to elucidate the regulatory network of plant microRNAs in
achieved this role by carrying out functional studies with computational approaches coupled with transgenic analysis.
Taking the fully sequenced genome of A. thaliana as the reference, by data mining of multiple promoter sequences of multiple microRNA genes, we obtained 29 microRNA genes that presented in more than 10 species within Brassicaceae. This similarities of the promoter sequences were limited to the first few hundred nucleotides upstream of the translation start codon, indicating that this region is important for exploring the conservation and the regulatory mechanism of the microRNAs.
To characterize the function of these cREs, Pentry/TOPO cloning and site-specific mutagenesis techniques were performed on the putative motif site-specific sequences. Subsequentially, iron-stress treatment was applied to different mutagenized constructs, and the transgenic plants were assayed by GUS histochemical detection to provide a qualitative view of mutation effects.
We could provisionally assign the roles to several miRNA390a cis-regulatory elements (cREs) by computational prediction and functional validation through plant transformation. In this study, a putative helix-loop helix protein FIT1 binding motif 5’-CANNTG-3’ sequence was found among five conserved cREs identified in miRNA390a promoter region. Moreover, another relatively less conserved cis -element 5'-GAAATGAAGGAAGCTTAAT-3' was identified in our study, which was known to be involved in iron-deficiency stress in Arabidopsis [4].
regulatory networks, eventually contribute to the crop improvement in different plant families.
This thesis consists of five chapters as follows:
Chapter one provides an overview of current researches on microRNAs and the sequencing technology. It presents the general context of this research and serves as an introduction to the rest of the thesis.
Chapter two describes the design and objectives of this project.
Chapter three presents the computational data mining of conserved microRNAs and the putative cis-regulatory elements identified in single or multiple microRNA genes at the Brassicaceae family level. The cREs identification of miRNA390a and miRNA390b is specifically given.
Chapter four describes the promoter constructions of the two paralogs miRNA390a and miRNA390b in Arabidopsis. Six promoter site-mutagenized constructions of miRNA390a putative motifs in WT Arabidopsis are also presented.
Chapter five discusses the results of functional exploration (iron-deficient responsiveness) of two iron-responsive cREs by GUS assay based on the site-directed constructs of miRNA390a.
Chapter six gives the conclusion, the discussion of advantages and disadvantages, as well as the perspective.
Acknowledgement
I would like to express my greatest gratitude to my supervisor Dr. Claudio Varotto, for affording me the opportunity to be part of Ecogenomics research group, for his guidance and support through my PhD study.
I wish to thank Dr. Mingai Li, for introducing me to this group, for teaching me biotechnology and for revising this manuscript.
I’d like to acknowledge all my lab members for their valuable suggestions and technical contributions. The technician Enrico Barbaro, Dr. Bo Wang, Michele Poli, always being available for any technical issues. I thank Yuan Fu, who is always enthusiastic to solve my computational problems. I appreciate the countless help from Shiliang Hu in both science and life. I also address my sincerest thanks to Stragliati Luca, Dr. José Carli, Huan Li, Mastaneh Ahrar, Jike Wuhe, Emma, for their kindhearted help during my work.
I am grateful to the coordinator Prof. Paolo Macchi and the Secretariat Betty Balduin, for their support during my study. And Betty is always available for helping me to solve the documents issues as well as for providing valuable advice. I also thank Prof. Michela Denti for being my tutor for one period, and for her guidance in the course.
I sincerely thank the Secretariat Elisabetta Perini in FEM for her kind help in official documents and other issues.
help. I’d like to thank my friend Petra Pavlovcic, for her sweetness and critically reading this manuscript.
I also address my thanks to my previous supervisor Prof. Chunhui Guo and the Secretariat Xiping Qi in Northwest A&F University. Without their support, it wouldn’t be so easy for me to come and study aboard.
I give my deep gratitude to my parents, for giving me continuous love and encouragement, and I appreciate what my elder brother and my sister-in-law have done for the family and for me. I’m deeply grateful to my husband, Zhanjun, for his fully support both in my study and my life.
Chapter 1.
Current review of miRNA
1.1 miRNAs definition
Small RNAs (sRNAs), including microRNAs (miRNAs) and short interfering RNAs (siRNAs), are fundamental regulatory elements in eukaryotes. Chemically similar, both miRNAs and siRNAs incorporate into the RNA-induced silencing complex (RISC), and inhibit gene expression through sequence-specific interactions with RNA or DNA.
Despite similarities, miRNAs and siRNAs can be distinguished by their precursors and their targets. MiRNAs derive from a short, imperfectly paired stem of much larger fold-back structures and regulate the target of RNA transcripts to which they are partially or fully complementary. siRNAs arise by Dicer-like cleavage from long, perfectly paired double-stranded RNAs, and typically guide mRNA target degradation to which they are completely complementary, including the mRNAs from which they generate. SiRNAs also regulate nuclear events, such as DNA and histone methylation, leading to transcriptional silencing. Generally, the activity guided by a miRNA or siRNA, mainly depends on how precisely si/miRNA anneal to their targets [6, 7].
In particular, miRNAs are a set of small noncoding RNAs, 19-25 nucleotides in length, that regulate gene expression at the post-transcriptional level [8].
Some microRNAs, such as lin-4 and let-7 were found by standard positional cloning of genetic loci, but most microRNAs are discovered by cDNA cloning of sequences from size-fractionated RNA samples [6, 7].
If discovered by cDNA cloning, the small RNAs should meet several established identification criteria to be identified as miRNAs, and distinguished from siRNAs [10, 11]:
First, ~22-nt small RNA transcript should be confirmed by blot hybridization to a size-fractionated RNA sample. Quantitative real-time PCR ( qRT-PCR), primer extension analysis, ribonuclease protection assay and microarray, as well as in situ
hybridization are available [12]. Since northern blotting can demonstrate both the mature part (a ~22-nt nucleotide band )and fold-back precursor(in animals they are 60-90 nt, whereas in plants, they are more variable, 70-400 nt) [13, 14], it is one method to confirm the miRNAs [11, 12]. Second, the small RNA sequence should be located in one arm of the hairpin structure, without large internal loops or bulges. Third, both the ~22-nt mature miRNA and its hairpin precursor should be phylogenetically conserved. Fourth, the precursor accumulation accompanied by reduced Dicer function strengthens the evidence.
However, the fulfillment of any single criterion listed above is insufficient for a candidate gene to be confirmed as a novel miRNA. In fact, the first criterion does not exclude small RNAs, and the conservation of fold-back structure (the third criterion) is not a unique characteristic of miRNA biogenesis, nor is the Dicer function (the last criterion). Typically, a combination of the first and the second criteria or the first and the third is considered as an adequate condition for miRNA identification.
small RNA cannot be experimentally verified, the conserved hairpin precursor should accumulate accompanied by the reduced Dicer function. This situation should be treated with special care, as other hairpin-containing RNAs might be processed by Dicer. Small RNAs that do not meet these criteria can be classified as either small interfering RNAs (siRNAs) or as other classes [15].
The miRNA database miRBase (v21, released in June 2014) contains a total of 28645 entries of hairpin precursors which generate 358828 mature miRNA products, including both plant and animal species. However, since several facts indicate that some registered miRNA genes in the public databases such as miRBase lack the established annotation criteria [9, 16], stricter criteria should be applied when the lists in the public databases expand [12, 17, 18].
1.2 Biogenesis of miRNA
its conversion in nuclear dicing bodies (D-bodies), where the Dicer-like 1 (DCL1) is interacted with HYL1 (HYPONASTIC LEAVES1), nuclear cap-binding complex (CBC), and C2H2-zinc finger protein SERRATE (SE), and they act together to stabilize pri-miRNA into stem loop precursor miRNA (pre-miRNA) [24, 25].
The DCL family contains four paralogs, but only DCL1 is necessary for the maturation of most miRNA [26], while other members are involved in defending viruses [9, 27, 28]. Different DCL family members give rise to different length of small RNAs: DCL1 produces mainly 21nt, DCL2, DCL3 and DCL4 generate predominantly siRNA size classes, 22, 24 and 21 nt, respectively. RNA virus infection is mainly affected by DCL4 and DCL2, where DCL4 associates with (RNA-DEPENDENT RNA POLYMERASE6) RDR6 and (HUA ENHANCER1) HEN1 is involved in tasiRNAs metabolism and acts during post-transcriptional silencing [27, 29].The pri-miRNA catalyzed protein DCL1 contains an RNA helicase and two ribonuclease III (RNase III)-like domains, a central (Piwi/Argonaute/Zwille) PAZ domain and a dsRNA binding domain (dsRBD). The PAZ domain, separated by the two catalytic RNase III domains is a module that binds the end of dsRNA. Furthermore, the distance between the 3’ overhang binding pocket of the PAZ domain and RNase III active site is thought to be a molecular ruler that determines the length of the small RNAs [30].
specifically degrade single-stranded miRNAs. 3’ A is supposed to stabilize miRNAs, while 3’ C incorporation might induce miRNA degradation.
The methylation pattern of HEN1 could determine which strand of miRNA/miRNA* duplex will be chosen during RISC maturation [31]. However, miRNAs in (HASTY protein) hst mutants didn’t accumulate inside the nucleus in
Arabidopsis, indicating the existence of other export mechanisms yet-to-be-identified [32].
Then the duplex is exported from the nucleus to cytoplasm by protein HASTY, a homolog of metazoan exportin 5, which prefers overhung nucleotides [8, 22, 32, 33]. Once inside the cytoplasm, the duplex separates, and the strand with a less stably paired 5’ end is selected as the guide strand [34-36]. Following this, by binding to the Argonaute (AGO) protein, the guide miRNA strand locates into the RNA-induced silencing complex (RISC) to carry out the silencing reactions. The RISC complex cleaves the 3’-untranslated regions (3’-UTR) of target mRNAs catalyzed by AGO1 [37-40].
The passenger strand of the duplex, called miRNA*, is usually degraded [16, 17]. A recent study indicated that beyond degrade being the only way, miRNA* was necessary for the maturation of AGO-RISC, which suggests a yet to be identified role of the miRNA* [41].
1.3 Plant miRNA and animal miRNA
Both plant and animal miRNAs are involved in regulating the expression of many different genes and play crucial roles in various/diverse biological processes. The biogenesis and functions of miRNAs in plants and animals are similar [58]. However, they may have originated independently due to several differences: (1) The majority of plant miRNAs are produced from single primary transcript
located in the intergenic regions, and the ones derived from the same miRNA gene family often share high similarities [65, 66], while some animal miRNAs are generated from introns and some are derived from polycistronic transcripts in the intergenic regions of chromosome [14, 67].
(2) The precursors of plant miRNAs are longer than those in animals, 70-400 nt comparing to 60-90 nt in animals, and generate more complicated secondary structures with fold-back [13, 14].
(3) For plants, the generation of miRNA from pri-miRNA to pre-miRNA then to the miRNA, involves only the Dicer protein [13, 68, 69]. For animals, the two processes involve both the Drosha and the Dicer [13, 69-71].
(4) Most of the plant miRNAs repress the targets by cleaving mRNA at a single site in the coding regions, while animal miRNAs contain multiple binding sites in the 3’ untranslated regions of the target gene [19, 72-76].
1.4 MiRNAs are involved in plant developmental regulation
The regulation of gene expression is the fundamental capability of biological phenomena [79]. Through binding to reverse complementary sequences, plant miRNAs can regulate gene expression by guiding target cleavage or translational repression [8, 80].
Various studies have revealed that a large category of plant miRNA targets appear to be genes encoding diverse families of transcription factors or regulatory proteins involved in many plant developmental processes or signal transduction, as well as adaptive responses [80-85]. It is obvious that miRNA-based gene regulation play crucial role in plant growth and development [86, 87].
1.4.1 SAM development
The shoot apical meristem (SAM) is located at the tip of the shoot and contains stem cells that are continuously renewed and generate lateral organs [88]. Some miRNAs are characterized to participate in SAM development [89, 90].
Studies in Arabidopsis demonstrated that AGO10, one member of the ARGONAUTE (AGO) family [91], is a key regulator of proper SAM maintenance [92, 93]. The transgenic experiments showed that AGO10 inhibits miR165/166 expression, and these two miRNAs differ in only one nucleotide in mature miRNA sequence. It is known that miR165/166 target the same class III HOMEODOMAINLEUCINE ZIPPER (HD-ZIP III) family transcription factors, which can mediate SAM maintenance and the establishment of leaf polarity [92]. Thus, the interaction between AGO10 and miR165/166 can specifically release the HD-ZIP III gene expression and maintain proper SAM development [60, 61].
as in Arabidopsis [94], indicating that maize and Arabidopsis possibly share a common regulatory pathway in SAM.
A microarray study on soybean found 31 miRNAs and 6 putative legume novel miRNAs expressed in the SAM. Among the miRNAs detected, in situ
hybridization results proved that miR166 and its star strand miR166* were located respectively below and on the abaxial side of the young leaf and the peripheral region of SAM, suggesting that they play different roles in mediating leaf and SAM development. Another conserved miRNA that highly expresses in either soybean SAM or leaves is miR159, it regulates the expression of MYB33 and MYB65, and is found throughout the SAM and leaf primordia. This observation was consistent with the expression level of miR159 in Arabidopsis [95]. As the polarity of leaves was initiated in SAM, such miRNAs were identified in both leaf and SAM, implying that they might play essential roles in cell differentiation associated with SAM function [88].
In addition to miR165/166 and miR159 molecular pathways, miR394 and its target, a LEAF CURLING RESPONSIVENESS (LCR) from the F-box family, were found to be involved in maintaining stem cell competence in the SAM region [96-98], which indicated that a complex network mediated by a number of miRNAs is regulating SAM development.
1.4.2 Leaf development
Plant leaf is the primary photosynthesizing organ and plays essential role in plant growth and crop plant productivity. A variety of miRNAs are known to be implicated in leaf establishment [86, 88].
and shape [101]. Similarly, overexpression of miR319 in rice and creeping bentgrass results in wider leaf blade [102, 103]. Furthermore, miR319 participated not only in the regulation of leaf development, but also in shoot and floral organs growth.
Recent studies have shown that miR396 can regulate GROWTH-REGULATING FACTORS (GRFs) genes and their upregulation in Arabidopsis
leads to dramatically enlarged Arabidopsis cotyledons and leaves [104]. The overexpression of miR396 in Arabidopsis remarkably represses the gene expression of GRFs, thereby causing narrow-leaf phenotypes [105-108]. What’s more, some bHLH transcription factors were identified to be additional targets of miR396, and their interaction could regulate leaf margin and vein pattern formation in
Arabidopsis [109]. Therefore, miR396 could regulate leaf development via binding to both GRFs and bHLH transcription factors.
In addition, it has been shown that miR393 could help auxin-related leaf and other organs development by mediating the expression of several TIR1/AFB2 clade of auxin receptor proteins (TAARs) [110]. In rice, the overexpression of miR393 brings about altered auxin signalling which then lead to enlarged flag leaves, longer primary root and fewer crown roots [111].
Beyond the regulatory role in SAM development, miR394 and its target LCR
were also found to modulate leaf curling-related morphological phenotype [98].
1.4.3 Root development
As a major plant organ, the root system plays a crucial role in nutrient and water uptake as well as in keeping the stability of the entire organism [3, 116].
In Arabidopsis, several miRNAs and their targets were demonstrated to participate in lateral root development. Auxin-induced miR164 and its target NAC1 were reported to be involved in lateral root initiation [117]. MiR390 triggered
TRANS ACTING siRNA 3 (TAS3) mRNA to generate tasiRNAs, which then repressed ARFs expression releasing the lateral root growth [3, 118]. Similarly, miR828 cleaved TAS4 and produces tasiRNAs, and one of the tasiRNA products bined to (myeloblastosis) MYB proteins to stimulate anthocyanin biosynthesis[119], trichome initiation and root hair patterning [120]. MiR160 was found to be involved in root cap formation through interacting with auxin response factors ARF10, ARF16
[121]. MiR167 , with its two targets in ARF family genes ARF6 and ARF8, and was reported to positively regulate adventitious root formation [122].
In rice (Oryza sativa), overexpression of OsmiR393a and OsmiR393b lead to primary root elongation and increasing adventitious roots amount [111]. Another study indicated that two rice homologs of Arabidopsis TRANSPORT INHIBITOR RESPONSE PROTEIN 1 (TIR1) which functioned in seedling root, OsTIR1 and rice
MiR482 and miR1512 were also reported to participate in nodule development and can increase nodule numbers [126].
1.4.4 Floral organs development
In the transition from vegetative to reproductive phase, floral organs of
Arabidopsis were initiated in whorls, which was controlled by the activity of floral meristem [127].
In Arabidopsis, miR156 and miR172 were well-studied miRNAs that involved in flower development. MiR156 was shown to specifically to target
SQUAMOSA PROMOTER BINDING LIKEs (SPLs) genes [128, 129], and upregulation of miR156 lead to delayed floral transition. As to miR172, its overexpression results in elongated flowering times in both monocotyledons and dicotyledons [130], and the APETALA2(AP2) family gene presented throughout the floral meristem is reported to be the target of miR172 [131, 132].
MiR167 was indicated to target two Arabidopsis auxin response factors ARF6 and ARF8, and affecting in natural flower development [133]. MiR319 could regulate the petal and stamen growth, via modulating the expression level of its target TCP [134].
1.5 The regulation of miRNA390 in plants
(DCL4) and DOUBLE-STRANDED RNA-BINDING PROTEIN (DRB4) mediated events.
Some studies demonstrated that miRNA390 associated with AGO7 was expressed in root tissues by a miRNA390-tasiRNAs pathway which negatively regulated the ARFs, thus releasing the growth of lateral root [3, 118]. Marin et al
confirmed that microRNA390a is only expressed in the lateral root primordia in
Arabidopsis, via pMIR390a:GUS-GFP reporter fusion construct and a miRNA390-GFP sensor that was degraded in cells which expressed miRNA390 [3]. In their supplemental file, it was shown that the pMIR390b:GUS-GFP reporter was only detected in the shoot apical meristem, and was absent from root tip and lateral root primordia, which indicates that in Arabidopsis the two paralogs function differently. The same expression pattern of miRNA390a promoter was obtained by Yoon et al
with a pMIR390a:GUS reporter fusion construct [118]. However, a different GUS activity of miRNA390b promoter was present in lateral root tip. It was speculated that the main discrepancy could be generated by different developmental materials, because the researches focused on different lateral root stages [3].
Beyond the expression on root, it was also reported that miRNA390 and TAS3
tasiRNAs defined a circuit of affecting leaf patterning and developmental timing through regulating auxin signal by targeting ARFs [26, 135-139]. Notably, one of the targets ARF2 was suggested to be a positive regulator of leaf senescence [3, 140], which indicated that miRNA390 could promote leaf senescence by modulating the level of tasiRNA-ARF2 [141]. In maize, miRNA390 and tasiRNAs-ARFs accumulated discretely and adaxially in the initiating leaf primordia, only miRNA390a presented below the incipient leaf [142]. In contrast to maize, in
below the SAM into meristem and thus expressed broadly throughout the SAM [139, 143].
In the study of the expression patterns of miRNA390 on incipient leaf in
Arabidopsis, Chitwood et al characterized MIR390A and MIR390B reporters and showed that both precursors were present beneath the SAM and older leaf primordia but not within the meristem or the youngest leaf primordia [139]. In addition, both reporters were more active on the adaxial than on the abaxial side. Furthermore, they detected identical localization of precursors with in situ hybridization technique. Different from the location of precursors, it was demonstrated that the expression of mature miRNA390 accumulated in the SAM and youngest leaf primordia, suggesting an extension of accumulation with respect to its precursor.
However, the results demonstrated by Chitwood were differed from the description given by Marin that GUS activity of pMIR390b:GUS-GFP was located in the shoot apical meristem in the supplemental material [3]. One possible reason could be on the description and the methods applied differently.
1.6 Promoter structure of plant miRNAs and cis-regulatory elements as well as transcription factors (TFs)
In eukaryotes, transcriptional regulation is crucial for a series of fundamental processes as well as in responding to various biotic and abiotic stresses, which range from cell growth, differentiation and plant development [144].
The initiation of plant miRNA transcription is mediated by RNA polymerase II from a DNA template into long primary transcripts, then cleaved to miRNA precursors [14, 145]. Xie et al used 5’-RACE and de novo motif discovery tool BioProspector to identify motifs within TSS region (-50, 10) and their results further prove that RNA Pol II is responsible for miRNA transcription [146]. Moreover, this process requires the interactions mediated by a few regulatory components located in the upstream promoter region [147]. In other words, promoter region is defined as upstream genomic regulatory sequence from the first exon containing a start codon (ATG) of a gene, with a maximal length of 5kb in plants, and can be roughly divided into a proximal and a distal part [148, 149].
TFs are DNA-binding proteins that interact with other transcriptional components such as chromatin remodeling or modifying proteins to dominate RNA polymerases accessing to the gene promoter [153]. Some classes of TFs are shared by plants and animals, whereas there are many classes which appear to be specifically evolved in plants, including the WRKY [154], NAC [155], and AP2/EREBP [156, 157] families; the representative of plant-specific B3 domain transcription factors [156]; the trihelix DNA binding proteins[158]; the Dof domain proteins [159]; and the auxin response factors (ARFs) as well as the Aux/IAA proteins that are interacting with ARFs [160, 161].
The transcription factors recognize and bind to a variety of cREs [162],which are short (8 to 10 nucleotides long) sequences of DNA in the promoter region of TFs’ target gene [163]. These regulatory regions organize in a modular way and form various more discrete regions called cis-regulatory modules (CRMs), which contain multiple transcription factor binding sites (TFBSs).
1.7 Public databases for cis-regulatory elements study
Cell responds to its environment by changing gene expression [168]. By activating or inhibiting the transcription machinery, transcriptional regulatory network regulates the gene expression and mediates the interactions with environment, which represents one aspect of plant cell signaling. Fundamentally, the transcriptional regulation is mediated by the recruitment of transcription factors to its cis-regulatory elements [169].
In the post genomic era, an increase of sequenced genome annotation has revealed the importance of cREs identification in promoter region to understand the transcriptional machinery of gene expression [170-172]. The identification of motifs will allow a better understanding of regulatory networks, and eventually will lead the technical processes on genetically modified organisms [171].
Several public databases for motif prediction have become available [169]. An overview of some database sites are shown in Table 1-1 (the type is indicated as “D”). Among them, the databases of AGRIS, PLACE, and PlantCARE are wildly applied. The databases PLACE (Plant cis-acting regulatory DNA elements), PlantCARE, RSAT (Regulatory Sequence Analysis Tools) and TRANSFAC are belong to one type [173-175], which will display the putative TFBS or motifs corresponding to the submitted DNA sequences in eukaryotes.
The resources AGRIS (Arabidopsis Gene Regulatory Information Server) and AtPAN are classified into another type, in which the putative TFBS in the promoter region of an Arabidopsis given gene will be present when a specific gene identifier is submitted [176-178].
data is extracted from the literatures, supplemented with computational predicted data. Moreover, it also provides in silico tools for promoter analysis [179].
1.8 Approaches in plant cis-regulatory elements analysis
With the current cREs databases, as time goes, more data of higher quality will be available, the work of new cREs identification and the improvements of annotation will be processed. In the meantime, the techniques for exploring novel and more expressive motif models will be called [180]. Nevertheless, a series of computational and experimental methods have been applied into cREs identification. The following sections will review the approaches in predicting and characterizing the cREs in both aspects.
1.8.1 Computational
Compare with the molecular techniques in identifying cREs, the computational methods do not call for prior knowledge of the TFs, and they are relatively low-cost and less labor intensive. In the meantime, they are more efficient to process high-throughput data within a relatively short period and generate large amount of results [181].
few complementary tools and take into account the top predicted motifs of each [172].
Over the past few years, a number of bioinformatics tools have been developed to identify the motifs. An overview of some database sites are shown in Table 1-1 (the types are indicated as “P”). Notably, some web-based tools for cREs
prediction are not plant-specific, and generally applicable to plant studies, for instance, MEME program [184]. The expectation of maximization is an iterative algorithm that employs Position weight matrix (PWM) to scan the site specific frequencies of a sequence motif. MEME, one of such programs, can discover the most relevant motifs from the microRNA promoter sequences. In this program, researchers can define a range of desired motif widths, which is an important feature for motif prediction accuracy [185]. MEME requires one set of FASTA format sequences as the input file, and one background model file.
In this study, MEME program was applied.
1.8.2 Experimental
Regardless of the development of computational approaches for cREs
characterization, the experimental validation of the promoters functions and their cREs is necessary, and should be carried out via plant transformation and transgene expression analysis [186]. However, due to low efficiency in operation and limited possibility for applying on high-throughput data, the traditional experimental methods are not often applied for identifying novel cREs anymore [181].
Currently, biological methods include:
DNAaseI footprinting and gel mobility shift assay, both methods rely on the interaction between TFs and their DNA binding sites that contained in DNA fragments [189, 190];
in vitro DNA selection assay (SELEX, also known as SAAB (selected and amplified binding sites)), a protein is used for isolating high affinity binding sites via in vitro selection and amplification [191];
ChIP(chromatin immunoprecipitation)-microarray, the DNA is associated with a TF of interest, the DNA from this DNA-protein complex is used to probe a genomic DNA microarray [192];
the yeast one-hybrid (Y1H) assay that detecting physical interactions between TFs and the binding sites [193, 194].
In the meantime, the biological methods for elucidating the functions of predicted cREs have several drawbacks, e.g. the expensive protocols, low specificity, time-consuming and labor-intensive experiments. Therefore, the experimental and computational techniques are proposed to couple with each other to overcome these drawbacks [182].
Table 1-1 Selected web-based resources for cis-regulatory element study
a Type: D, database; P, prediction
Resource Typea URL Reference
AGRIS D http://arabidopsis.med.ohio-state.edu/ [195]
AtCOECis D,P http://bioinformatics.psb.ugent.be/ATCOECIS/ [196]
Athamap D http://www.athamap.de/ [197]
AtPAN D http://atpan.itps.ncku.edu.tw/ [177]
BAR Promoter P http://bar.utoronto.ca/ntools/cgi-bin/BAR_Promomer.cgi [198]
DATF D http://datf.cbi.pku.edu.cn/ [199]
DOOP D http://doop.abc.hu/ [200]
ELEMENT P http://element.mocklerlab.org/ [201]
JASPAR D http://jaspar.genereg.net [202]
MEME P http://meme.sdsc.edu/meme4_1/intro.html [184]
Motifindexer P http://dinesh-kumarlab.genomecenter.ucdavis.edu/downloads.html [203]
MotifSampler P http://ccmbweb.ccv.brown.edu/gibbs/gibbs.html [204]
PLACE D http://www.dna.affrc.go.jp/PLACE/ [173]
PlantCARE D http://bioinformatics.psb.ugent.be/webtools/plantcare/html/ [179]
PlantPAN D,P http://plantpan.mbc.nctu.edu.tw/ [205]
PlantProm DB D http://linux1.softberry.com/berry.phtml?topic=plantprom& group=data&subgroup=plantprom
[206]
Plant TF DB D http://planttfdb.cbi.pku.edu.cn/ [207]
Plant Promoter DB D http://ppdb.agr.gifu-u.ac.jp/ppdb/cgi-bin/index.cgi [208]
RSAT D,P http://www.rsat.eu/ [174]
TAIR pattern match P http://www.arabidopsis.org/cgi-bin/patmatch/nph-patmatch.pl [209]
TRANSFAC D http://www.gene-regulation.com/pub/databases.html [175]
1.9 DNA sequencing
DNA sequencing and its corresponding discipline, the genomics, are the combination of molecular biology and nucleotide chemistry [211].
Following the Human Genome project, the first so-called “Next generation sequencing” platform, 454 sequencing, was launched by 454 Life Science (now Roche) in 2005 [212-214], and Illumina sequencing released by Solexa the next year [215], followed by (ABI) SOLiD sequencing [216], which are the three major next generation sequencing methods. After years of evolution, these three platforms provide good performance on high-throughput, read length, accuracy, application, and cost [217].
In this project, Roche 454 method was utilized, and it also has been for years the major NGS platform. Briefly, based on a pyrosequencing method, with the help of nucleotide reagents, the complementary dNTP (dATP, dTTP, dGTP, dCTP) will correspondingly be cycled while the template strand is sequenced, and release pyrophosphate which equals to the intensity of incorporated nucleotide. A Standard Flowgram Format (SFF) file containing the basecalled sequences and corresponding quality scores for all high-quality, individual reads will be generated [212, 218].
Chapter 2.
Design, hypotheses and objectives of the
project
2.1 Aim of this study
Given the fact that an increasing number of protein-coding genes are known to be regulated at the post-transcriptional level by microRNAs, the characterization of the regulatory elements in microRNA promoter region will elucidate the variation of plant miRNA regulation and eventually could be harnessed for crop improvement. Following the development of an in-house high throughput method for isolation of microRNA promoters from non-model species, this study aims to identify the regulatory elements from microRNA390 gene across 16 Brassicaceae
species and experimentally validate their putative roles, and eventually uncover the regulatory machinery of microRNA genes.
This will be achieved by a combined methodology of applying both bioinformatics comparative approaches and functional studies to elucidate the regulatory networks of functionally conserved microRNAs.
2.2 Hypotheses
2.2.1 Hypothesis1
2.2.2 Hypothesis2
Given the miRN390-tasiRNA-ARFs pathway and known responsiveness of miRNA390 to heavy metals, putative heavy metal or auxin responsive cis-regulatory elements could be located in the promoter region of miRNA390a and miRNA390b.
2.3 Objectives
2.3.1 Objective1
To select highly conserved microRNA families and identify the conserved cREs present in multiple copies either in single or multiple microRNA genes.
Based on 454 sequencing data, using the fully sequenced genome of A. thaliana as the reference, characterize the promoter regions of conserved microRNAs from 16 plant species within Brassicaceae and predict the well conserved cis-regulatory elements.
2.3.2 Objective2
Deep mining of the cis-regulatory elements in both Arabidopsis miRN390a and miRN390b 1500bp upstream promoter region. Define the best candidates for functional analyses based on the degree of conservation in evolutionary terms within
Brassicaceae family.
2.3.3 Objective3
In Arabidopsis, use Agrobacterium transformation method, construct GUS-fused promoters of both miRNA390a and miRNA390b, respectively, and build reliable reference lines for the following cREs functional characterization.
2.3.4 Objective4
Chapter 3.
Identification of putative cis-regulatory
elements of conserved miRNAs
3.1 Materials and methods
16 species from Brassicaceae were selected for this study (see Appendix Table S0-1). All plants have grown in the greenhouse from seeds obtained from wild population in Trentino under standard long-day condition.
Promoter regions encompassing mature miR390a and miR390b paralogs from all analyzed species were amplified by nested PCR-based genome walking with the Genome Walking Kit (Takara, Europe).
DNA deep-sequencing data was generated by the Roche 454 platform.
3.1.1 Computational analysis
The SFF files generated by 454 GS-FLX sequencer were used as input and processed with a variety of algorithms.
3.1.1.1 Quality overview
The sequencing reads generated were tested for sequence quality by FastQC with the default option [221].
“SFF” files are Roche 454’s “Standard Flowgram Format” files, containing the sequence data produced from a 454 run. Each SFF file contains a Manifest header at the start to describe the contents, as well as flow intensity signal values for each base in a single read.
The SFF files are in the binary format which needs to be converted into text format, such as Fasta, to carry out the data processing. Roche’s own “sffinfo” utility can achieve this.
Roche 454 sequencers produce single SFF file for each region of a run, which means that in study 2 SFF files were generated.
As the first step, the two SFF files were joined into a single SFF file by “sfffile”, with the following command:
$ sfffile -mcf MIDConfig.parse HZTVIVW01.sff HZTVIVW02.sff
Next, the MID (multiplex index, a short barcode sequence used to label samples/species when multiplexing) tags were used to split the single file into 16 sub-files.
Each SFF file contains the information of both the sequenced reads (FASTA) and the positional quality scores of the sequenced reads (QUAL). As the FASTQ files were required for the subsequent analysis, the FASTA and QUAL files were extracted separately with 454’s “sffinfo” tool from individual SFF file, after which the two were merged into one FASTQ file with the Perl script.
$ sfffile -mcf MIDConfig.parse -s HZTVIVW.sff $ sffinfo –s allfiles.sff > allfiles.fasta
$ sffinfo –q allfiles.sff > allfiles.qual
3.1.1.3 5' adapter trimming
Since a pair of specific PCR primers were fused with each sample during sequencing, if the primers are distant or conversely in the sequence during data processing, the assembler may overlap the real contigs with these primers producing noise. It is therefore necessary to remove the primers of one end before processing into assembly. Meanwhile the primers of the other end are temporarily kept as identifiers of different samples.
The FASTQ files of 16 species were processed as input to trim the 5’ adapters with CUTADAPT program according to its manual (GS Reference Mapper can also handle this) [223].
The MID was placed between the sequencing key and the Primer 1 sequence-specific primer, thus the sequencing reads were longer than the actual sequences. Primer 1 MID needed to be trimmed before the read mapping. 5’ end of reads that matched any substring of primer1 MID were removed.
CUTADAPT is a suite of scriptable tools for small and large tasks arising in high-throughput sequencing projects, and supports 454 data trimming. In practice, the 5’ end adapters were removed with the “-b” parameter that aimed to trim either 5’ or 3’ adapters.
Pythond script usage:
$ python2.7 bin/cutadapt –help
Usage: $ cutadapt [options] <FASTA/FASTQ FILE> [<QUALITY FILE>] $ python2.7 bin/cutadapt -b CTGTGTGCTCACTCTCTTCTGTCA
3.1.1.4 Assembly
In order to identify the similarities among input reads, it is necessary to build contigs. This was achieved by assembling the input reads.
Assembly is the process to merge the short reads into long contigs (a set of contiguous sequences, ideally a full transcript) by searching the best sequence overlaps between reads.
Newbler (Roche’s GS De Novo Assembler) will identify pairwise overlaps between reads, align multiple sequences of overlapping reads, and then generate longer contigs in FASTA format.
With the default values, the “runassembly” option in Newbler was run with command line to assemble the FASTQ files and to generate the 16 FASTAQ files of each species. The command line used was as follows:
$ runAssembly file.fastq
3.1.1.5 Reference sequences and microRNA promoter sequences generation
In order to map the contigs obtained from assembly process to reference sequences, a dataset was generated by extracting 1500 bp upstream of 299
Arabidopsis miRNA hairpins annotated in miRBase (Release 19: August 2012) from Arabidopsis 5 chromosomes downloaded in NCBI.
This step was conducted with the Perl script.
Perl script usage:
3.1.1.6 NCBI Blastn
NCBI Blastn was used to perform the multiple alignments between contigs and reference sequences. When aligning, the FASTA files of clean contigs, which were generated from FASTQ by EMBOSS were taken as the subjects and the extracted miRNA hairpin sequences as the queries.
The “formatdb” command in the BLAST suite was used to format the database of Arabidopsis miRNAs 1500 bp upstream of promoter sequences, thereby ensuring that this database could be searched by BLASTALL program. The basic parameters used here were: -p=<F> (nucleotide); -i=< the input file for formatting>; -o=<T>, true, parse seqid and create indexes. The command line was as follows:
$formatdb -p F -i Refseq_up1500_extract.fas -o T
With the formatted Arabidopsis database, The BLASTALL program was applied in the following step. The parameters used were: -p=<program name>, blastn (for nucleotides); -d=<database> (formatted file in previous step); -i=<query file> (FASTA format); -m=<alignment view option>, 8=<output format as tabular>; -e=<expectation value>, 0.05; -o=<BLAST report output file>; -b=<number of concatenated queries for blastn>, 1. The command line was as follows:
$ blastall –p blastn –d Refseq_up1500_extract.fas –i Bin_ rename.txt –m8 –e 0.05 –o Bin_blastn.txt –b1
3.1.1.7 Contigs’ extraction from cleaned data and renaming
Linux command line “grep” stands for “global regular expression print” and aims to process the standard input for lines containing a match to the given
PATTERN [224]. In this study, this command was used to extract the titles of contigs. Subsequently, the names of microRNAs and matched contigs were combined, based on the BLASTN results from 3.1.1.6 step. The script used was as follows:
$ grep “>” 454 Allcontig.fas > outfile
To ensure all the sequences were in the same orientation, we reverse-complemented all the sequences in the reverse strand with the following python script.
Usage: $ python revecomp.py Seq.fasta > revcomp.fasta
3.1.1.8 Removing duplicates
Cd-hit-454 is a program to identify and extract duplicated 454 sequencing reads, including near identical duplicates. It can be used to reduce the redundancy of the reads [225].
In the analysis, the parameters for this program were set as follows[225]: c=<sequence identity threshold>, 0.95; i=<input filename in FASTA format>; -o=<output filename>, and with other parameters as default. cd-hit-454 was run on 16 renamed FASTA input files. The command line was as follows:
cd-hit-454 usage:
3.1.1.9 3' end adapters trimming
Different from 3.1.1.3, the parameter “-g” that aims specifically to remove any 3’ adapter here was used with other parameters as default.
The python script of CUTADAPT used was as follows:
$ python2.7 bin/cutadapt -g CTGTGTGCTCACTCTCTTCTGTCA
Bin_ revcom.fasta > Sp02 _revcomp_para_g.fas
3.1.1.10 MicroRNAs extraction by family/locus
In order to join each microRNA from the same family/locus into one single file, we extracted all the same microRNAs sorted by the loci. The script used was as follows:
Perl script usage:
$perl extractor_multifas_splitbymatch.pl
There were totally 86 microRNAs families and 132 microRNA loci (given the false positive, only miRNA genes detected in more than two species were calculated).
3.1.1.11 Weight calculation of all the miRNAs
Before applying to the motif searching program, sequence weights (numbers in the range of 0< weight <1) of each FASTA file separated by loci were requested and calculated by Perl script, and sequences would contribute to motifs in proportion to their weights [226]. Sequences shorter than 100 bp were discarded by the script.
Usage: $ perl meme_make_weights.pl
3.1.1.12 De novo motifs prediction
MEME1 (Multiple EM for Motif Elicitation) program was applied for searching the de novo motifs from the conserved miRNAs selected within
Brassicaceae [184, 227]. The descriptions of MEME was given in 1.8.1.
A FASTA file was extracted from TAIR9 (Arabidopsis genome annotation database) 1000 bp upstream of the TSS of coding sequences (cds). With “fasta-get-markov” tool in the MEME Suite, a Markov Background Model was then generated for motif mining [228].
Then the weights of each FASTA file were taken as input, the TAIR9 background model as the annotation database, with parameter- -dna=< sequences use DNA alphabet>; -mod=<distribution of motifs>, anr; -revcomp=< allow sites on + or - DNA strands >; -miniw=<minimum motif width >, 6; -maxw==<maximum motif width>, 10; –bfile=<name of background Markov model file; -nmotifs=< maximum number of motifs to find); -evt=< stop if motif E-value greater than <evt>>, 0.001; -oc<output dir>=<name of directory for output files will replace existing directory>. Other parameters were set as default. MEME program was run on each microRNA loci group with the following command line, taking the sequence group of miR156 as example:
$ meme MIR156 -dna -mod anr -revcomp -minw 6 -maxw 9 –bfile TAIR9_upstream_1000_translation_start-model -nmotifs 15 –evt 0.001 -oc meme_156a
In the following step, MAST (Motif Alignment and Search Tool [227], in The MEME Suite) was applied to search sequences with motifs of the same nucleotides with the following command line:
MAST parameters: c<count>=<only use the first <count> (default: 0)>; -o<dir>=<directory to output mast results; directory must not exist>.
MAST command line:
$ mast MIR156-meme.txt MIR156_fas.txt -c 15 -o mast_MIR156 Batch file processing with Perl script “run_program.pl”.
Perl script usage: $ perl run_program.pl $ sh meme.sh
3.1.1.13 Validation of in silico motifs predicted with known database
Given the possible false positive motifs predicted by MEME and the difficulty to validate all the numerous motifs experimentally, several preliminarily filtering steps were necessary to filter the most relevant motifs.
3.1.1.14 Similarity comparison of the MEME motifs by Tomtom
To verify the success of common motifs discovered by MEME and PlantCARE, we searched the motifs against a database of known TF motifs with Tomtom program [229], which is available in the MEME suite. The motifs with a statistically significat P-value of less than 0.05 and E-value of less than 10 were considered relevant.
Tomtom is a free online programme used for comparing the motifs, the MEME motif sequences which shared more than 2 nucleotides with PlantCARE were taken into account. The MEME matrix file of each microRNA was used as the input query motifs, and the database of PBM motifs for Arabisopsis was applied as the target database, other parameters were set as default.
3.1.1.15 Motifs filtered by STAMP
For microRNA families such as miR160, miR167 and miR319, each of their paralogs have been detected in more than 10 species.
In order to filter the putative motifs identified in these microRNA families, the alignment and logo of each motif were obtained with another Arabidopsis
database AGRIS [176], and the motifs were processed by the STAMP program3 online [230]. This program contains several databases and uses Weblogo tool to generate the motif logos.
The information content for trimming motif edges was set to less than 0.4, and other parameters were considered as default settings, the alignment and logos of individual motifs were generated.
3.1.1.16 Phylogenetic analysis of miR390 cis-regulatory elements
To estimate the correlation between the phylogenetic distance of miR390 promoter sequences and the phylogenetic relationship of the tested species within
Brassicaceae, we conducted Molecular Evolutionary Genetics Analysis (MEGA) software4 to reconstruct the phylogenetic tree, and then compared the results with the known Brassicaceae phylogeny.
Parameters:
Test of phylogeny=bootstrap method; Model/Method= Maximum Composite Likelihood; Nr of bootstrap replication=1000; Gaps/Missing data treatment=Pairwise deletion. Other parameters were set as default.
3.2 Results
3.2.1 Sequences generated
Figure 3–2 showed that the distribution of the average quality scores per sequence from the unique dataset ranged from 10 to 39, the quality of the majority of sequences between 0-559bp was relatively good with a quality score of more than 20. The distribution of the quality scores per sequence across all sequences within the set rationally ranged among 22 to 30. Since the dataset of DNA sequences was generated by relatively short reads and without trimming the adapters, it is not surprising that the quality score range was broad.
As shown in Table 3-1, a total of 459060 sequences were obtained from 454 sequencing platform, and the sequence length ranged from 2 to 1182. Since there were 5’ and 3’ adapters ligated in the original sequences, this could explain the fact of the less than 10bp short reads.
Table 3-1 Summary of numbers and length scope of sequences from different species
Species ID Sequence Nr.1 Sequence length %GC
Bin 27871 2-875 39
Sof 22495 2-882 37
Npa 34770 2-897 38
Mva 30755 2-882 41
Iam 36128 2-928 38
Tha 36773 2-912 38
Aal 37057 2-896 39
Chi 29987 2-1182 35
Npr 22866 2-1079 39
Aha 14165 2-889 38
Bni 21728 2-918 39
Lpe 19986 2-900 37
Agr 28119 2-878 37
a
b
3.2.2 MicroRNA loci detected in this study
After reducing redundancy by cd-hit-454 program, there were in total 86 microRNAs families (supplementary Table S0-4) and 132 microRNA loci detected in different species.
As Table 3-2 showed, the item ratio of the number of sequences and the number of species substitutes the redundancy of individual datasets of miRNA genes. The value 1 indicated there were no duplicates in the miRNA loci dataset. The duplicates of most genes were limited, while some miRNA families still contained an amount of redundancy. The genes selected for the following analysis with or without duplicates would be all manually aligned in Bioedit program, and the redundant sequences would be removed.