RESEARCH
Activation of the alpha-globin
gene expression correlates with dramatic
upregulation of nearby non-globin genes
and changes in local and large-scale chromatin
spatial structure
Sergey V. Ulianov
1,2†, Aleksandra A. Galitsyna
1,3,5†, Ilya M. Flyamer
1,2,9, Arkadiy K. Golov
1,
Ekaterina E. Khrameeva
4,5, Maxim V. Imakaev
6, Nezar A. Abdennur
7, Mikhail S. Gelfand
3,4,5,8, Alexey A. Gavrilov
1and Sergey V. Razin
1,2*Abstract
Background: In homeotherms, the alpha-globin gene clusters are located within permanently open genome regions enriched in housekeeping genes. Terminal erythroid differentiation results in dramatic upregulation of alpha-globin genes making their expression comparable to the rRNA transcriptional output. Little is known about the influence of the erythroid-specific alpha-globin gene transcription outburst on adjacent, widely expressed genes and large-scale chromatin organization. Here, we have analyzed the total transcription output, the overall chromatin contact profile, and CTCF binding within the 2.7 Mb segment of chicken chromosome 14 harboring the alpha-globin gene cluster in cultured lymphoid cells and cultured erythroid cells before and after induction of terminal erythroid differentiation.
Results: We found that, similarly to mammalian genome, the chicken genomes is organized in TADs and compart-ments. Full activation of the alpha-globin gene transcription in differentiated erythroid cells is correlated with upregu-lation of several adjacent housekeeping genes and the emergence of abundant intergenic transcription. An extended chromosome region encompassing the alpha-globin cluster becomes significantly decompacted in differentiated erythroid cells, and depleted in CTCF binding and CTCF-anchored chromatin loops, while the sub-TAD harboring alpha-globin gene cluster and the upstream major regulatory element (MRE) becomes highly enriched with chroma-tin interactions as compared to lymphoid and proliferachroma-ting erythroid cells. The alpha-globin gene domain and the neighboring loci reside within the A-like chromatin compartment in both lymphoid and erythroid cells and become further segregated from the upstream gene desert upon terminal erythroid differentiation.
Conclusions: Our findings demonstrate that the effects of tissue-specific transcription activation are not restricted to the host genomic locus but affect the overall chromatin structure and transcriptional output of the encompassing topologically associating domain.
Keywords: Alpha-globin genes, Transcription, CTCF, Chromatin spatial structure, TAD, Chromatin compartment
© The Author(s) 2017. This article is distributed under the terms of the Creative Commons Attribution 4.0 International License (http://creativecommons.org/licenses/by/4.0/), which permits unrestricted use, distribution, and reproduction in any medium, provided you give appropriate credit to the original author(s) and the source, provide a link to the Creative Commons license, and indicate if changes were made. The Creative Commons Public Domain Dedication waiver (http://creativecommons.org/ publicdomain/zero/1.0/) applies to the data made available in this article, unless otherwise stated.
Open Access
*Correspondence: [email protected]
†Sergey V. Ulianov and Aleksandra A. Galitsyna have contributed equally
to this work
2 Faculty of Biology, M.V. Lomonosov Moscow State University, Moscow,
Russia 119992
Background
In mammals, tissue-specific genes are often located within permanently active chromosome regions, which are enriched with genes ubiquitously transcribed in various cell types. The current paradigm suggests that tissue-specific transcriptional regulation within complex genome envi-ronment depends on a specific spatial organization of the interphase chromatin [1–3]. Non-random long-range con-tacts between remote regulatory sequences and promot-ers in mammalian genomes are often anchored by CTCF/ cohesin-mediated chromatin loops [4] and preferentially occur within the same topologically associating domain (TAD) [5, 6]. TAD boundaries were found to be important for preventing abnormal enhancer–promoter communica-tion [7, 8] and, consequently, delimiting zones of “licensed” enhancer influence, or regulatory domains [9].
The alpha-globin gene domain (AgGD) is defined here as a cluster of α-globin genes along with the remote regu-latory elements. The AgGDs of warm-blooded vertebrates represent a canonical and arguably the most compre-hensively studied example of a genomic locus where an array of tissue-specific (erythroid) genes is located within an extended cluster of housekeeping genes [10, 11]. The structure of AgGD is highly conserved among homeo-therms. The domain comprises several alpha-globin genes transcribed in erythroid cells in a developmental stage-specific manner, and several enhancers whose exact number may vary slightly in different taxa [11]. A rela-tively long genomic region upstream of AgGD is syntenic in vertebrates [12]. The major regulatory element (MRE) of the AgGD, a strong and evolutionary conserved eryth-roid-specific enhancer [13, 14], is obligatorily located within an intron of the gene NPRL3 residing immediately upstream of the alpha-globin cluster. Although the AgGD is located in a permanently open (DNAse I-sensitive) highly acetylated chromatin in all cell types [15], full acti-vation of the alpha-globin transcription in differentiated erythroid cells is accompanied by further histone hypera-cetylation [16, 17] and reconfiguration of the local chro-matin spatial structure within the domain. In these cells, MRE interacts with the adult alpha-globin gene promot-ers via direct looping, and this interaction is a prerequi-site for proper development stage-specific expression of the adult alpha-globin genes [18, 19].
Previous studies have revealed that full activation of the AgGD in erythroid cells of different origin also has certain distant effects on surrounding transcription and chromatin structure. In primary human erythroid cells, the active status of the alpha-globin genes correlates with upregulation of the nearby NPRL3 gene and the distant non-related gene NME4, located 220 Kb away, which is activated via spatial interaction with the MRE [20]. In the human malignant erythroid cell line K562, as compared
to lymphoid cells, transcription of the alpha-globin genes correlates with the decompaction of a 500-Kb chromo-somal segment harboring the alpha-globin gene cluster, based on 5C data and polymer simulations [21]. In mouse primary erythroid cells, active alpha-globin genes may be recruited to a transcription factory formed by promot-ers of housekeeping genes located up to 70 Kb away [22]. Thus, it appears that the activation of globin genes and the assembly of the alpha-globin active chromatin hub occur simultaneously with the modification of the spatial structure of a genomic region at least several hundred kilobases in size.
Here, to get a systematic view on the effects of high-output AgGD activation on neighboring gene loci and chromatin structure, we studied a 2.7 Mb-region of chicken chromosome 14 harboring AgGD, 35 non-globin (predominantly housekeeping) genes, and a gene desert. We performed total rRNA-depleted transcriptome pro-filing to capture both genic and intergenic transcrip-tion, and applied high-resolution 3C, a new variant of Capture Hi-C (Chromatin TArget Ligation Enrichment, C-TALE), and large-scale 5C approaches coupled with a high-throughput analysis of CTCF binding to probe the spatial organization of the genome at the levels of CTCF-anchored loops, TADs, and compartments. We have found that transcription outburst of the alpha-globin genes in terminally differentiated erythroblasts is accompanied by (i) a substantial increase in the level of transcription of several adjacent housekeeping genes and intergenic regions, (ii) dramatic compaction of the encompassing sub-TAD amid the chromatin decompac-tion and massive attenuadecompac-tion of CTCF binding within the extended chromosome vicinity, and (iii) large-scale changes in the chromatin interaction profile at the level of chromatin compartments including segregation of AgGD from the transcriptionally silent gene desert. Our results suggest that activation of tissue-specific tran-scription may considerably affect adjacent non-related genes and chromatin folding of a large chromosomal seg-ment. The opposite scenario where reconfiguration of an extended genomic domain enables remodeling of the local chromatin structure within AgGD also cannot be ruled out.
Results
Full activation of the alpha‑globin gene expression is accompanied by the emergence of abundant intergenic transcription and upregulation of nearby non‑globin genes
globins). To precisely track changes in the transcriptional profile during terminal erythroid differentiation, we per-formed sequencing of total rRNA-depleted transcriptomes of these cell types. Of note, although chicken erythroblasts are extensively used for studies of the genome biology and function [23–26], a whole-transcriptome analysis and com-parison with lymphoblasts and between the differentiation stages, to our knowledge, has not been reported previously.
We performed cluster analysis, differential expression analysis and gene ontology annotation, and expectedly found that genome-wide differences in the transcrip-tional profile are more pronounced between HD3 and DT40 cells than between proliferating and differentiated HD3 cells (Fig. 1a; Additional file 1: Figure S1, panels a, b and c). The differential expression analysis reveals the upregulation (logFC > −0.6, FDR < 10−7) of numer-ous erythroid genes in differentiated HD3 cells (Fig. 1a), including genes encoding transcription factors (KLF1,
GATA2, SCL, LMO2, NF-E2 and FOG1), enzymes involved in heme synthesis (mitochondrial ferrochelatase [FECH] and coproporphyrinogen oxidase [CPOX]) and cell surface markers (transferrin receptor [TFRC]). Gene ontology annotation reveals that the differentiation of HD3 cells is accompanied by a significant decrease in the expression of metabolism-related genes (P < 10−18, Additional file 1: Figure S1d), indicating total repression of cellular biosynthetic processes, which recapitulates the normal erythrocyte maturation [27].
The studied genomic region harbors two gene-rich, highly transcribed zones (5′-terminal zone I and 3′ -ter-minal zone III containing AgGD) separated by a 1.6-Mb gene desert (zone II) containing a predicted homologue of the human gene RBFOX1 (Fig. 1b). In differentiated HD3 cells, about 50% of genes in the entire studied region display higher expression as compared to DT40 and pro-liferating HD3 cells (logFC > 0.6, FDR < 10−7; Fig. 1; see normalized RNA-seq profiles in panel [b]). Importantly, non-globin genes, NPRL3 and TMEM8A, located within the AgGD and involved in the formation of the alpha-globin active chromatin microcompartment (or active chromatin hub, ACH) [26, 28], show the highest degree
of upregulation among non-globin genes in differentiated HD3 cells (5.4-fold and 10.8-fold, respectively; Fig. 1c; Additional file 2: Table S1).
A remarkable feature of the transcriptome profile in the vicinity of AgGD is the presence of abundant inter-genic transcription, especially in differentiated HD3 cells (Fig. 1d). The highest level of intergenic transcrip-tion is observed for regions between the RHBDF1
pro-moter and the MPG promoter, and between MRPL28
and AXIN1 genes, i.e., within immediate neighborhoods of the AgGD. Within the alpha-globin gene cluster, inter-genic transcription is detected exclusively in differen-tiated HD3 cells. In these cells, previous studies using RT-PCR and Northern blotting have demonstrated the presence of the so-called alpha-globin full-domain tran-script, a long noncoding RNA presumably covering the region from its promoter within the NPRL3 gene to the 3′-enhancer of AgGD [29–31]. Indeed, our RNA-seq data reveal the presence of low-level intergenic transcrip-tion from the NPRL3 promoter to the HBZ (π) gene, and between HBAD (αD) and HBAA (αA) genes (Fig. 1d) in differentiated HD3 cells. Furthermore, in these cells, intergenic transcription is readily detectable between the 3′-enhancer of AgGD and the TMEM8A promoter. Sys-tematic analysis reveals that transcription level within intergenic regions is substantially increased in differen-tiated HD3 cells genome-wide (Additional file 1: Figure S1e), the six intergenic regions from an immediate vicin-ity of AgGD being among the top 5% most upregulated.
Taken together, our data reveal general transcriptional upregulation and the presence of abundant intergenic transcription within and around AgGD in differentiated HD3 cells.
AgGD is located within A‑like chromatin compartment in both lymphoid and erythroid cells, and is further spatially segregated from the gene desert upon erythroid differentiation
Transcription regulation and changes in chromatin epi-genetic state upon erythroid differentiation were exten-sively studied in warm-blooded vertebrate alpha-globin
(See figure on next page.)
Fig. 1 Analysis of transcriptomes of the studied cell types. a Genome-wide variation of gene expression in the studied cell types (proliferating and differentiated HD3 cells are designated by HD3pr and HD3dif, respectively). Numbers of upregulated, downregulated, and ubiquitously transcribed
genes for each pair of the cell types are shown at the upper left corner of the plots. The following genes are highlighted in the plots: (1) erythroid
transcription factors GATA2, SCL (Tal1), FOG1, LMO2, NF-E2, Ldb1 and KLF1 (EKLF); (2) enzymes involved in heme synthesis including FECH and CPOX;
(3) transferrin receptor (TFRC); and (4) the alpha-globin gene π (HBZ) and beta-globin gene (HBG2). BACH2 and EBF1 are lymphoid transcription
factors. b Normalized profiles of total rRNA-depleted RNA-seq within the studied region. The functional AgGD from the 3′-end of the NPRL3 gene to
the 3′-end of the TMEM8A gene is highlighted in pink. Alpha-globin genes are highlighted in red, and non-globin genes located within the AgGD
are highlighted in brown. c Transcription level changes between cell types for all genes within the studied region. d The RNA-seq profile of the
AgGD and closest neighbors. Intergenic transcription profiles are highlighted in black, and genic transcription profiles are highlighted in gray.
DT40 (log2 norm. CPM)
HD3pr (log2 norm. CPM)
HD3pr (log2 norm. CPM) DT40 (log2 norm. CPM)
0 5 10 15 0 5 10 15 0 5 10 15
DT40 RNA-seq (norm. RPKM)
Proliferating HD3 (HD3pr) RNA-seq (norm. RPKM)
Differentiated HD3 (HD3dif) RNA-seq (norm. RPKM) 10
0 10
0 10
0 b a
c
d
Non-Chicken RefSeq Genes (Homo sapiens, Mus musculus, Macaca)
USP7 ABAT
TMEM114
RBFOX1
Mus Gsg 1l
KIAA0556RHBDF1MPG
NPRL3 TMEM8AMRPL28
AXIN1 MGRN1 EP300
10.5 11.5 12 12.5
Chr14, Mb 11
π αD
αA
zone I zone II (gene desert) zone III
NPRL3 MPG
RHBDF1 π αD αA TMEM8A MRPL28 AXIN1
10 Kb 0.5
0 0.5
0 0.5
0 CpG Islands
DT40 RNA-seq (norm. RPKM)
HD3pr RNA-seq (norm. RPKM)
HD3dif RNA-seq (norm. RPKM)
0 5 10 15
NPRL3
αD
αA αDαA
TMEM8A TMEM8A
Transcription level, log2(HD3dif / HD3pr) Transcription level, log2(HD3dif / DT40)
π π
π αD αA
TMEM8A Transcription level, log2(HD3pr / DT40)
gene domains [10, 11, 32–35]. However, large-scale spa-tial chromatin structure was precisely examined only in human AgGD [21]. Here, we performed 5C analysis of an extended region of the chicken chromosome 14 that har-bors the AgGD. The experiments were conducted in two biological replicates for each cell type as described previ-ously [36] with minor modifications (see “Methods” and Additional file 3: Figure S2). A total of 93 forward primers and 92 reverse primers were used (on average, one primer per 14.5 Kb, Additional file 4: Table S2), and 8556 unique pairwise chromatin interactions were detected within the selected area. The raw 5C data were binned at a 30 Kb reso-lution, iteratively corrected, and smoothed (see “Methods”). The 5C heatmaps show non-uniform chromatin com-paction along the studied genomic region. A preliminary visual inspection of the heatmaps reveals that the major part of zone III harboring the AgGD interacts more intensively with zone I than with the gene desert (Fig. 2a; Additional file 5: Figure S3a). In mammals, active and repressed genomic regions are spatially segregated into two compartments, namely compartment A contain-ing active genes, and compartment B harborcontain-ing silent genes and gene deserts [37, 38]. Using principal compo-nent analysis [37], we annotated two compartment bor-ders within the studied region (Fig. 2a, see “Methods”). Remarkably, the first compartment border is located exactly at the border between the highly transcribed gene-reach zone I and the gene desert, and coincides with the right boundary of the 5′-terminal TAD (genomic bin #11; see the next section for the description of TAD annotation). The second compartment border occurs at the genomic bin #73 approximately 60 Kb upstream of AgGD. To validate this observation, we constructed a plot featuring the average interaction profile of bins #74-91 located in zone III (a virtual “anchor”) with all bins located upstream of this region. Indeed, the anchor region interacts with zone I more frequently than with the gene desert in all three cell types (Fig. 2b). Notably, a high interaction frequency between the gene-dense
zones of the studied region and their spatial separation from the gene desert is supported by our previously pub-lished results of 4C experiments with an anchor primer placed at the NPRL3 promoter [39] (Additional file 5: Figure S3b). Taken together, these observations indicate that the studied region is partitioned into two chromatin compartments in both lymphoid and erythroid cells. The first compartment (negative values of the first principal component, Fig. 2a) consists of the zone I and the larger part of the zone III, which are gene-dense, contain many actively transcribed genes and intergenic regions, and are enriched with CpG-islands. We classified this compart-ment as A-like. The second compartcompart-ment (positive values of the first principal component, Fig. 2a) is depleted in CpG-islands, and includes the gene desert and the poorly transcribed 5′-segment of the zone III, and thus may be considered as B-like.
Being located within the zone III, the AgGD belongs to the A-like chromatin compartment in both lymphoid and erythroid cells. To find out whether full activation of the AgGD affects its interaction frequency with the tran-scriptionally silent gene desert, we compared interaction frequency of the gene desert with the AgGD and with two control 60 Kb regions flanking the AgGD. Despite control regions being transcriptionally upregulated in differentiated HD3 cells along with globin genes (2.6- and 1.7-fold, respectively, as compared to proliferating cells), we observed a significant decrease in the interaction fre-quency with the gene desert exclusively for the AgGD (P < 0.01, one-tailed Wilcoxon’s signed-rank test, Fig. 2c). Thus, transcription activation leads to further segrega-tion of the AgGD from the gene desert.
Upregulation of transcription in zones I and III in differentiated HD3 cells is accompanied by a signifi-cant increase in interaction frequency between these two zones belonging to A-compartment (P < 0.01, one-tailed Wilcoxon’s signed-rank test, Fig. 2d). Importantly, this fact cannot be explained by the general chroma-tin compaction during erythroid cell maturation, as the
(See figure on next page.)
Fig. 2 Analysis of A/B-like chromatin compartment structure of the studied genomic region. a Heatmap of the differentiated HD3 cells
demon-strating an increased interaction frequency between gene-rich zones I and III. A-like and B-like chromatin compartments are outlined using black
rectangle and black stipple triangle, respectively. The first principal component value is shown below the heatmap. Structural zones I (5′-terminal
gene-rich area), II (gene desert), and III (3′-terminal gene-rich area) were selected manually based on the density of CpG-islands and annotated
genes. b The averaged interaction profiles of 18 genomic bins #74-91 from zone III (virtual “anchor”) with all bins from the remaining part of the
studied region. Circles show average values of 5C counts between genomic bins #74-91 with each of the other bins in the studied region; standard
deviation is shown. c 5C counts corresponding to interactions of the AgGD and flanking regions from the TAD T3 with the gene desert. Thick black
lines represent median values. Two asterisks represent a significant difference with a P-value <0.01 calculated using a one-tailed Wilcoxon’s
signed-rank test. Three asterisks represent a significant difference with a P-value <0.001. The same notations are in panels (d) and (e). d The distributions of
5C counts within the A-like chromatin compartment. e 5C counts between genomic bins #74-91 and the remaining part of zone III and the gene
desert. f 5C counts between four groups of bins from zones I and III (differentiated HD3 cells); bins were divided into groups according to their
transcription level. g 5C counts between four groups of bins from zones I and III; bins were divided into groups according to their degree of the
Differentiated HD3
10 20 30 40 50 60 70 80 90 Genomic bins
10 10.5 11.5 12 12.5
Chr14, Mb 11
PCA1 0 0.1
-0.1
AgGD
Non-Chicken RefSeq Genes CpG Islands
DT40 HD3pr HD3dif Normalized 5C counts (×104), n = 170
Normalized 5C counts (×10
4)
Normalized 5C counts (×10
4)
Normalized 5C counts (×10
4)
a
c
d
b
g
0 0.5 1 1.5 2 2.5
Normalized 5C counts (×104), n = 990
0 0.5 1 1.5 2 2.5
e
f
Normalized 5C counts (×104), n = 115-175
0 0.5 1 1.5 2 2.5
Normalized 5C counts (×104), n = 45
0 0.5 1 1.5 2 2.5
Normalized 5C counts, HD3dif / HD3pr, n = 45
0.1 0.5 1 1.5 2 2.5
1 11 21 31 41 51 61 71
1 11 21 31 41 51 61 71
0 0.5 1.0 1.5 2 2.5
0 0.5 1.0 1.5 2 2.5
0 0.5 1.0 1.5 2 2.5
1 11 21 31 41 51 61 71 74-91
74-91
74-91
DT40
Proliferating HD3
Differentiated HD3
30 Kb genomic bins
zone I zone II (gene desert) zone III
**
*** AgGD
5`-flank
3`-flank
Transcription, bins #1-10
Tr
anscription, bins #74-91
Transcription, HD3dif / HD3pr,
bins #1-10
Tr
anscription,
HD3dif / HD3pr
,
bins #74-91
50% 50% 50% 50%
50% 50% 50% 50%
DT40 HD3pr HD3dif
***
interaction frequency between the zone III and the gene desert is not increased (Fig. 2e). Based on these observa-tions, one may propose that the internal structure of the A-like compartment is affected by the transcription level of the encompassed genes. However, analyzing pairwise interactions of the genomic bins within A-like compart-ment, we did not find any dependency of the interac-tion frequency on the level of transcripinterac-tion within the bins (see data for the differentiated HD3 cells in Fig. 2f). Moreover, we observe that the bins characterized by the highest increase of transcription upon HD3 differentia-tion and show the slightest (if any) increase in contact frequency with each other (orange boxplot in Fig. 2g). Consequently, augmentation of the contact frequency within the A-like compartment and increase in the tran-scription within zones I and III appear to be concomi-tant but not causatively related events during HD3 cell differentiation.
Finally, to visualize the overall 3D configuration of the studied region, we performed IMP polymer simulations [40]. The obtained 3D structures (Additional file 6: Fig-ure S4) demonstrate that, in both lymphoid and eryth-roid cells, the studied region adopts a loop configuration allowing for juxtaposition of gene-rich zones I and III. Terminal differentiation of HD3 cells correlates with compression of the loop, resulting in an increase in inter-actions between these zones.
Full activation of alpha‑globin gene transcription triggers compaction of the encompassing sub‑TAD
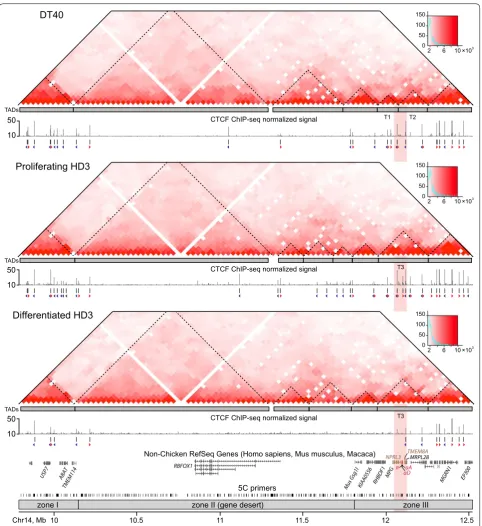
In all three cell types, self-interacting chromatin domains are clearly visible in the studied region (Fig. 3). To accu-rately annotate positions of TADs, we used a dynamic programming segmentation algorithm [41] implemented in the Lavaburst package (see “Methods”). Partitioning of the studied region into TADs appears to be robust within a wide range of the parameter settings and largely con-served across the cell types (Additional file 7: Table S3; gamma-value 0.15 was used for the TAD boundary anno-tation in all cell types). Of note, our data provide the first evidence on the existence of TADs in the chicken inter-phase chromatin.
The comparison of the TAD positions with the previ-ously reported CTCF ChIP-seq profiles [39] demon-strates high occupancy of CTCF binding sites (CBSs) within TADs located in gene-rich zones I and III in DT40 and proliferating HD3 cells. Notably, most of annotated CBSs in the 5′-terminal TAD contain reverse CTCF binding motifs (reverse CBSs; blue tailless arrows in Fig. 3), the majority of CBSs in the 3′-terminal TAD contain forward motifs (forward CBSs; red tailless arrows in Fig. 3), whereas the area containing AgGD and flanks predominantly contains both forward and reverse CBSs
which are always divergently oriented. Terminal differen-tiation of the HD3 cells is accompanied by a proliferation arrest and genome-wide depletion of CTCF binding [39]. Within the region of interest, there is an almost complete loss of CTCF ChIP-seq peaks within zone III and the gene desert. A partial loss of CTCF binding was observed inside the 3′- and 5′-terminal TADs (Fig. 3). Surprisingly, the decrease in CTCF binding sites occupancy does not lead to dramatic changes in the TAD profile: twelve out of fourteen TAD boundaries identified in proliferating HD3 cells are present in the differentiated cells (Fig. 3; Additional file 7: Table S3). Thus, there should be a mechanism preserving TAD structure in post-mitotic cells even when the CTCF binding is abrogated or sub-stantially depleted.
In lymphoid DT40 cells, the area containing the AgGD and several neighboring genes (from the RHBDF1 to the
Non-Chicken RefSeq Genes (Homo sapiens, Mus musculus, Macaca) CTCF ChIP-seq normalized signal
CTCF ChIP-seq normalized signal
CTCF ChIP-seq normalized signal
5C primers
USP7 ABAT TMEM11
4 RBFOX1
Mus Gsg1 l
KIAA0556 RHBDF1 M
GRN1 EP300
DT40
50 0 100 150
2 6 10 ×103
50 10
Proliferating HD3
10 10.5 11.5 12 12.5
Chr14, Mb 11
50 10
50 10
zone I zone II (gene desert) zone III
T1 T2
T3
T3 50
0 100 150
2 6 10 ×103
50 0 100 150
2 6 10 ×103
MPG
NPRL3 TMEM8AMRPL28
π αDαA
TADs
TADs
TADs
Differentiated HD3
Fig. 3 The studied genomic region is partitioned into TADs largely conserved between lymphoid and erythroid cells. The heatmaps show 5C data normalized by the total number of sequencing reads in the 5C dataset, binned at a 30 Kb resolution, iteratively corrected and smoothed.
Histo-grams of the 5C counts are shown to the right of the heatmaps. Gray rectangles below the heatmaps show TADs that were annotated using the
Lavaburst package. TADs T1 and T2 (recognized as fused into one domain T3 in erythroid cells) harbor the alpha-globin gene domain and flanking
regions. The graphs demonstrating CTCF binding in the three cell types are based on previously published ChIP-seq data [39]. The direction of
forward- and reverse-oriented CTCF binding motifs within the ChIP-seq peaks is shown below the ChIP-seq peaks using red and blue tailless arrows,
functional elements [26] are accompanied by a significant compaction of this sub-TAD in differentiated HD3 cells (P < 10−4, one-tailed Wilcoxon’s signed-rank test, Fig. 5b, d). Along with it, upregulation of six out of seven non-globin genes located within T1 and T2 TADs and almost complete loss of CTCF binding within these domains are accompanied by a remarkable depletion of middle- and long-range chromatin contacts within T1 and T2 (Fig. 5b, e, f), indicating a partial decompaction of an extended 300-Kb region around the alpha-globin gene cluster. To validate this observation, we performed 3D FISH with probes placed within T1 and T2 TADs and separated by 165 Kb (Fig. 5g). In agreement with the results of the C-TALE analysis, we found that in differentiated HD3
cells the probes are separated from each other by a sig-nificantly larger distance than in DT40 (P = 4.3 × 10⁻⁴, Mann–Whitney rank test) and in proliferating HD3 cells (P = 8.7 × 10⁻³, Mann–Whitney rank test).
Alpha‑globin MRE is involved in long‑range looping interactions with CBSs outside of the alpha‑globin locus
In the three cell types studied, the strong erythroid-spe-cific enhancer of AgGD known as the major regulatory element (MRE) [44] is located in an immediate vicin-ity of the T1–T2 boundary (Fig. 5a). In DT40 cells, this boundary contains two closely positioned divergent CBSs located 3.5 Kb upstream of the MRE (designated as “−3.5 CBSs”; see Fig. 6a). In proliferating HD3 cells, παDαA MRPL28 RGS9 CLCN7
AXIN1 MGRN1
NPRL3 GTF3C1
KIAA0556 Gsg1l
TMEM8A LUC7L
MPG RHBDF1
11.75 11.85 11.95 12.05 12.15 12.25 12.35 Chr14, Mb
b a
BAC containing region of interest
(ROI)
sonication adapter ligation
PCR amplification with biotinylated
primers
Two rounds of hybridization with Hi-C library
PCR amplification with Illumina
primers
Hi-C
library Hi-C junctions from ROI
Paired-end sequencing
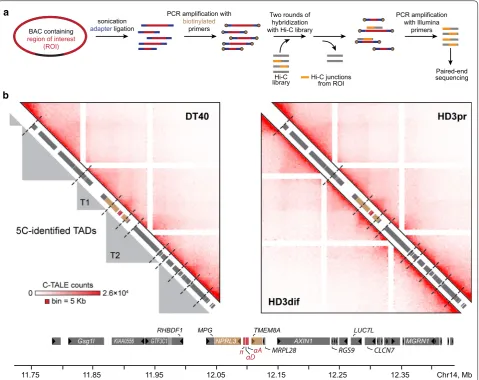
Fig. 4 High-resolution C-TALE-identified TAD profile around AgGD. a A schematic representation of the C-TALE procedure. For the experimental
details, see “Methods” and Additional file 8: Supplementary Methods. b Heatmaps showing C-TALE data normalized by the total number of
sequenc-ing reads in the C-TALE dataset, binned at a 5 Kb resolution and iteratively corrected. Dashed lines show the positions of chromatin contact domain
boundaries identified using the Lavaburst package. Gray triangles in the left panel represent 5C-identified TADs in DT40 cell line. Gene positions are
shown on the diagonal of each panel, and a detailed map of the studied region is presented below the heatmaps. Dark triangles inside the gene boxes
RNA-se q
0 0.05
CTCF ChIP-se
q 10
50
4×10³ -4×10³
Enriched in HD3pr
Enriched in HD3dif
RNA-se q
0 0.05
CTCF ChIP-se
q 10
50
MPG NPRL3 TMEM8A
RHBDF1 AXIN1
π αDαA
MRE 20 Kb
a
b
c
f
d e
4×10³ -4×10³
Enriched in DT40
Enriched in HD3dif
Normalized
C-TA
LE counts (×10
4), n = 55
Normalized
C-TA
LE counts (×10
4), n =
11
17
Contact probability (log)
0 5
10 15 20
2 4 6 8
* * * *
* * * * * * * ** * * *
* * * *
2.6×10⁴ 0 C-TALE counts
bin = 5 Kb
RHBDF1 MPG NPRL3 TMEM8A AXIN1 RGS9
T3
T2 T1
5C-identified TADs C-TALE-identified
sub-TADs Full match between 5C and C-TALE
g
DT40 8 22 60 162 442 HD3pr Distance (Kb) HD3dif
DT40 HD3pr HD3dif
7 8 9
7.5 8.5 9.5
DT40
HD3pr
HD3dif
DT40 HD3pr HD3dif
0.0 0.2 0.4 0.6 0.8 1.0 1.2
Distance between FISH signals
* * * * *
we observed an approximately twofold decrease in CTCF binding at the forward motif within the −3.5 CBSs, and both peaks are strongly reduced in differentiated HD3 cells (Fig. 6b). Considering that in DT40 and proliferating HD3 cells T1 and T2 TADs harbor multiple CBSs con-taining binding motifs in both orientations and that the majority of them are lost in differentiated HD3 cells, we assumed that the T1–T2 boundary could be involved in multiple cell type-specific looping interactions in DT40 and proliferating HD3 cells, but not in differentiated HD3 cells. To test this hypothesis, we performed a high-resolution 3C analysis with the anchor primers placed in DpnII restriction fragments harboring MRE and the −3.5 CBSs.
As anchor primers at −3.5 CBSs and at MRE are
located close to each other, we expected that their 3C profiles would be similar. Indeed, in DT40 cells, both anchors interact strongly with the forward-orientated
−42 CBS located 2 Kb upstream of the MPG gene
(Fig. 6b, c). In both proliferating and differentiated HD3 cells (consistently with the depletion of CTCF binding at the −42 CBS), we observed a two- to threefold depletion of this interaction with both anchors. In a downstream direction relative to the anchor positions, in DT40 and proliferating HD3 cells both anchors exhibit strong loop-ing with the reverse-oriented +46 CBS located within the TMEM8A gene. Unexpectedly, in lymphoid cells, the MRE interacts with the +46 CBS much stronger than the −3.5 CBSs, and that was confirmed in a reciprocal experiment with the anchor primer placed at the +46
CBS (Fig. 6d). Moreover, in proliferating HD3 cells, the interaction of the +46 CBS with the MRE considerably decreases, whereas the interaction with the −3.5 CBSs does not change. Taken together, these observations sug-gest that the MRE potentially forms a direct loop with the +46 CBS in both lymphoid and erythroid cells. Notably, the MRE/+ 46 CBS looping appears to be an alternative for the formation of the alpha-globin active chromatin hub, because our 3C analysis does not reveal reliable spatial interaction between the +46 CBS and the αD pro-moter in any cell type.
Additionally, our 3C analysis does not show spatial con-tacts between the MRE and the promoters of non-globin genes RHBDF1, MPG, TMEM8A, and MRPL28 flanking the alpha-globin gene locus (Fig. 6c). Thus, upregula-tion of the three former genes and downregulaupregula-tion of the
MRPL28 gene in differentiated HD3 cells is not related to looping interactions with MRE.
Discussion
Alpha-globin gene domains of warm-blooded animals are located within areas enriched in widely expressed genes [15, 45]. Here, we find that the majority of such genes sur-rounding the chicken alpha-globin cluster are substan-tially upregulated in erythroid cells induced to terminal differentiation (Fig. 1b, c; Additional file 2: Table S1). At first glance, such upregulation could be considered gen-erally erythroid-specific, particularly for the TMEM8A
that is slightly upregulated even in proliferating HD3 cells as compared to DT40 cells (Fig. 1c, left plot). However, (See figure on previous page.)
Fig. 5 Activation of alpha-globin gene transcription is accompanied by local changes in chromatin interaction profile. a C-TALE heatmaps showing
local chromatin interaction profile in a close vicinity to AgGD (region chr14:11957600-12236390). Black star denotes the boundary between T1 and
T2 TADs. All other notations are as in Fig. 4b. b C-TALE heatmap showing interactions enriched in differentiated HD3 cells as compared to DT40
cells (right part of the map) and to proliferating HD3 cells (left part of the map). The positions of FISH probes are shown with magenta and green
rectangles. Regions of the map corresponding to interactions between FISH probes are encircled with dashed squares. c Schematic representation
C-TALE-identified sub-TADs within T1 and T2 TADs. d The distributions of C-TALE counts corresponding to chromatin interactions inside the sub-TAD
harboring alpha-globin gene cluster. Thick black lines represent median values. Asterisks represent a significant difference with a P-value <10−4
(one-tailed Wilcoxon’s signed-rank test). e The distributions of C-TALE counts corresponding to chromatin interactions between genomic bins, separated
by the distance more than 60 Kb throughout the shown region without including the sub-TAD harboring alpha-globin gene cluster. All notations
are as in panel (d). f Scale-plots showing the dependency of contact probability on genomic distance within the shown region. gViolin plots
show-ing the distributions of spatial distance between FISH probes. White dots represent the medians. Asterisks represent a significant difference with a
P-value <0.01 (two asterisks), and with a P-value <0.001 (three asterisks) (Mann–Whitney rank-sum test). Representative examples of FISH images are
shown on the right. Scale bar 1 µm
(See figure on next page.)
Fig. 6 DpnII 3C-analysis of chromatin contacts of the alpha-globin MRE and nearby CTCF-occupied region −3.5 CBSs. a Map showing the positions
of genes and CTCF ChIP-seq peaks. Test and anchor regions are outlined with gray and pink vertical rectangles, respectively. CBSs are designated
according to their distance (in kilobases) from the MRE. b 3C interaction profile of the −3.5 CBSs. Ligation frequencies averaged between biological
replicates are shown. Error bars represent SEM. Anchor position relative to positions of test regions is outlined with vertical dashed line. Horizontal
gray line represent a relative noise level ±SEM (see “Methods”). A closer view of the CTCF ChIP-seq profile of −3.5 CBS is shown above the diagram.
c 3C interaction profile of the MRE. All notations are as in panel (b). d 3C interaction profile of the +46 CBS. All notations are as in panel (b). e
NPRL3
π
MRE 10 kb
MRPL28
promoter
RHBDF1
promoter promoterMPG TMEM8Apromoter
MRE anchor
Rel. ligation frequency (AU)
MPG
promoter MRE promoterMRPL28
-3.5 CBSs anchor
+46 CBS anchor
DT40 HD3pr HD3dif
a
b
c
d e
αD αA TMEM8A
Rel. ligation frequency (AU)
Rel. ligation frequency (AU)
αD
promoter
αD
promoter MRE -3.5 CBSs
-3.5 CBSs
-3.5 CBSs -42 CB
S
+74 CB S -63 CBS -42 CBS
+29 CBS +46 CBS
+74 CBS
+145 CBS
-63 CB S
-42 CB S
-42 CBS
+29 CB S
+46 CBS
+46 CB S +74 CBS +145 CB
S
-3.5
-42 +46 +74
-3.5
-42 +46 +74
-3.5
-42 +46 +74
DT40
HD3pr
HD3dif
>1.5 1-1.5 0.5-1 <0.5 Rel. ligation frequency
RHBDF1 MPG AXIN1
DT40 CTCF ChIP-seq
HD3pr CTCF ChIP-seq
HD3ind CTCF ChIP-seq
50
10 50
10 50
10
0 1 2
0.5 1.5 2.5
MRPL28
0 1 2
0.5 1.5 2.5
0 1 2
0.5 1.5 2.5
50 10 50 10 50 10
DT40
HD3pr
HD3dif
12067 12071 MRE
CTCF ChIP-seq signal
in the cell line K562, a human counterpart of the chicken HD3 cells, induction of differentiation leads to upregula-tion of the NPRL3 gene but not TMEM8A [28, 46] which in the human genome is located in the neighboring TAD 200 Kb downstream of the AgGD [4]. Consistently, it has been previously suggested that upregulation of the chicken TMEM8A gene in differentiated erythroid cells is likely to be a consequence of it being in close prox-imity to AgGD enabling looping interactions between
TMEM8A and alpha-globin-specific enhancers (−9DHS and 3′-enhancer) but not with the MRE [28] (the latter is supported by our data, Fig. 6c).
In contrast, the genomic position of NPRL3 relative to the alpha-globin gene cluster and its involvement in the regulatory and spatial network of AgGD is conserved in chicken and mammals [18, 26]. The NPRL3 promoter interacts with the MRE, and that could potentially cause its upregulation in differentiated erythroid cells, which, in turn, could have some function in the erythropoiesis. Although there are no studies of the role for the NPRL3
protein product in the maturation of red blood cells, it has been shown that early defects of hematopoiesis in mice may be caused by the knock-out of the NPRL2, a paralog [47] and interacting partner of the NPRL3 within the GATOR1 complex regulating the mTOR pathway [48]. Moreover, NPRL3 is transcribed at high level dur-ing normal in vitro differentiation of the primary human erythroid cells [20, 49]. Thus, transcriptional upregula-tion of the widely expressed gene NPRL3 in differenti-ated erythroid cells is evolutionarily conserved across mammals and birds, and we propose that it might be functionally related to the definitive erythropoiesis in homeotherms.
Similarly to the NPRL3, genomic location of two more housekeeping genes RHBDF1 and MPG upstream of the
NPRL3 is highly conserved in evolution of vertebrates [50]. Upregulation of these genes in differentiated HD3 cells (Additional file 2: Table S1) could be explained by some indirect mechanisms of stimulation rather than by imme-diate impact of MRE, as our 3C analysis shows that MRE does not spatially interact with their promoters (Fig. 6c). In this regard, abundant intergenic transcription covering the entire AgGD in differentiated HD3 cells might be of particu-lar interest. It has been proposed that intergenic transcrip-tion promotes activatranscrip-tion of genomic domains via facilitated spreading of histone acetyltransferases and chromatin remodeling complexes bound to the C-terminal tail of the elongating RNA polymerase II [51]. Possibly, this intergenic transcription contributes to the chromatin decompaction around AgGD (Fig. 5b) in differentiated HD3 cells that induces upregulation of adjacent genes via the increased chromatin accessibility to transcription factors.
At the same time, activation of alpha-globin gene tran-scription is accompanied by an extensive increase in chro-matin interactions within the encompassing sub-TAD (Fig. 5b, d). In chicken erythroid cells, the alpha-globin locus is assembled into an active chromatin hub (ACH) [26]. Formation of this ACH comprised of several loop-ing interactions between functional elements of the locus may explain the overall chromatin compaction within the entire sub-TAD. One of the first steps in the assembly of the alpha-globin ACH is the establishment of spatial con-tacts between the MRE, the NPRL3 promoter, and the promoter of the αD gene [26]. The results of our experi-ments suggest that, to participate in the assembly of ACH, the MRE should be first released from its interactions with the upstream (−42) and the downstream (+46) CBSs. It is tempting to speculate that the removal of CTCF from the T1–T2 boundary and weakening of the correspond-ing loops (Fig. 6a, e) triggers a spatial reconfiguration of the domain, allowing for the assembly of the alpha-globin ACH and reconfiguration of the encompassing sub-TAD. The spectrum of spatial contacts of the MRE in the lym-phoid cells (and partially in proliferating HD3 cells) could be constrained by strong interactions of the upstream −3.5 CBS (Fig. 6b). In other words, when the −3.5 CBS located close to MRE is occupied by CTCF, MRE could preferentially contact the interaction partners of this CBS outside of AgGD. Such looping would restrict the pos-sibility of establishing spatial contacts between the MRE and the downstream promoters of alpha-globin genes.
CTCF in mouse embryonic stem cells does not largely affect the positions of TAD boundaries [55]. Thus, some other additional mechanisms may be responsible for the maintenance of preformed TADs when the CTCF bind-ing at CBSs is decreased. One possibility is that the ter-tiary structure of the chromatin fiber (self-interacting globule) that is initially established by the CTCF/cohesin-dependent looping is further stabilized and maintained by interactions between nucleosomes based on the mechanism of TAD formation in the Drosophila genome that we recently proposed [56]. To this end, it may be of importance that terminally differentiated HD3 cells do not divide. Consequently, the higher-order chromatin structure is not perturbed by mitosis.
In this study, we demonstrated for the first time the presence of TADs and A- and B-like compartments in chicken genome. Although the profiles of A- and B-like chromatin compartments within the studied genomic segment are similar if not identical in the three cell types studied, the contact frequency within the A-like com-partment increases in differentiated HD3 cells (Fig. 2d). Surprisingly, we did not find any relationship between the increase in 5C counts and the increase in of transcrip-tion within the respective genomic bins (Fig. 2f, g). This observation argues that the nature of long-range interac-tions within chromatin compartments could be predomi-nantly stochastic and determined by co-occurrence of chromatin domains within the same volume of nuclear space rather than by specific associations of highly tran-scribed genes. Consistently with the previously observed escape of upregulated genes from the B-compartment during human ESC differentiation [57], full activation of the alpha-globin transcription in differentiated HD3 cells is accompanied by a further segregation of the AgGD from the gene desert (Fig. 2c). Interestingly, other regions of the T1 and T2 TADs do not demonstrate changes in contact frequency with the gene desert, showing that different parts of the same TAD may possess a certain degree of autonomy in establishing long-range spatial contacts.
Conclusions
Taken together, our findings suggest that full activation of the chicken alpha-globin gene domain in differentiated erythroid cells correlates with local as well as large-scale changes in the chromatin folding and gene expression within an extended chromosome region. It contradicts simple models of the genome partitioning into function-ally isolated gene domains sequentifunction-ally located along the chromosome and argues that the effects of tissue-specific transcription activation are not restricted to the host genomic locus but affect the overall chromatin struc-ture and transcriptional output of an extended genomic
neighbourhood. At the same time, our observations dem-onstrate that local reconfiguration of a tissue-specific gene domain may be guided by changes in the 3D pack-aging of an extended genomic region.
Methods
Cell culture
The avian erythroblastosis virus-transformed chicken erythroblast cell line HD3 (clone A6 of line LSCC) and the chicken lymphoid cell line DT40 (CRL-2111, ATCC, London, UK) were grown in Dulbecco’s modified Eagle’s medium (DMEM) supplemented with 2% chicken serum and 8% fetal bovine serum at 37 °C in 5% CO2 atmos-phere. To induce terminal erythroid differentiation, HD3 cells (8 × 10⁵ cells/ml) were incubated in the full growth media supplemented with 10 mM HEPES (pH 8.0) and 20 μM iso-H-7 (1-(5-isoquinolinylsulfonyl)-3-methyl-piperazine dihydrochloride, Fluka, Seelze, Germany) at 42 °C in 100% air atmosphere.
3C library preparation
3C libraries were prepared as described previously [58] with minor modifications. Briefly, after fixation with 2% formaldehyde, the cells were lysed for 15 min in 1.5 ml of ice-cold isotonic lysis buffer (50 mM Tris–HCl (pH8.0), 150 mM NaCl, 0.5% (v/v) NP-40, 1% (v/v) Triton X-100 and 1× Protease Inhibitor Cocktail (Thermo Scien-tific #78430)). The nuclei were harvested, washed twice with 1.12× restriction enzyme buffer (NEB), and then treated with 0.3% SDS which was subsequently diluted to a concentration of 0.1% with 1.12× restriction enzyme buffer and quenched with 1.8% Triton X-100. DNA was digested overnight with 600 U of 100 U/μl of HindIII-HF restriction endonuclease (NEB) or 600 U of 50 U/μl of DpnII restriction endonuclease (NEB) at 37 °C with shaking. The next morning, 200 U of the correspond-ing restriction enzyme was added, and the samples were incubated for 2 h under the same conditions. Then, the samples were heated to 65 °C for 20 min to inactivate the restriction enzyme. The nuclei were washed twice with 100 μl of 1× T4 DNA ligase reaction buffer (Thermo Sci-entific) and resuspended in 300 μl of 1× T4 DNA ligase reaction buffer, 75 U of T4 DNA ligase (Thermo Scien-tific) was added, and the DNA was ligated for 6 h at 16 °C with constant shaking (1400 rpm). After cross-link rever-sal, RNAse A treatment, and single phenol–chloroform extraction followed by ethanol precipitation, the DNA was additionally purified using AMICON Ultra Centrifu-gal Filter Units (0.5 ml, 30 K, Millipore #UFC5030BK) to remove residual salts and DTT.
were designed using Primer Premier 5 software (PRIMER Biosoft International). The sequences of the primers and TaqMan probes are present in Additional file 10: Table S4. A total of 400 ng of the DpnII-3C library was used as a template in PCR. Calibration curves were constructed using four tenfold dilutions of the BAC standard tem-plate (200, 20, 2, and 0.2 pg of the BAC temtem-plate sup-plemented with 50 ng of the chicken genomic DNA per PCR reaction) prepared from an equimolar mixture of the bacterial artificial chromosomes CH261-75C12 and CH261-85E12 (CHORI BACPAC). All 3C experiments were carried out in at least two independent biological replicates. Relative noise level in 3C plots was calculated as described in [59].
5C primer design
5C primers covering region 9.8–12.5 Mb of chicken chromosome 14 were designed for HindIII restric-tion fragments using the alternating scheme in my5C. primers [60] with the following parameters: (1) an opti-mal primer length of 30 bp; (2) an optiopti-mal Tm of 65 °C; and (3) a default primer quality parameters (mer: 800, U-blast: 3 and S-blast: 50). Primers were not designed for large (>50 Kb) and small (<100 bp) restriction fragments, low-complexity and repetitive sequences. Primers with sequence matches to more than one genomic target were discarded.
The universal T7-tail (5′-TAATACGACTCACTATAG
CC-specific part-3′) and T3-tail (5′-TCCCTTTAGTGAG GGTTAATA-specific part-3′) were added to the forward and reverse 5C primers, respectively. 5′-ends of reverse 5C primers were phosphorylated. In total, 93 forward and 92 reverse primers were designed (Additional file 4: Table S2).
5C library preparation
5C libraries were prepared in two biological replicates as described previously [36] with minor modifications. Briefly, 5C primer stocks (17 mM) were mixed and diluted in water to a final concentration of 1.7 nM of each primer. 5C primers were mixed with 3C libraries in 10 μl of annealing mixtures of the following composition: 1 μl of 10× NEBuffer 4 (NEB), 1.7 μl of 5C primer mix, 600 ng of 3C library, 900 ng of salmon testis DNA (Sigma) son-icated to a size of 100–500 bp, and mQ water. Samples were denatured for 5 min at 95 °C and annealed for 16 h at 57 °C. Samples were supplemented with pre-heated 1× Taq DNA ligase buffer, and ligation with 10 U of Taq DNA ligase (NEB) was performed for 1 h at 57 °C. After that, the samples were quickly frozen at −80 °C. A total of 2 μl of each 5C library was then PCR-amplified indi-vidually with primers to T7- and T3-tails using KAPA High Fidelity DNA Polymerase (KAPA). The temperature
profile was 5 min at 98 °C, followed by 22, 24, 26, 28, and 30 cycles of 20 s at 98 °C, 15 s at 65 °C, and 20 s at 72 °C. The PCR reactions were separated on a 2% agarose gel supplied with ethidium bromide, and the number of PCR cycles necessary to obtain a sufficient amount of DNA was determined based on visual inspection of gels (typically 28–30 cycles). Four preparative PCR reactions were performed for each sample. The PCR mixtures were combined, and the products were purified with a QIA-GEN PCR Purification Kit. The DNA was eluted with 50 μl of 10-mM Tris–HCl (pH 8.0) and separated on a 1.8% agarose gel supplied with ethidium bromide; 100-bp fragments were excised from the gel, purified using a QIAGEN Gel Extraction Kit and sequenced on Illumina HiSeq 2000 using single-end 101-nt reads.
C‑TALE library preparation
For the experimental details, see Additional file 8: Sup-plementary Methods. Briefly, biotinylated hybridization baits were produced from BACs covering the region of chromosome 14 with coordinates 11721574-12436767 (galGal4 genome assembly) by ultrasonic fragmentation of BAC DNA to a size of 200–600 bp with subsequent adapter ligation and PCR amplification with biotinylated primers. Hi-C libraries were hybridized with the baits for 40 h at 65 °C, the trapped portion of the Hi-C libraries was PCR-amplified with Illumina PE1.0 and PE2.0 prim-ers, and the products of amplification were subjected to the second round of hybridization with the same condi-tions. After that, trapped fragments of the Hi-C library were PCR-amplified with Illumina PE1.0 and PE2.0 prim-ers and sequenced on Illumina HiSeq 2000 using paired-end 101-nt reads.
5C raw data processing and analysis, and CTCF binding motif search
all three cell types (Pearson’s correlation coefficient >0.9, Additional file 3: Figure S2), we merged them by sum-ming their matrices element by element. To reduce noise and achieve better visualization, we smoothed the data by assigning each matrix element the median 5C count between this element and its adjacent elements. Zero matrix elements were not smoothed to avoid inflating low-confidence interaction values.
TADs were identified using the Lavaburst package (https://github.com/mirnylab/lavaburst), which provides a set of dynamic programming algorithms to assess an ensemble of TAD segmentations derived from a TAD scoring function. We used its optimal segmentation finder, which is based on the Armatus algorithm [41] using the TAD scoring function from that study. The algorithm finds the global TAD segmentation of a contact map having the highest aggregate score.
Chromatin compartments were identified using the principal component analysis, as described previously [37].
A CTCF motif search was performed using the
Biopy-thon motif search method [62] and the human CTCF
position-frequency matrix from the JASPAR database [63].
C‑TALE raw data processing and analysis
Illumina HiSeq 2500 bcl2fastq v1.8.4 Conversion Soft-ware was used for base-calling. The reads were mapped independently to the region 11700000-12450000 of chromosome 14 using hiclib [38] (https://bitbucket.org/ mirnylab/hiclib/) iterative mapping procedure (minimal mapping length 25, iteration step 5) and Bowtie 2 version 2.2.1.
Reads mapped in close proximity to DpnII restric-tion sites (5 bp) and possible PCR duplicates were elimi-nated. We also excluded reads mapped to extremely short (<100 bp) and long (>100 Kb) restriction fragments. The reads in pairs that mapped to the same restriction frag-ment or closer than 500 bp to each other in genomic coordinates were excluded as potential self-ligations and dangling end products. Uniquely mapped read pairs that passed filtering procedure were retained. Resulting pairs were binned into 5 Kb genomic windows of the region of interest. Bins corresponding to interactions within the same fragment were removed. For each bin, the mean C-TALE read count was calculated. To merge C-TALE replicates, we summed their matrices element by ele-ment. Then, the matrices were iteratively corrected [38]. TAD annotation was performed with the Lavaburst pack-age as described for 5C. To minimize the effect of miss-ing data on TADs annotation procedure, we removed bins with no interactions from the matrices prior to TAD annotation.
3D DNA fluorescence in situ hybridization (3D FISH)
The cells were harvested overnight on poly-l-lysine coated coverslips placed in culture flasks. The cells were fixed in 4% paraformaldehyde for 10 min, permeabilized in 0.5% Triton X-100, washed in PBS, dehydrated in etha-nol series, air-dried, stored at room temperature for two days, and then frozen at −80 °C. Probes were PCR-ampli-fied from the CH261-75C12 BAC, primer sequences are presented in Table S4 (Additional file 10). Probes were labeled with biotin or digoxigenin using nick-translation. Approximately 150 ng of each probe was used in hybridi-zation. Denaturation was performed at 80 °C for 30 min in 70% formamide (pH7.5), 2xSSC. Hybridization of probes was done for 24 h in 50% formamide, 2x SSC, 10% dextran sulfate, 1% Tween 20. Washing steps were per-formed in 2x SSC at 45 °C followed by 0.1x SSC at 60 °C and 4x SSC, 0.1% Triton X-100. For imaging, cells were counterstained with DAPI and epifluorescent images were acquired using a Photometrics Coolsnap HQ2 CCD camera and a Zeiss Imager A1 fluorescence microscope with a Plan Apochromat 100x 1.4NA objective, a Lumen 200-W metal halide light source (Prior Scientific Instru-ments, Cambridge, UK) and Chroma #89014ET single excitation and emission filters (Chroma Technology Corp., Rockingham, VT) with the excitation and emis-sion filters installed in Prior motorized filter wheels. A piezoelectrically driven objective mount (PIFOC model P-721, Physik Instrumente GmbH & Co, Karlsruhe) was used to control movement in the z dimension. Hardware control, image capture, deconvolution (using the fast algorithm) and analysis were performed using Volocity (PerkinElmer Inc, Waltham, MA).
Polymer simulations
Total rRNA‑depleted RNA‑seq: experimental procedures and analysis
RNA-seq experiments were performed in two inde-pendent biological replicates, according to ENCODE
recommendations (https://genome.ucsc.edu/ENCODE/
protocols/dataStandards/ENCODE_RNAseq_Standards_ V1.0.pdf). The two biological replicates demonstrated a high correlation in all three cell types (Pearson’s r > 0.95).
Total RNA was extracted from the cells using TRIzol Reagent (Thermo Scientific) according to the manufac-turer’s protocol. Total RNA was depleted with ribosomal RNA using the RiboZero Human/Mouse Kit (Illumina). For library preparation, a TruSeq Stranded RNA Sample Prep Kit (Illumina) was used following the manufacturer’s instructions. After preparation, the quality of the libraries was evaluated using quantitative PCR and Bioanalyzer.
Illumina Casava 1.8.2 was used for base-calling. Reads were mapped to the Gallus gallus reference genome (ver-sion galGal4) using the TopHat program [65] taking the ENSEMBL gene annotation into account (Ensembl Release 82) with the -no-novel-juncs option. The Htseq-counts program [66] was used to calculate per gene counts. The BedTools program [67] was used to calculate read coverage.
We used R package edgeR for gene expression analy-sis. Only genes with CPM > 1 in at least two out of six RNA-seq experiments were retained. We averaged CPM over replicates and calculated fold change of expression between experiments. P-values were calculated per gene using quasi-likelihood negative binomial generalized log-linear model (glmQLFit function in edgeR). The P-values were adjusted with Benjamini–Hochberg correction for multiple testing. The threshold for false discovery rate was set to 1e-7 for detection of differentially regulated genes. For gene ontology analysis, we used DAVID as imple-mented in RDAVIDWebService R package. We assessed the enrichment of gene ontology terms of “Biological Process” category for the genes that changed expression level more than twofold with adjusted P-value <1e-04. The minimal number of genes present in the gene ontol-ogy category was set to 5. Resulting DAVID P-values of enriched terms were adjusted with Bonferroni correction.
To assess the intergenic transcription levels, we retrieved the regions between ENSEMBL genes and cal-culated read coverage with BedTools software [67]. To compare the transcription level between experiments for each intergenic loci, log2-fold change of coverage was calculated. We obtained the distribution of fold change between experiments for all intergenic regions and assessed the percentile rank of loci within the studied region.
Additional files
Additional file 1: Figure S1. Analysis of the total rdepleted
RNA-seq data in the three studied cell types. (A) The Venn diagram showing the numbers of active genes shared between the studied cell types. (B)
Cluster analysis of biological replicates based on total rRNA-depleted RNA-seq data. (C) Principal component analysis of the RNA-seq data. (D)
Top-30 gene ontology terms for the genes downregulated (logFC < −0.6, FDR < 10−7) in differentiated HD3 cells compared to proliferating HD3
cells. The number of genes in each term is shown. (E) Scatter plots show-ing normalized level of transcription within intergenic regions genome-wide in the studied cell types.
Additional file 2: Table S1. Transcription level of the genes from the
studied region (CPM). Only genes with CPM > 1 in at least 2 replicates are presented. CPM values were averaged over replicates. Log2-fold change and FDR of difference between experiments are presented (see
“Methods”). For genes that have not passed filtering procedure, only CPM
are present.
Additional file 3: Figure S2. Biological replicates of the 5C experiment.
Color intensity in each cell of the heatmaps represents the interaction fre-quency of two corresponding forward and reverse 5C primers. Histograms of the interaction counts are shown to the right of the heatmaps.
Additional file 4: Table S2. Sequences and characteristics of the 5C
primers used in this study. 5C primers were designed using the alternat-ing scheme in my5C.primers and chicken reference genome assembly galGal4.
Additional file 5: Figure S3. The chromatin compartment profile
along the studied genomic region. (A) Heatmaps demonstrating an increased interaction frequency between gene-rich zones I and III in both lymphoid and erythroid cells. A-like and B-like chromatin compartments are outlined using black opened rectangle and black dotted triangle, respectively. The first principal component is shown below the heatmaps.
(B) The 4C profiles from [39] revealing an increased interaction frequency of the alpha-globin gene domain (zone III of the studied region) with the USP7-ABAT locus (zone I), and the spatial separation of the gene desert from flanking gene-dense areas in proliferating HD3 and DT40 cells. Posi-tions of the anchor primers are shown using red vertical lines; the alpha-globin gene domain is highlighted with a vertical pink rectangle. The first principal component (PCA1) of the 5C data (DT40 cells) is shown below the 4C profiles. The blue rectangle below the genomic coordinates track represents the genomic region analyzed in this work. The scale is changed at the bottom of the panel to emphasize the borders of 4C counts peak around the anchor. Positions of TADs that were identified using the 5C analysis are highlighted using gray rectangles.
Additional file 6: Figure S4.(A) Interaction heatmaps of the simulated
polymer calculated with TADbit. Color bars in the heatmaps represent arbitrary partitioning of the studied region into several distinct fragments.
(B) IMP-derived 3D models of the studied genome region. The central wireframe colored as the color bar in the map of the studied region represents the centroid model for simulations. The surface represents the Gaussian approximation of 1000 simulated models.
Additional file 7: Table S3. Genomic coordinates of topologically
associ-ating domains within the studied region. TADs were identified using the optimal segmentation algorithm from the Lavaburst package with the with the Armatus scoring function.
Additional file 8: Supplementary Methods. A detailed description of
the C-TALE library preparation.
Additional file 9: Table S5. C-TALE sequence statistics.
Additional file 10: Table S4. Sequences of primers and TaqMan probes