PRIMARY RESEARCH
Hyperglycemia promotes Snail-induced
epithelial–mesenchymal transition of gastric
cancer via activating ENO1 expression
Xin Xu
1,2, Bang Chen
1,2, Shaopu Zhu
1,2, Jiawei Zhang
2, Xiaobo He
1,2, Guodong Cao
1*and Bo Chen
2*Abstract
Background: Gastric cancer (GC) is one of the most common gastrointestinal malignancies worldwide. Emerging evidence indicates that hyperglycemia promotes tumor progression, especially the processes of migration, invasion and epithelial–mesenchymal transition (EMT). However, the underlying mechanisms of GC remain unclear.
Method: Data from the Gene Expression Omnibus (GEO) and The Cancer Genome Atlas (TCGA) databases were used to detect the expression of glycolysis-related enzymes and EMT-related transcription factors. Small interfering RNA (siRNA) transfection was performed to decrease ENO1 expression. Immunohistochemistry (IHC), Western blot and qRT-PCR analyses were used to measure gene expression at the protein or mRNA level. CCK-8, wound-healing and Transwell assays were used to assess cell proliferation, migration and invasion.
Results: Among the glycolysis-related genes, ENO1 was the most significantly upregulated in GC, and its overexpres-sion was correlated with poor prognosis. Hyperglycemia enhanced GC cell proliferation, migration and invaoverexpres-sion. ENO1 expression was also upregulated with increasing glucose concentrations. Moreover, decreased ENO1 expression partially reversed the effect of high glucose on the GC malignant phenotype. Snail-induced EMT was promoted by hyperglycemia, and suppressed by ENO1 silencing. Moreover, ENO1 knockdown inhibited the activation of transform-ing growth factor β (TGF-β) signaltransform-ing pathway in GC.
Conclusions: Our results indicated that hyperglycemia induced ENO1 expression to trigger Snail-induced EMT via the TGF-β/Smad signaling pathway in GC.
Keywords: Hyperglycemia, Epithelial–mesenchymal transition, ENO1, Gastric cancer
© The Author(s) 2019. This article is licensed under a Creative Commons Attribution 4.0 International License, which permits use, sharing, adaptation, distribution and reproduction in any medium or format, as long as you give appropriate credit to the original author(s) and the source, provide a link to the Creative Commons licence, and indicate if changes were made. The images or other third party material in this article are included in the article’s Creative Commons licence, unless indicated otherwise in a credit line to the material. If material is not included in the article’s Creative Commons licence and your intended use is not permitted by statutory regulation or exceeds the permitted use, you will need to obtain permission directly from the copyright holder. To view a copy of this licence, visit http://crea-tivecommons.org/licenses/by/4.0/. The Creative Commons Public Domain Dedication waiver ( http://creativecommons.org/publicdo-main/zero/1.0/) applies to the data made available in this article, unless otherwise stated in a credit line to the data.
Background
Gastric cancer (GC) is the fifth most common malig-nancy worldwide, and the third leading cause of cancer-related mortality [1]. It is widely known that metabolic syndrome plays an important role in GC and influences the prognosis of cancer patients [2]. Diabetes mellitus (DM) is a group of metabolic disorders characterized by persistent hyperglycemia. Cancer and DM are major
public health problems worldwide, and these two condi-tions are closely related. A large body of epidemiologic evidence suggests that H. pylori infection, which is recog-nized as a major risk factor for GC [3], could increase the rate of DM [4, 5]. Interestingly, hyperglycemia can also increase the risk of GC posed by H. pylori infection [6].
Many GC patients are at an advanced stage when diag-nosed and thus have a poor prognosis, and metastasis is the major reason for cancer-related death [7]. Previous studies have revealed that hyperglycemia contributes to cell invasion and metastasis in multiple cancers [8,
9]. Recent investigations have shown that epithelial– mesenchymal transition (EMT) is a reversible cellular
Open Access
*Correspondence: ayfycgd@163.com; chenbo831116@163.com 1 Anhui Medical University, Hefei 230022, China
programme, that could be a critical early event in tumor metastasis [10]. However, the mechanism of this phe-nomenon in GC remains unknown.
As one of the fundamental hallmarks of cancer [11], the altered energy metabolism of cancer cells has attracted increased attention. Aerobic glycolysis, known as the Warburg effect, is the most widely studied process and is characterized by increased glycolytic activity and lactate production even in the presence of adequate oxygen [12]. Tumor cells gain a steady supply of ATP and biosynthetic raw materials through aerobic glycolysis [13]. Unfortu-nately, hyperglycemia provides a favorable microenvi-ronment for the growth and survival of tumor cells. The result of our bioinformatic analysis showed that among the glycolysis-related enzymes, enolase 1 (ENO1) was the most highly overexpressed gene in GC. Previous studies have demonstrated that ENO1 is deregulated in various malignancies such as glioma, hepatocellular cancer, non-small cell lung cancer and GC [14–17]. Growing evidence indicates that ENO1 plays an oncogenic role in many cancers and is associated with a poor prognosis [18]. However, data regarding the clinicopathological signifi-cance of ENO1 expression in GC tissues are limited. In addition, to the best of our knowledge, very few studies have evaluated the effect of hyperglycemia on the expres-sion of ENO1.
In this study, we propose that hyperglycemia promotes the progression of EMT via activating ENO1 expression in GC. To test this hypothesis, the relationship between ENO1 expression and the clinicopathological features of GC patients were initially examined. Then, we detected the expression of ENO1 and EMT-related genes under different glucose concentrations. Furthermore, we inves-tigated changes in the EMT-related genes and trans-forming growth factor β (TGF-β) signaling pathway expression when ENO1 was downregulated by small interfering RNA (siRNA). Here, we hope to provide theo-retical and experimental support for the treatment of GC patients, especially those with DM.
Materials and methods
Online databases
To detect the expression level of glycolysis-related enzymes in GC, we downloaded the gene expression pro-filing dataset (GSE79973), which included 10 pairs of GC tissues and adjacent non-tumor mucosae, from the Gene Expression Omnibus (GEO) database (http://www.ncbi. nlm.nih.gov/geo/). The data analysis was performed by GEO2R (http://www.ncbi.nlm.nih.gov/geo/geo2r /). We also downloaded RNA-Seq data of 375 GC tissues and 32 normal tissues from The Cancer Genome Atlas (TCGA). GSE84437, which contains 433 GC tissues, was selected to investigate the relationship between ENO1 and Snail
expression. Survival analysis was performed to assess whether the expression of ENO1 was correlated with GC patient outcomes based on the online database Kaplan– Meier Plotter (KM plotter, http://kmplo t.com).
Patients and tissue specimens
A total of 121 primary GC tissue samples and 30 adja-cent nontumor tissues were collected from patients with pathologically and clinically confirmed at the First Affili-ated Hospital of Anhui Medical University. In addition, 4 fresh primary cancer and paired adjacent normal tissue specimens were also collected. All patients had received radical gastrectomy without preoperative chemo- or radiotherapy between October 2011 and December 2012. The clinical and pathological data were summarized in detail, and the patients were staged according to the 8th edition AJCC staging system. The follow-up time ranged from 2 months to 65 months and the median time was 17 months.
Cell culture and transfection
The human GC cell lines AGS and MGC803 were pur-chased from the Chinese Academy of Sciences (Shanghai, China). The cells were cultured in Dulbecco’s modified Eagle’s medium (DMEM; HyClone, Logan, UT) sup-plemented with 10% fetal bovine serum (FBS; Biological Industries, Israel) and antibiotics (100 U/mL penicillin, 100 μg/mL streptomycin). Cells were cultured in increas-ing concentrations of glucose at 5.5, 10, 15 and 25 mM to simulate a high-glucose environment. The cells at pas-sages 8–15 were used for the subsequent experiments. All cells were maintained in a humidified incubator at 37 °C in an atmosphere of 95% air and 5% CO2.
SiRNA targeting ENO1 (siENO1) and negative con-trol siRNA were designed and synthesized by Genechem Co., Ltd (Shanghai, China). Cells were transfected with siRNA using the transfection reagent Lipofectamine 2000 (Invitrogen) according to the manufacturer’s protocol. The ENO1 siRNA sequences were as follows: forward: 5′-CCC AGU GGU GUC UAU CGA ATT-3′ and reverse: 5′-UUC GAU AGA CAC CAC UGG GTT-3′.
working solution was applied, and the slides were coun-terstained with hematoxylin.
The results were independently analyzed by two clini-cal pathologists according to a semi-quantitative method based on both the percentage of positive cells (0, no staining; 1, 0–25%; 2, 26%–50%; 3, 51%–75%; 4, 76%– 100%) and staining intensity (0, negative; 1, weak; 2, moderate; 3, strong) [19]. The final score was the product of the staining intensity and the percentage of positive cells. High expression was defined as a scoring index ≥ 8, and low expression was defined as a scoring index of 0–8.
RNA extraction and quantitative real‑time PCR (qRT‑PCR) Total RNA was extracted from cells using TRIzol rea-gent (Invitrogen, USA) according to the manufacturer’s instructions. RNA was reverse-transcribed into cDNA with PrimeScript RT-polymerase (Takara Bio, Dalian, China). Then, qRT-PCR was performed with SYBR Green assay kit (Takara, Japan). The reaction conditions were as follows: initial denaturation at 95 °C for 10 min, followed by 40 cycles of denaturation at 95 °C for 20 s, annealing at 60 °C for 20 s and extension at 72 °C for 30 s. The primer sequences were as follows: ENO1 forward: 5ʹ-CCC AGU GGU GUC UAU CGA ATT-3ʹ, reverse: 5ʹ-UUC GAU AGA CAC CAC UGG GTT-3; GAPDH forward: 5′-GCA TCC TGG GCT ACACT-3′, reverse: 5′-CAC CAC CCT GTT GCTGT-3′. The 2−ΔΔCt method was used to calculate the relative ENO1 mRNA expression and GAPDH was used as the internal control.
Western blot
RIPA lysis buffer (Beyotime, Shanghai, China) was used to extract total protein. The protein concentration was quantified using a BCA protein assay kit (Beyotime, Shanghai, China). The equal quantities of proteins were separated by 6–10% SDS-PAGE gel electrophoresis and then transferred onto polyvinylidene fluoride mem-branes. After the membranes were blocked in 5% skim milk powder with 0.1% Tween-20 for 1 h at room tem-perature, they were incubated with primary antibodies against ENO1 (1:1000, Affinity Biosciences, OH, USA), E-cadherin (1:1000, Cell Signaling Technology, MA, USA), N-cadherin (1:1000, Cell Signaling Technology, MA, USA), Vimentin (1:1000, Cell Signaling Technol-ogy, MA, USA), Snail (1:1000, Elabscience Biotechnol-ogy, Wuhan, China), p-Smad2 (1:1000, Cell Signaling Technology, MA, USA), Smad2 (1:1000, Cell Signaling Technology, MA, USA), p-Smad3 (1:1000, Cell Signaling Technology, MA, USA), Smad3 (1:1000, Cell Signaling Technology, MA, USA) and TGF-β (1:1000, Cell Signal-ing Technology, MA, USA) overnight at 4 °C. After wash-ing three times in TBST, the membranes were incubated with secondary antibody for 1 h at room temperature.
Finally, the protein bands were visualized using an enhanced chemiluminescence (ECL) detection system. The protein band intensities were normalized to the GAPDH intensity.
Cell counting kit‑8 (CCK‑8) assay
GC cell proliferation was measured with a CCK-8 assay (Dojindo, Tokyo, Japan). Briefly, cells in the logarithmic phase were plated onto 96-well plates at a density of 3000 cells per well. A volume of 10 µL of CCK-8 solution was added to each well at the indicated times (24, 48, 72, and 96 h), followed by 1.5 h of incubation. The relative opti-cal density (OD) was measured at 450 nm using an auto-mated plate reader (Bio-Rad, USA).
Wound‑healing assay
Differently treated cells were seeded in a 6-well plate and grown to 90% confluence in 2 mL of culture medium and incubated at 37 °C with 5% CO2. A 200 µL plastic tip was used to create an artificial wound. After washing with phosphate buffer saline (PBS), cells were incubated in fresh medium with 1% FBS. Images were taken at 0 and 48 h after scratching. Cell mobility = (0 h width − 48 h width)/0 h width × 100%.
Migration and invasion assays
Cell migration and invasion assays (Corning Life Sci-ences, Bedford, MA, USA) were performed using 24-well plates with a pore size of 8 μm. Matrigel invasion was used to assess the GC cell migratory and invasive abili-ties. For migration assays, GC cells were seeded in the upper chamber with 200 µL serum-free DMEM at a density of 5 × 10⁴ cells/well and the lower chamber was filled with 600 µL of culture medium containing 20% FBS. After incubation for 24 h, the non-migrated cells were carefully removed with a wet cotton swab. Finally, the cells were stained with 4% paraformaldehyde, stained with 0.5% crystal violet and counted under a microscope (100× magnification). The cell invasion assay was car-ried out similarly, but the chambers were coated with Matrigel (BD Biosciences, USA) before cells were seeded on the membrane.
Statistical analysis
multivariate analyses were performed by using a Cox proportional hazards model. Spearman’s correlation analysis was used to identify the correlation between ENO1 expression and EMT-related transcription factors.
P < 0.05 was considered significant. Results
ENO1 was upregulated in GC tissues and correlated with poor prognosis
To identify the potential enzymes involved in GC pro-gression, the mRNA expression data of glycolysis-related genes were extracted from the GEO database (GSE79973) for bioinformatic analysis. As shown in Table 1, GC tis-sues exhibited elevated expression of ENO1 (adjusted P
value = 0.009) and PKM (adjusted P value = 0.039). As the most significantly upregulated glycolysis-related gene, ENO1 was chosen for further study. The results based on GSE79973 and TCGA data analysis showed that the expression of ENO1 was significantly higher in tumor tis-sues compared with that in normal tistis-sues (Fig. 1a, b). A similar result was found with Western blotting (Fig. 1c).
Furthermore, to determine the clinical significance of ENO1, we used IHC staining to examine the ENO1
protein expression in GC tissues. High ENO1 protein expression was present in 84/121 (69.4%) GC speci-mens, while 26/30 (86.7%) adjacent normal tissues showed low expression (P < 0.001, Table 2). Representa-tive images with different levels of ENO1 and statisti-cal analysis are shown in Fig. 1d, e. The results of the clinicopathological correlation study revealed that ENO1 overexpression was significantly associated with lymph node metastasis (P = 0.003), distant metastasis (P = 0.015) and TNM stage (P < 0.001) (Table 3). Nota-bly, we observed that patients with high preoperative blood glucose had slightly increased levels of ENO1 in the GC tissues (P = 0.039). Overall survival (OS) analy-sis indicated that the patients with high expression of ENO1 had a shorter survival time than those with low expression (logrank P = 0.001, Fig. 1f). As shown in Fig. 1g, the result was further verified based on KM plotter. In addition, univariate Cox regression analy-sis showed that preoperative blood glucose (P < 0.001), lymph node metastasis (P = 0.013), distant metastasis (P < 0.001), TNM stage (P = 0.006) and ENO1 expres-sion (P = 0.001) were associated with OS. Multivariate Cox regression analysis showed that preoperative blood glucose (P = 0.031), distant metastasis (P = 0.003) and ENO1 expression (P = 0.024) were independent prog-nostic factors for OS of GC (Table 4).
Hyperglycemia facilitated GC cell proliferation, migration, invasion and ENO1 expression
As we observed that high blood glucose was associated with poor prognosis, we treated GC cells (AGS and MGC803) in culture with different concentrations of glucose (5.5, 10, 15 and 25 mM) in vitro. Subsequently, to investigate the effect of high glucose on the prolifera-tion, migration and invasion of GC cells, CCK-8, migra-tion and invasion assays were performed, respectively. As shown in Fig. 2a, compared with that in the normal glucose group, the proliferation rate in all hyperglyce-mia groups was significantly upregulated in the two cell lines at various time points. The results of transwell assays revealed that the migratory and invasive capabil-ities of the GC cells were significantly enhanced in the hyperglycemia groups (Fig. 2b, c). In addition, as the concentration of glucose increased, the ENO1 mRNA and protein levels gradually increased in the AGS and MGC803 cells (Fig. 2d, e). In other words, the expres-sion of ENO1 appeared to be induced by glucose in a concentration-dependent manner in vitro. Together, our present findings indicated that hyperglycemia pro-moted GC cell proliferation, migration and invasion, as well as ENO1 expression.
Table 1 The detail information of glycolysis-related genes expression based on GSE79973
a Adjusted P-value b Log fold change
ID Gene symbol adj. P‑valuea P‑value logFCb
217294_s_at ENO1 0.008592 8.94E−05 1.4491932
201251_at PKM 0.038831 1.96E−03 1.1217714
227068_at PGK1 0.065488 5.55E−03 0.5725665
200650_s_at LDHA 0.101375 1.29E−02 0.4574512
201037_at PFKP 0.20671 4.89E−02 0.4500467
M33197_5_at GAPDH 0.120333 1.80E−02 0.4460345
205736_at PGAM2 0.662796 4.22E−01 0.3678693
210976_s_at PFKM 0.498706 2.48E−01 0.2746726
201313_at ENO2 0.617634 3.70E−01 0.2600634
211167_s_at GCK 0.821298 6.49E−01 0.192802
200886_s_at PGAM1 0.80052 6.14E−01 0.0622324
214687_x_at ALDOA 0.243907 6.56E−02 − 0.2745198
201102_s_at PFKL 0.154507 2.86E−02 − 0.3557137
201249_at SLC2A1 0.52358 2.70E−01 − 0.3966075
217009_at PGK2 0.581161 3.29E−01 − 0.4859326
202934_at HK2 0.435741 1.92E−01 − 0.5911105
201030_x_at LDHB 0.273184 8.04E−02 − 0.708974
1553837_at PGAM5 0.060965 4.86E−03 − 0.8898033
206603_at GLUT4 0.198491 4.53E−02 − 1.3422707
209696_at FBP1 0.018156 4.22E−04 − 1.3654888
206844_at FBP2 0.04158 2.29E−03 − 4.0148564
ENO1 silencing suppressed hyperglycemia‑induced proliferation, migration and invasion of GC cells
To further elucidate the role of ENO1, we first down-regulated ENO1 expression using siRNA in AGS
and MGC803 cells, which were cultured with 5.5 or 25 mM glucose. Western blot and qRT-PCR analysis showed that the expression of ENO1 was significantly decreased by siRNA (Fig. 3a, b). ENO1 knockdown sig-nificantly weakened the GC cell proliferative capacity in both the normal glucose and hyperglycemia groups compared with the control groups (Fig. 3c). Next, wound healing and transwell assays were employed to further investigate the effects of ENO1 on the migra-tion and invasion of GC cell in vitro. The results of the wound healing and transwell migration assays demon-strated that GC cell migration was effectively inhibited by ENO1 silencing (Fig. 3d, e). Consistently, the tran-swell invasion assay revealed a similar effect on AGS Fig. 1 ENO1 was upregulated in GC tissue and was associated with poor prognosis. a, b The expression of ENO1 was determined based on the GSE79973 and TCGA databases. c Western blot analysis detected ENO1 expression in GC and adjacent normal tissues. d Representative ENO1 IHC staining in GC specimens (×200 magnification). e The statistical analysis of ENO1 expression in GC and adjacent normal tissues. f, g Kaplan–Meier survival curves of GC patients with low and high ENO1 expression in our study or in the KM plotter database. *P < 0.05
Table 2 The expression of ENO1 in GC and adjacent normal tissues
* Statistically significant (P < 0.05)
Parameters Cases ENO1
expression χ
2 P‑value
High Low
GC tissues 121 84 37 31.103 < 0.001*
and MGC803 cells invasion with different glucose con-centrations (Fig. 3f). These results indicated that ENO1 silencing could inhibit hyperglycemia-induced GC cell growth, migration and invasion.
Snail‐mediated EMT was responsible for hyperglycemia/ ENO1‐induced GC malignant phenotype
It is well known that the EMT can enhance many cancer metastatic phenotypes, including migration, invasion and metastasis, during tumor progression. The activation of EMT is regulated by multiple transcription factors, such as Snail, Slug and Twist. To explore the possible relation-ship between ENO1 and EMT-related transcription fac-tors, we performed correlation analysis using data from a large sample from GSE84437 (including 433 GC sam-ples) and TCGA (including 375 GC samsam-ples). Among these transcription factors, only Snail was significantly positively correlated with the expression of ENO1 in both the GSE84437 (r = 0.266, P < 0.001) and TCGA (r = 0.146,
P = 0.005) datasets (Fig. 4a–f).
As shown in Fig. 4g, the expression of E-cadherin (epi-thelial marker) was decreased, while the expression of N-cadherin and Vimentin (mesenchymal markers) was increased with increasing glucose concentrations. Snail expression was also significantly upregulated in the hyperglycemia groups compared with the normal glu-cose group. This result indicated that a hyperglycemic environment might induce GC cell EMT and stimulate migration and invasion in vitro. Mechanistically, the Western blot results analysis showed that ENO1 knock-down suppressed hyperglycemia-induced decreases in E-cadherin and increases in N-cadherin, Vimentin and Snail (Fig. 4h). These data revealed that ENO1 might play an important role in hyperglycemia-induced EMT.
Table 3 Correlation of ENO1 expression with clinicopathologic parameters in GC patients
a Preoperative fasting blood glucose
* Statistically significant (P < 0.05)
Parameters Cases ENO1
expression χ
2 P‑value
High Low
Gender 1.422 0.233
Male 75 55 20
Female 46 29 17
Age (years) 0.124 0.724
≥ 60 94 66 28
< 60 27 18 9
Blood glucose (mmol/L)a 4.269 0.039*
≥ 7 19 17 2
< 7 102 67 35
Tumor size (cm) 0.230 0.631
≥ 5 68 46 22
< 5 53 38 15
Differentiation 0.767 0.381
Well + moderate 39 25 14
Poor 82 59 23
Lymph node metastasis 8.687 0.003*
Yes 90 69 21
No 31 15 16
Distant metastasis 5.868 0.015*
Yes 12 12 0
No 109 72 37
TNM stage 23.869 < 0.001*
I + II 43 18 25
III + IV 78 66 12
Table 4 Univariate and multivariate analysis of clinicopathological variables and ENO1 expression associated with overall survival
a Preoperative fasting blood glucose
* Statistically significant (P < 0.05)
Parameters Univariate analysis Multivariate analysis
HR (95% CI) P‑value HR (95% CI) P‑value
Gender 1.075 (0.688–1.679) 0.750
Age (years) 1.033 (0.611–1.747) 0.903
Blood glucose (mmol/L)a 3.082 (1.708–5.558) < 0.001* 2.020 (1.067–3.825) 0.031*
Tumor size (cm) 1.329 (0.852–2.071) 0.209
Differentiation 1.624 (1.000–2.639) 0.050
Lymph node metastasis 1.983 (1.159–3.394) 0.013* 1.447 (0.646–3.242) 0.369
Distant metastasis 5.164 (2.588–10.307) < 0.001* 3.063 (1.461–6.424) 0.003*
TNM stage 1.926 (1.207–3.072) 0.006* 1.067 (0.511–2.224) 0.864
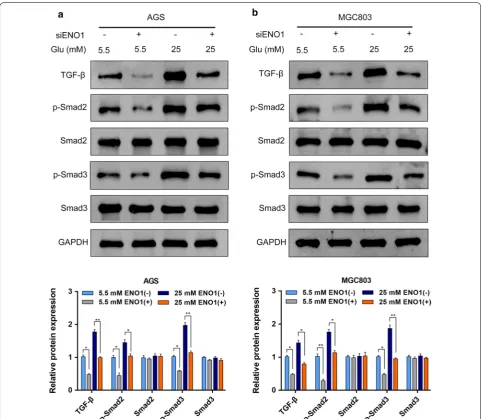
Downregulation of ENO1 inhibited the TGF‑β/Smad signaling pathway
The TGF-β/Smad signaling pathway has a critical role in cancer development, and more importantly, it could also regulate EMT to promote cancer cell migra-tion, invasion and metastasis. To elucidate the specific mechanisms, we further examined the effect of ENO1 knockdown on the activation of the TGF-β/Smad sign-aling pathway in AGS and MGC803 cells. Our results revealed that the expression levels of TGF-β, phospho-rylated-Smad2 (p-Smad2) and phosphorylated-Smad3 (p-Smad3) were decreased with ENO1 knockdown, whereas the total Smad2 and Smad3 expression levels were not significantly different between the normal glu-cose and hyperglycemia groups (Fig. 5a, b). Collectively, these data implied that hyperglycemia/ENO1 induced GC malignant phenotype at least partially by modulat-ing the TGF-β/Smad signalmodulat-ing pathway.
Discussion
drugs under high glucose conditions [27]. Another study reported that hyperglycemia can enhance oxali-platin chemoresistance and lead to poor clinical out-comes in stage III colorectal cancer patients receiving adjuvant chemotherapy [28]. This study aimed to inves-tigate the effects of hyperglycemia on the GC malig-nant phenotype and the underlying mechanisms. The results demonstrated that high glucose could enhance
the malignant phenotype including increased GC cell proliferation, migration and invasion. Moreover, high glucose upregulated the expression of ENO1. Nota-bly, knockdown of ENO1 could significantly reverse the hyperglycemia-induced GC malignant phenotype. Mechanistically, further research revealed that Snail‐ mediated EMT played a vital role in the hyperglycemia/ ENO1‐induced GC malignant phenotype.
Hyperglycemia is essential for the initiation and pro-gression of carcinogenesis. High glucose provides suffi-cient energy and creates a favorable microenvironment for tumor cells. Many studies have shown that hypergly-cemia stimulates tumor cell glycolysis by regulating the expression levels of glycolytic enzymes. For example, a new study reported that hyperglycemia could enhance glycolysis by increasing LDHA activity and HK2, PFKP expression to promote pancreatic cancer progression [29]. Increased expression of LDHA was also detected in the colorectal epithelium of patients with DM, which suggested increased aerobic glycolysis [30]. ENO1, one of the key enzymes in the glycolytic process, catalyses
the formation of phosphoenolpyruvate from 2-phospho-glycerate [31]. In fact, ENO1 is a multifunctional protein. In addition to its catalytic function, ENO1 has non-gly-colytic functions, such as cell surface plasminogen bind-ing, maintenance of mitochondrial membrane stability, transcriptional repressor activity in the nucleus, as well as chaperon and vacuole fusion activity in the cyto-plasm [32]. Our results revealed that ENO1 was highly expressed and played an important role in GC develop-ment, which was consistent with previous studies [17,
for GC. We observed, possibly for the first time, that the expression of ENO1 was significantly higher in the hyper-glycemia groups than the normal glucose group. This finding indicated that a high-glucose environment can also enhance the glycolysis level of GC cells. ENOblock, a small molecule nonsubstrate analogue that inhibits ENO1, was shown to suppress colon cancer cell metas-tasis and induce cellular glucose uptake [36]. A recent study demonstrated that treatment with ENOblock could inhibit gluconeogenesis, adiposity and obesity-related inflammation [37]. Furthermore, it has been proved that ENOblock could reduce hyperglycemia and hyperlipi-demia and decrease secondary diabetic complications in a mammalian model of type 2 DM [38]. Therefore, tar-geted inhibition of ENO1 in patients with GC and DM may yield unexpected results. We believe that relevant clinical trials will be possible in the near future.
There is no doubt that EMT plays a vital role in tumor invasion and metastasis. During EMT, epithelial cells lose their apical-basal polarity, reorganize the cytoskel-eton, show increased cell motility and gain mesenchymal morphology [39]. Notably, high glucose concentrations modulate EMT-related protein expression and mor-phology to enhance cell migration and invasion in sev-eral cancers [40–42]. Interestingly, ENO1 has recently been found to modulate EMT progression [14, 16, 17]. Additionally, there was evidence that surface ENO1 was shown to exert its previously mentioned non-glycolytic effects to induce pericellular plasminogen activation, promote extracellular matrix degradation and increase invasion and metastasis of tumor cells [43]. TGF-β is a multifunctional cytokine that is involved in cancer pro-gression, including EMT, immune evasion, metastasis and chemotherapy resistance [44]. High glucose could also induce nuclear translocation of Smad3 and enhance the activation of TGF-β/Smad signaling pathway [45]. In our study, we found that hyperglycemia promoted GC cell proliferation, migration, invasion and EMT, as well as ENO1 expression. Data from online databases showed the expression of Snail was significantly positively cor-related with ENO1 expression. Furthermore, our results demonstrated that downregulation of ENO1 could par-tially reverse the above effects of hyperglycemia. Further research confirmed that ENO1 knockdown significantly inhibited the TGF-β/Smad signaling pathway in both the normal glucose and hyperglycemia groups. All the results were consistent with our hypothesis that hyperglycemia-induced ENO1 overexpression promotes a malignant phenotype in GC via Snail-induced EMT through the TGF-β/Smad signaling pathway.
However, our study has some limitations that must be considered. First, GC cells cultured with different concentrations of glucose cannot represent the in vivo
system. Second, we did not investigate the effect of hyperglycemia on cellular glycolytic activity. Third, an animal model and further research on the relationship between ENO1 and Snail may also be needed.
Conclusion
In conclusion, our results indicate that overexpression of ENO1 is observed in GC and is associated with the clinicopathological features and prognosis of patients, suggesting that ENO1 might be a prognostic indicator in GC. High glucose levels can upregulate ENO1 expres-sion, which stimulates Snail-induced EMT through the TGF-β/Smad signaling pathway in GC. We strongly pro-pose perioperative glycemic control as a potential strat-egy for clinical management of GC.
Abbreviations
GC: gastric cancer; ENO1: enolase 1; EMT: epithelial–mesenchymal transition; GEO: Gene Expression Omnibus; TCGA : The Cancer Genome Atlas; TGF-β: transforming growth factor β; siRNA: small interfering RNA; IHC: immunohis-tochemical; DM: diabetes mellitus; qRT-PCR: RNA extraction and quantitative real-time PCR; OS: overall survival.
Acknowledgements Not applicable.
Authors’ contributions
XX and CBo designed the experiments; XX, CB, ZSP, CGD and HXB conducted experiments; XX, CB, CGD and HXB analyzed data; XX, CBo and ZJW wrote the manuscript. All authors read and approved the final manuscript.
Funding
This work was supported by grants from the National Natural Science Foundation of China (No. 81602425), the Natural Science Foundation of Anhui Province (No. 1508085QH152).
Availability of data and materials Not applicable.
Ethics approval and consent to participate
This study was approved by Biomedical Research Ethics Committee of Anhui Medical University, and written informed consent was obtained from each enrolled patient.
Consent for publication
Written consent was obtained from all participants.
Competing interests
The authors declare that they have no competing interests.
Received: 13 July 2019 Accepted: 14 December 2019
References
1. Bray F, Ferlay J, Soerjomataram I, Siegel RL, Torre LA, Jemal A. Global cancer statistics 2018: GLOBOCAN estimates of incidence and mor-tality worldwide for 36 cancers in 185 countries. CA Cancer J Clin. 2018;68(6):394–424.
2. Li F, Du H, Li S, Liu J. The association between metabolic syndrome and gastric cancer in Chinese. Front Oncol. 2018;8:326.
receptor inhibition downregulates Helicobacter pylori-induced epithelial inflammatory responses, DNA damage and gastric carcinogenesis. Gut. 2018;67(7):1247–60.
4. Chen YY, Fang WH, Wang CC, Kao TW, Chang YW, Wu CJ, Zhou YC, Sun YS, Chen WL. Helicobacter pylori infection increases risk of incident metabolic syndrome and diabetes: a cohort study. PLoS ONE. 2019;14(2):e0208913. 5. Jeon CY, Haan MN, Cheng C, Clayton ER, Mayeda ER, Miller JW, Aiello AE.
Helicobacter pylori infection is associated with an increased rate of diabetes. Diabetes Care. 2012;35(3):520–5.
6. Ikeda F, Doi Y, Yonemoto K, Ninomiya T, Kubo M, Shikata K, Hata J, Tanizaki Y, Matsumoto T, Iida M, et al. Hyperglycemia increases risk of gastric cancer posed by Helicobacter pylori infection: a population-based cohort study. Gastroenterology. 2009;136(4):1234–41.
7. Ma DH, Li BS, Liu JJ, Xiao YF, Yong X, Wang SM, Wu YY, Zhu HB, Wang DX, Yang SM. miR-93-5p/IFNAR1 axis promotes gastric cancer metas-tasis through activating the STAT3 signaling pathway. Cancer Lett. 2017;408:23–32.
8. Wang W, He Q, Yan W, Sun J, Chen Z, Liu Z, Lu Z, Hou J, Shao Y, Zhou X, et al. High glucose enhances the metastatic potential of tongue squamous cell carcinoma via the PKM2 pathway. Oncotarget. 2017;8(67):111770–9. 9. Li W, Liu H, Qian W, Cheng L, Yan B, Han L, Xu Q, Ma Q, Ma J. Hyperglycemia
aggravates microenvironment hypoxia and promotes the metastatic ability of pancreatic cancer. Comput Struct Biotechnol J. 2018;16:479–87. 10. Dongre A, Weinberg RA. New insights into the mechanisms of
epithelial-mesenchymal transition and implications for cancer. Nat Rev Mol Cell Biol. 2019;20(2):69–84.
11. Hanahan D, Weinberg RA. Hallmarks of cancer: the next generation. Cell. 2011;144(5):646–74.
12. Warburg O. On the origin of cancer cells. Science. 1956;123(3191):309–14. 13. Liberti MV, Locasale JW. The Warburg effect: how does it benefit cancer
cells? Trends Biochem Sci. 2016;41(3):211–8.
14. Song Y, Luo Q, Long H, Hu Z, Que T, Zhang X, Li Z, Wang G, Yi L, Liu Z, et al. Alpha-enolase as a potential cancer prognostic marker promotes cell growth, migration, and invasion in glioma. Mol Cancer. 2014;13:65. 15. Zhu W, Li H, Yu Y, Chen J, Chen X, Ren F, Ren Z, Cui G. Enolase-1 serves as a
biomarker of diagnosis and prognosis in hepatocellular carcinoma patients. Cancer Manag Res. 2018;10:5735–45.
16. Fu QF, Liu Y, Fan Y, Hua SN, Qu HY, Dong SW, Li RL, Zhao MY, Zhen Y, Yu XL, et al. Alpha-enolase promotes cell glycolysis, growth, migration, and invasion in non-small cell lung cancer through FAK-mediated PI3K/AKT pathway. J Hematol Oncol. 2015;8:22.
17. Sun L, Lu T, Tian K, Zhou D, Yuan J, Wang X, Zhu Z, Wan D, Yao Y, Zhu X, et al. Alpha-enolase promotes gastric cancer cell proliferation and metastasis via regulating AKT signaling pathway. Eur J Pharmacol. 2019;845:8–15. 18. Cappello P, Principe M, Bulfamante S, Novelli F. Alpha-Enolase (ENO1), a
potential target in novel immunotherapies. Front Biosci. 2017;22:944–59. 19. Peng J, Chen W, Chen J, Yuan Y, Zhang J, He Y. Overexpression of chloride
channel-3 predicts unfavorable prognosis and promotes cellular invasion in gastric cancer. Cancer Manag Res. 2018;10:1163–75.
20. Chen D, Cao G, Liu Q. A-kinase-interacting protein 1 facilitates growth and metastasis of gastric cancer cells via Slug-induced epithelial-mesenchymal transition. J Cell Mol Med. 2019;23(6):4434–42.
21. Kirakli EK, Yilmaz U, Yilmaz H, Komurcuoglu B. Fasting blood glucose level in locally advanced non-small cell lung cancer: a new prognostic factor? Horm Cancer. 2018;9(3):188–96.
22. Nik-Ahd F, Howard LE, Eisenberg AT, Aronson WJ, Terris MK, Cooperberg MR, Amling CL, Kane CJ, Freedland SJ. Poorly controlled diabetes increases the risk of metastases and castration-resistant prostate cancer in men undergo-ing radical prostatectomy: results from the SEARCH database. Cancer. 2019.
https ://doi.org/10.1002/cncr.32141 .
23. Zheng J, Xie SH, Santoni G, Lagergren J. Population-based cohort study of diabetes mellitus and mortality in gastric adenocarcinoma. Br J Surg. 2018;105(13):1799–806.
24. Fiorillo C, Rosa F, Quero G, Menghi R, Doglietto GB, Alfieri S. Postoperative hyperglycemia in nondiabetic patients after gastric surgery for cancer: perioperative outcomes. Gastric Cancer. 2017;20(3):536–42.
25. Lopez R, Arumugam A, Joseph R, Monga K, Boopalan T, Agullo P, Gutierrez C, Nandy S, Subramani R, de la Rosa JM, et al. Hyperglycemia enhances the proliferation of non-tumorigenic and malignant mammary epithelial cells through increased leptin/IGF1R signaling and activation of AKT/mTOR. PLoS ONE. 2013;8(11):e79708.
26. Duan Q, Li H, Gao C, Zhao H, Wu S, Wu H, Wang C, Shen Q, Yin T. High glucose promotes pancreatic cancer cells to escape from immune surveil-lance via AMPK-Bmi1-GATA2-MICA/B pathway. J Exp Clin Cancer Res. 2019;38(1):192.
27. Zhao W, Chen R, Zhao M, Li L, Fan L, Che XM. High glucose promotes gastric cancer chemoresistance in vivo and in vitro. Mol Med Rep. 2015;12(1):843–50.
28. Yang IP, Miao ZF, Huang CW, Tsai HL, Yeh YS, Su WC, Chang TK, Chang SF, Wang JY. High blood sugar levels but not diabetes mellitus significantly enhance oxaliplatin chemoresistance in patients with stage III colorectal cancer receiving adjuvant FOLFOX6 chemotherapy. Ther Adv Med Oncol. 2019;11:1758835919866964.
29. Cheng L, Qin T, Ma J, Duan W, Xu Q, Li X, Han L, Li W, Wang Z, Zhang D, et al. HIF-1alpha mediates hyperglycemia-induced pancreatic cancer glycolysis. Anticancer Agents Med Chem. 2019. https ://doi.org/10.2174/18715 20619 66619 06261 20359 .
30. Li JY, Yu T, Xia ZS, Chen GC, Yuan YH, Zhong W, Zhao LN, Chen QK. Enhanced proliferation in colorectal epithelium of patients with type 2 diabetes correlates with beta-catenin accumulation. J Diabetes Complicat. 2014;28(5):689–97.
31. Zheng F, Jang WC, Fung FK, Lo AC, Wong IY. Up-regulation of ENO1 by HIF-1alpha in retinal pigment epithelial cells after hypoxic chal-lenge is not involved in the regulation of VEGF secretion. PLoS ONE. 2016;11(2):e0147961.
32. Didiasova M, Schaefer L, Wygrecka M. When place matters: shuttling of enolase-1 across cellular compartments. Front Cell Dev Biol. 2019;7:61. 33. Qiao H, Wang Y, Zhu B, Jiang L, Yuan W, Zhou Y, Guan Q. Enolase1
overex-pression regulates the growth of gastric cancer cells and predicts poor survival. J Cell Biochem. 2019;9:262.
34. Qiao H, Wang YF, Yuan WZ, Zhu BD, Jiang L, Guan QL. Silencing of ENO1 by shRNA inhibits the proliferation of gastric cancer cells. Technol Cancer Res Treat. 2018;17:1533033818784411.
35. Chen S, Duan G, Zhang R, Fan Q. Helicobacter pylori cytotoxin-associated gene A protein upregulates alpha-enolase expression via Src/MEK/ ERK pathway: implication for progression of gastric cancer. Int J Oncol. 2014;45(2):764–70.
36. Jung DW, Kim WH, Park SH, Lee J, Kim J, Su D, Ha HH, Chang YT, Williams DR. A unique small molecule inhibitor of enolase clarifies its role in fundamental biological processes. ACS Chem Biol. 2013;8(6):1271–82.
37. Cho H, Lee JH, Um J, Kim S, Kim Y, Kim WH, Kim YS, Pagire HS, Ahn JH, Ahn Y, et al. ENOblock inhibits the pathology of diet-induced obesity. Sci Rep. 2019;9(1):493.
38. Cho H, Um J, Lee JH, Kim WH, Kang WS, Kim SH, Ha HH, Kim YC, Ahn YK, Jung DW, et al. ENOblock, a unique small molecule inhibitor of the non-glycolytic functions of enolase, alleviates the symptoms of type 2 diabetes. Sci Rep. 2017;7:44186.
39. Aiello NM, Kang Y. Context-dependent EMT programs in cancer metastasis. J Exp Med. 2019;216(5):1016–26.
40. Chen YC, Ou MC, Fang CW, Lee TH, Tzeng SL. High glucose concentrations negatively regulate the IGF1R/Src/ERK axis through the microRNA-9 in colorectal cancer. Cells. 2019;8(4):326.
41. Li W, Zhang L, Chen X, Jiang Z, Zong L, Ma Q. Hyperglycemia promotes the epithelial-mesenchymal transition of pancreatic cancer via hydrogen peroxide. Oxid Med Cell Longev. 2016;2016:5190314.
42. Zielinska HA, Holly JMP, Bahl A, Perks CM. Inhibition of FASN and ERalpha signalling during hyperglycaemia-induced matrix-specific EMT promotes breast cancer cell invasion via a caveolin-1-dependent mechanism. Cancer Lett. 2018;419:187–202.
43. Hsiao KC, Shih NY, Fang HL, Huang TS, Kuo CC, Chu PY, Hung YM, Chou SW, Yang YY, Chang GC, et al. Surface alpha-enolase promotes extracellular matrix degradation and tumor metastasis and represents a new therapeutic target. PLoS ONE. 2013;8(7):e69354.
44. Hao Y, Baker D, Ten Dijke P. TGF-beta-mediated epithelial-mesenchymal transition and cancer metastasis. Int J Mol Sci. 2019;20(11):2767.
45. Wu L, Derynck R. Essential role of TGF-beta signaling in glucose-induced cell hypertrophy. Dev Cell. 2009;17(1):35–48.
Publisher’s Note