208 September, 2015 Agric Eng Int: CIGR Journal Open access at http://www.cigrjournal.org Vol. 17, No. 3
Characterisation of small scale feed mills in a developing country
Adetifa B.O.
1*, Okewole O.T.
2(1. Department of Agricultural and Mechanical Engineering, College of Engineering and Environmental Studies, Olabisi Onabanjo University, P. M. B. 5026, Ibogun, Ogun State, Nigeria;
2. Process Concepts and Technologies (Procontec) Limited, Trumed Building, SW9/1427, New Adeoyo State Hospital Road, Off Ring Road, G.P.O. Box 17383, Ibadan, Oyo State.Nigeria.)
Abstract: In most developing countries, there are numerous small scale animal farms which are sustained by the existence of small scale feed mills. The growth of these small scale feed mills is affected by some problems. A study to characterise small scale feed mills was conducted using Ibadan, Oyo State, Nigeria as a case study. 10 feed mills were randomly selected and investigated while 30 workers were assessed. The characteristics of the feed mills were investigated in terms of capacity, number of workers, unit operations, equipment used, power source, energy utilization pattern and workplace safety/hygiene. It was discovered that the average capacity of the small scale feed mills was 2.87 t/d with an average of six workers. The workers were predominantly men between 15 and 26 yr. The maximum manual, liquid fuel and electrical energy available to the small scale feed mills were 92.64 MJ/d, 1092 MJ/d and 435.24 MJ/d respectively. It was also discovered that 162 kJ of energy was used to produce 1kg of animal feed whose energy content was above 17 MJ. Other characteristics identified include; high cost of power, high rodent infestation, dirty and dusty mill environs, etc. This study exposes some problems of small scale feed milling requiring qualitative study.
Keywords: Livestock feed, capacity, energy content, energy use, unit operations
Citation: Adetifa B. O., Okewole O. T. 2015. Characterisation of small scale feed mills in a developing country. Agric Eng Int: CIGR Journal, 17(3): 208-216.
1 Introduction
1The manufacturing of livestock feed involves the
transformation and combination of different raw
materials with diverse physical, chemical and nutritional
composition into a homogenous and standardized
mixture required for stimulating an anticipated
nutritional response in the animal fed. Figure 1 depicts
the general systems associated with a typical feed mill.
Raw materials, such as whole grains and soft stocks (i.e.,
minerals, salt, and other bulk non-grain materials) are
metered, grinded, conveyed and then mixed. This mixed
feed can be pelleted or packaged and delivered in bag
form.
Received date: 2014-09-01 Accepted date: 2015-06-06
*Corresponding author: Adetifa B. O., Department of Agricultural and Mechanical Engineering, College of Engineering and Environmental Studies, Olabisi Onabanjo University, 112104, Ibogun, Ogun State, Nigeria.
Email: [email protected]
Milling scale can be determined by the quantity of
output, size of plant, the number of plants installed and
the technique of production adopted by the producer.
According to Wesley (2005) milling scale can be
classified into:
1. Large and very large: These are mills with capacity
over 4 t/h
2. Medium: Their capacity is between 1-4 t/h
3. Small: They operate between 100 kg to 1 t/h for
village level processing or as a small commercial mills
operating at 100 to 500 kg/h.
Several attempts have also been made to define and
characterize a small scale industry. Ogechukwu (2011)
and Ogunkoya and Aderoba (2010) identified small scale
industries to have: a small number of workers; low
annual business turnover; local areas of operations;
minimal sales volume; relatively minimal financial
strength; relatively small market; many in number than
is associated with low capital output and capital labour
ratios. Four levels of small scale feed milling were
identified by the National Research Institute (1988) as
follows:
i. 500 kg/d Shovel mixing
ii. 200 kg/h Cement mixer
iii. One t/ h Farm-scale mill and mix plant
iv. 2.5 t/h Small industrial-scale feed plant
The operations of these mills do not completely
follow that of the large scale mills in terms of the
equipment and process flow. The basic processes of
these mills are grinding and mixing. These adjustments
are basically due to low output; limited resources;
relatively small target market; etc.
Glatz (2012) observed that the lack of regional
small-scale feed manufacturing plants and high cost of
imported feed are holding back the development of the
small scale poultry sector in some Pacific Countries.
According to Bourn et al. (1994), 85% of all the farm
animal species in Nigeria were traditionally/locally
managed. This high percentage of traditionally managed
livestock is also responsible for the large number of
small scale feed mills available and vice versa. Tewe and
Mpoko (2001) reported that despite the 345% increase in
the number of feed mills in Nigeria over an eight year
period, there was 136% reduction in the efficiency of
these mills.
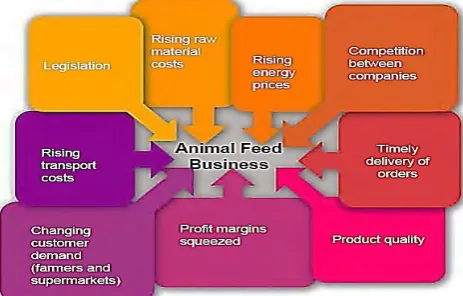
According to Carbon Trust (2010), some key factors
affect feed mills. Figure 2 illustrates some of these
important key factors in this sector.
Figure 2 Key factors influencing the animal feed sector (Source: Carbon Trust, 2010)
210 September, 2015 Agric Eng Int: CIGR Journal Open access at http://www.cigrjournal.org Vol. 17, No. 3
Other factors include, the low quality of feed
ingredients and poor technical expertise (Oladoja and
Olusanya, 2009); high risk of accident – explosion, fire,
structural failure; power failure, etc. (Van Fleet et al.,
2013) and health problems (Mijinyawa et al., 2012). In
other small scale mills, some of the inherent problems
have been identified such as; health problems of mill
operators (Omokhodion and Kolude, 2005); financial
problems of small scale palm oil production
(Adjei-Nsiah et al., 2012), etc.
This study is aimed at characterising small scale feed
mills in a typical developing country thereby exposing
their problems so as to compel and make room for
further qualitative investigation and mitigation measures.
2 Methodology
2.1 Research design and characteristics of population
A survey design was adopted for this study in which
10 feed mills and 30 feed mill workers were randomly
selected. The characteristics of each sample (individual
feed mill) in the population investigated were; mill
capacity, number of workers, mill operations and
equipment used. Correlation between the feed mill
capacity and the number of workers for the population
was determined at 5% level of significance.
2.2 Method of data collection and analysis
In identifying and defining other characteristics, four
major areas were investigated, which are:
A. Power source: The source of power for the
milling operation was investigated to determine the
power consumption and the cost.
B. Unit operations and equipment: The
prevailing unit operations were investigated and studied
to determine the miller’s perception about the
performance of each of the operation and their respective
equipment.
C. Energy utilization: In estimating the energy
available and consumed, the following empirical
formulas reported by Abubakar and Umar (2006) were
used:
1.
Evaluation of Manual Energy Input: Manual energyinput was estimated from Equation 1 and Equation 2;
EMm = 0.75 Ta (1)
EMF = 0.68 Ta. (2)
Where: EMm is the male manual energy input (MJ) and
0.75 is the Energy input of an average adult male (MJ/h)
(Norman, 1978). Ta represents the useful time spent by a
male worker (h).
EMF is the female manual energy input (MJ) and 0.68 is
the Energy input of an average adult female (MJ/h). Ta
represents the useful time spent by a female worker (h).
2.
Liquid Fuel Energy: Liquid fuel energy wasestimated using Equation 3 and Equation 4 below
EFLD = 36.4D (3)
EFLP = 32P (4)
Where: EFLD represents the liquid fuel energy input for
diesel (MJ) and D is the amount of diesel consumed (L).
EFLP is the liquid fuel energy input for petrol (MJ) and P
is the amount of petrol consumed (L)
3.
Electrical Energy (EE): Data on electricityconsumption (kWh) was estimated from the past bills
collected over the year. These values were converted
into common energy unit (MJ) by using appropriate
coefficient (one-kilowatt-hour of electricity = 3.6 MJ) i.e.
Equation 5
EE = 3.6 × kWh (5)
4.
Total Energy: Assuming negligible maintenanceenergy, the total energy was estimated from Equation 6
ET = EM + EFL + EE (6)
Where: EM is the total manual energy (MJ); EFL is the
total fuel energy (MJ); EE is the total electrical energy
(MJ).
5. Energy Use Ratio (EU): Energy use ratio required in
the production of grower’s mash and layer’s mash were
estimated from Equation 7 below:
EU=EEFP
T (7)
Where: EFP is the total energy content of finished
product (MJ) and ET is the total energy input for
operation (MJ).
EFP was estimated from Equation 8 below:
EFP = MFP × ECP (8)
Where: MFP is the mass of finished product (kg) and ECP
is the energy content (Gross Energy) of a unit mass of
product (MJ/kg).
The values of ECP used are shown in Table 1.
D. Workplace safety and hygiene: The type of
waste generated and their sources were investigated. A
questionnaire was designed to elicit the discomfort
experienced by the workers as a result of the dust
generated during milling.
3 Results and discussion
3.1 Feed mill capacity
The average capacity of a small scale feed mill was
found to be 2.87 t/d which according to the National
Research Institute (1988) and Wesley (2005) can be
classified under small industrial-scale feed plants. The
capacity ranged from as low as 200 kg to a maximum of
10 t per day. About 55.6% of the feed mills investigated
have capacities less than 1.5 t/d.
3.2 Feed mill workers
It was discovered that the feed mills have a maximum
of ten male and six female workers with an average of
six workers. Although 68% of these workers are male, it
was discovered that those working at the production
floor were predominantly men whose ages were between
25 and 40 years (60%) or between 15 and 25 years (40%)
with an average work experience of one year. A worker
in a feed mill works for straight 9 h (8:00am-5:00pm)
without break. The only rest period these workers have is
when production stops due to shortage in raw materials
or power outage. The average load carried during work
is usually above 20 kg.
Statistical analysis of the capacity and number of
workers revealed a correlation ratio of 0.53 lower than a
critical correlation ratio of 0.67 (at 5% level of
significance) implying that there was no correlation
between the number of workers and the feed mill
capacity.
3.3 Power source Table1 Gross energy of some feed ingredients
Feed Ingredients Gross Energy G.E, (MJ/kg) Literature
Groundnut cake (GNC) 18.31 Udo and Umoren (2011)
SOYA 22.30 FAO (1987)
Wheat Offal 16.56 Udo and Umoren (2011)
Rice Bran 18.33 Udo and Umoren (2011)
Bone Meal 17.60 FAO (1987)
Limestone 18.55 Haaland and Tyrrell (1982)
Palm kernel cake (PKC) 19.27 Amaefule et al. (2009)
Maize 17.00 FAO (1987)
Brewery dried grain (BDG) 19.34 Amaefule et al. (2009)
Blood Meal 21.84 Udo and Umoren (2011)
212 September, 2015 Agric Eng Int: CIGR Journal Open access at http://www.cigrjournal.org Vol. 17, No. 3
Two major sources were identified which are the
national grid supply and diesel engine electric power
generator. The maximum diesel consumption was 30 L/d
but on the average, about 12.3 L of diesel was used per
day which costs about N3000 (approximately $15). As
regards the grid supply, 71.4% of the millers considered
the billing system as too expensive. Around N40 000
(approximately $201) is being paid per month for a
maximum of 120.19 kWh of electricity consumed per
day.
3.4 Feed mill operations and equipment
Excluding material handling operations, the
following operations were identified to be the basic unit
operations in a small scale feed mill.
a) Weighing: Raw materials and finished
products (feeds) were weighed using weighing scales.
Table 2 shows that 28% of the respondents see this
operation as the most stressful.
b) Grinding: Grinding/milling of raw materials was
done using home-made hammer mills (Figure 3)
with beaters and screens of different sizes. This is
considered as the most crucial and problematic
operation because most of the respondents believed
that it consumes most resources (especially energy),
takes time and generates more waste. This is shown
in Table 2.
Figure 3 Grinding operation using a hammer mill
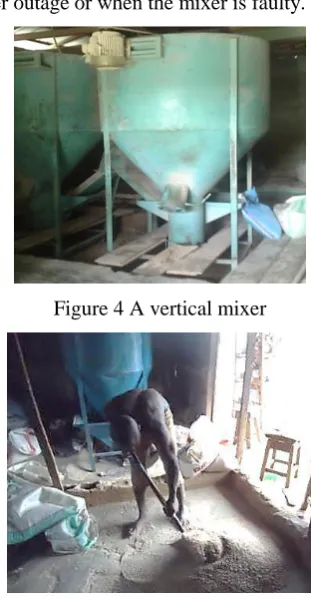
c) Mixing: Products are blended together in a vertical
mixer (Figure 4). In most cases, the output from the
hammer mill is conveyed manually to the mixer.
This is why 43% of the respondents believe that it is
the most stressful operation as shown in Table 2.
Some of the feed mills make use of shovel mixing
(i.e. manually mixing feed ingredient on the floor
with a shovel as shown in Figure 5) when there is
power outage or when the mixer is faulty.
Figure 4 A vertical mixer
Figure 5 Shovel mixing
d) Discharging/packaging: The discharge and
packaging of the feed was done directly under the
mixer (Figure 6). There was no separate facility for
discharging and packaging.
Table 2 Complaints of small scale feed millers
Complaints of Feed Millers Percentage
Weighing Grinding Mixing/discharge
Most stressful operation 28 29 43
Most demanding (resources) operation 10 80 10
Timing 10 60 30
Figure 6 Discharging/packaging operation
3.5 Energy utilization
1. Manual energy (EM): A maximum of ten male and
six female workers who spend 8 h at work were found in
the feed mills. This follows that from Equation 1 and
Equation 2, the manual energy available for male and
female workers are 60 MJ and 32.64 MJ respectively. This
implies that the total manual energy available is;
EM= ∑ EMm+ ∑ EMf= 60 + 32.64 = 92.64 MJ
2. Liquid fuel energy (EFLD): The maximum amount
of diesel consumed the feed mills was 30 L/d while petrol
was not used; hence, from Equation 3, EFLD= 1092 MJ
3. Electrical energy (EE): For a given day, the
maximum electric power consumed by a small scale feed
mill was estimated as 120.19kWh; hence from Equation 5,
EE= 3.6 × 120.19 = 435.24 MJ
Based on all these, the total amount of energy available in
a small scale feed mill for the population under study is; ET= 92.64 + 1092 + 435.24 = 1619.88 MJ/d
This maximum energy was used in producing a maximum
of 10 t of feed per day; hence, the total energy used in producing 100 kg of feed is approximately 16.20 MJ.
Figure 7 shows clearly the energy sources in small scale
feed mills in Ibadan.
Figure 7 Energy consumption in small scale feed mills
The gross energy content of layer’s and grower’s mash
are shown in Table 3 and Table 4 respectively while their
energy use ratio is as shown in Table 5. The energy
utilization of small scale feed mills is such that 162 kJ of
energy is used in producing 1 kg of animal feed with
energy content above 17 MJ.
Table 3 Gross energy content of layer’s mash Materials
(Layers mash)
MFP
(kg)
ECP
(MJ/Kg)
EFP = MFP x ECP (MJ)
GNC 5 18.31 91.55
SOYA 10 22.30 223.0
Wheat Offal 20 16.56 331.20
Rice Bran 10 18.33 183.30
Bone Meal 3 17.60 52.80
Limestone 2 18.55 37.10
Maize 50 17.00 850.00
1768.95
Table 4 Gross energy content of grower’s mash Materials
(Growers mash)
MFP
(kg)
ECP
(MJ/kg)
EFP = MFP x ECP
(MJ)
GNC 5 18.31 91.55
SOYA 5 22.30 111.50
PKC 30 19.27 578.10
Rice Bran 10 18.33 183.30
Bone Meal 3 17.60 52.80
Limestone 2 18.55 37.10
Maize 50 17.00 850.00
1904.35
Table 5 Energy use ratio of finished feeds Layer’s mash
Grower’s mash
Total energy input (ET), MJ 16.20 16.20
Total energy content of finished product (EFP), MJ.
1768.95 1904.35 Energy Use Ratio (EU) = EFP / ET 109.91 117.55
3.6 Workplace safety and hygiene
Dust is produced often by the grinding operation.
Around 80% of the workers have suffered from some
Electricity 27%
Fuel 67% Manual
214 September, 2015 Agric Eng Int: CIGR Journal Open access at http://www.cigrjournal.org Vol. 17, No. 3
minor respiratory problems within the first few weeks of
starting the job. Despite this large number, only about
13.33% make use of a form of protection from dust. In
an attempt to reduce the dust, some of the feed mills
visited ensured proper ventilation while 3.33% of these
feed mills have a dust extractor.
The kind of waste generated from the feed mills
include; metal scrap (e.g. worn-out beaters, screens and
machine parts), spoilt raw materials, sacks, feed waste,
etc. From Table 2, the grinding operation was identified
to generate most waste. During the grinding operation,
raw materials escape from the hopper of the hammer
mill as a result of the impact of the rotating beaters. Also,
some of the equipment are old and have leakages where
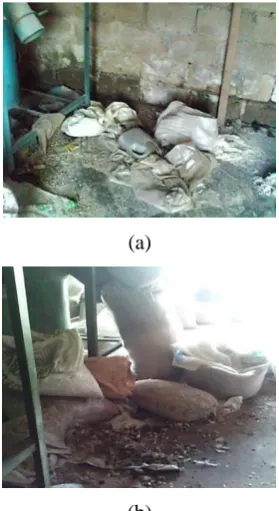
materials escape from during the operation. Poor
housekeeping was observed in the feed mills visited. It
was discovered that the environment was dirty as shown
in the Figure 8a and Figure 8b.
(a)
(b)
Figure 8 Poor house-keeping of feed mill environs
All the feed mills visited complained of high
infestation from rodents and/or insects. Despite the fact
that this is inevitable in a feed mill, the high infestation
was a clear indication of poor housekeeping. To reduce
this level of rodent infestation, some of the feed mills
visited reared cats as a means of biological control
(Figure 9). This method can create a problem of
contamination of feeds and raw materials by the cats
(Brian, 2010) and increased risk of cat scratch disease
and other zoonotic bartonella infections (Chomel et al.,
2004) by the workers and even customers.
Figure 9 Cats reared in a feed mill to control rodents
From the survey carried out, 70% of the workers
complained of discomfort after work. This discomfort
could lead to musculoskeletal disorders necessitating the
need for assessing the risk of musculoskeletal disorder.
3.7 Solution to problems
In order to curb the problems, the following
interventions are recommended;
1. Engineering intervention: In order to reduce or
totally eradicate some of the problems in these small scale
feed mills, agricultural engineers are required to;
a. Design a mill layout for proper operation
b. Design good and affordable equipment to reduce the
level of the dependence on manual labour
c. Correct the problems associated with the locally
made hammer mills
d. Ensure an ergonomically safe design and system
2. Administrative intervention: Some of the problems
identified can be resolved by proper mill management and
administration. Some of which are;
a. Good house keeping
b. Provision of PPE for workers
c. Good energy use
d. Providing necessary tools, equipment and machines
4 Conclusion
A preliminary investigation was carried out to
characterise the small scale feed mills in a developing
country. During the investigation, some imminent
technical problems were discovered. The method of
operation of these mills puts the environment and the
workers who are predominantly young men in serious
danger. The grinding operation was identified as the
most critical operation in feed milling and it is
responsible for the high energy consumption, relatively
high amount of waste and dust generation. Based on the
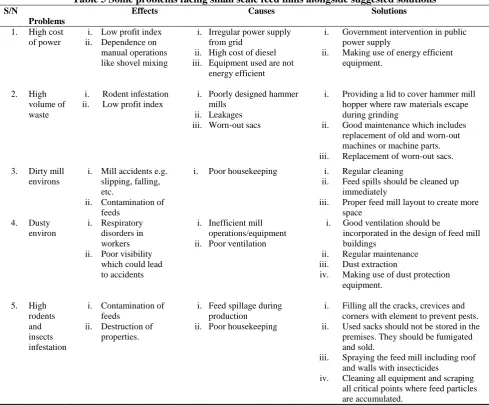
results gathered from the study, Table 5 shows the
problems identified in the small scale feed mills
alongside possible solutions. This paper reveals the
problematic areas in small scale feed milling requiring
further qualitative evaluation.
References
Abubakar, M., and B. Umar. 2006. Comparison of Energy Use Patterns in Maiduguri and Yobe Flour Mills, Nigeria.
CIGR Journal, 8: manuscript No. 671.
Adjei-Nsiah, S., A. K. S. Zu, and F. Nimoh. 2012. Technological and Financial Assessment of Small Scale Palm Oil Production in Kwaebibrem District, Ghana. Journal of Agricultural Science, 4(7):111-120.
Amaefule, K.U., O.C. Onwudike, S. N. Ibe, and S.F. Abasiekong. 2009. Nutrient Utilization and Digestibility of growing Pigs Fed Diets of Different Proportions of Palm Kernel and Brewers Dried Grain. Pakistan Journal of Nutrition, 8(4):361-367.
Bourn, D., W. Wint, R. Blench, and E. Woolley.1994. Nigerian livestock resources survey. World Animal Review, 78(1):49-58.
Table 5 Some problems facing small scale feed mills alongside suggested solutions S/N
Problems
Effects Causes Solutions
1. High cost of power
i. Low profit index ii. Dependence on
manual operations like shovel mixing
i. Irregular power supply from grid
ii. High cost of diesel iii. Equipment used are not
energy efficient
i. Government intervention in public power supply
ii. Making use of energy efficient equipment.
2. High volume of waste
i. Rodent infestation ii. Low profit index
i. Poorly designed hammer mills
ii. Leakages iii. Worn-out sacs
i. Providing a lid to cover hammer mill hopper where raw materials escape during grinding
ii. Good maintenance which includes replacement of old and worn-out machines or machine parts. iii. Replacement of worn-out sacs. 3. Dirty mill
environs
i. Mill accidents e.g. slipping, falling, etc.
ii. Contamination of feeds
i. Poor housekeeping i. Regular cleaning
ii. Feed spills should be cleaned up immediately
iii. Proper feed mill layout to create more space
4. Dusty environ
i. Respiratory disorders in workers ii. Poor visibility
which could lead to accidents
i. Inefficient mill operations/equipment ii. Poor ventilation
i. Good ventilation should be
incorporated in the design of feed mill buildings
ii. Regular maintenance iii. Dust extraction
iv. Making use of dust protection equipment.
5. High rodents and insects infestation
i. Contamination of feeds
ii. Destruction of properties.
i. Feed spillage during production
ii. Poor housekeeping
i. Filling all the cracks, crevices and corners with element to prevent pests. ii. Used sacks should not be stored in the premises. They should be fumigated and sold.
iii. Spraying the feed mill including roof and walls with insecticides
216 September, 2015 Agric Eng Int: CIGR Journal Open access at http://www.cigrjournal.org Vol. 17, No. 3
Lang, B. 2010. Rodent Control in Livestock and Poultry Facilities. Ontario Ministry of Agriculture and Food Factsheet.
Available at
www.omafra.gov.on.ca/english/livestock/dairy/facts/10-07 7.htm. Accessed 4 April 2014.
Carbon Trust. 2010. Industrial Energy Efficiency Accelerator – Guide to the Animal Feeding Sector. Available at www.carbontrust.com/media/206460/ctgo18-animal-feed-milling-industrial-energy-efficiency.pdf. Accessed 28 May 2013.
Chomel, B.B., H.J. Boulouis, and E.B. Breitschwerdt. 2004. Cat Scratch Disease and Other Zoonotic Bartonella Infections.
Journal of the American Veterinary Medicine Association, 224(8):1270-1279
FAO. 1987. The nutrition and feeding of farmed fish and shrimp; a training manual. 1: The Essential Nutrients. Available at http:/www.fao.org/docrep/field/003/AB470E/AB470E00.h tm. Accessed 18 December 2013.
Glatz, P.C. 2012. Sustainable Small-Scale Poultry Production: Are Local Feeds a Viable Option for the Pacific Region, Knowledge for development. Available at http://knowledge.cta.int/en/Dossiers/CTA-and-S-T/Selecte d-publications/Sustainable-Small-Scale-Poultry-Productio n-Are-Local-Feeds-a-Viable-Option-for-the-Pacific-Regio n. Accessed 28 May 2013.
Haaland, G.L., and H.F. Tyrrell. 1982. Effects of Limestone and Sodium Bicarbonate Buffers on Rumen Measurements and Rate of Passage in Cattle. Journal of Animal Science: 55(4): 935-942.
Mijinyawa, Y., C.R. Ogbue, and O.E. Arosoye. 2012. Assessment of Noise Levels Generated in Some Feed Mills in Ibadan, Nigeria. Research Journal in Engineering and Applied Sciences, 1(3): 156-159
National Research Institute (NRI). 1988. Small-scale Manufacture of Compound Animal Feed. Overseas Development Natural Resources Institute, Bulletin No. 9. Compiled by W. H. Parr with contributions by: B. S. Capper, D. R. S. Cox, K. Jewers, A. D. Marter, W. Nichols, D. R. Silvey, and J. F. Wood.
Norman, M.J.T. 1978. Energy Inputs and Outputs of Subsistence Cropping Systems in the Tropics. Agro-Ecosystems, 4(3):355 - 366.
Ogechukwu, A.D. 2011. The Role of Small Scale Industry in National Development in Nigeria. Universal Journal of Management and Social Sciences, 1(1): 3-41.
Ogunkoya, A.K., and A.A. Aderoba. 2010. A Model for Process Optimization of Small-Scale Industry for Competitive Production. The Pacific Journal of Science and Technology, 11(2): 366-375.
Oladoja, M.A., and T.P. Olusanya. 2009. Impact of Private Feed Formulation and Production as a Tool for Poverty Alleviation among Poultry Farmers in Ogun State, Nigeria.
International Journal of Poultry Science, 8(1): 1006-1010. Omokhodion, F.O., and O.O. Kolude. 2005. Health Problems of Mill Operators in a Tropical African Population. West African Journal of Medcine, 24(3): 256-258.
Tewe, O.O., and B. Mpoko. 2001. Post-Harvest Technologies in Nigeria’s Livestock Industry: Status, Challenges and Capacities. A Presentation at the GFAR – GIPhT Workshop, Entebbe Uganda. Available at http://www.foodnet.cgiar.org/Post%20Harvest/Papers/Te we's%20Final%20paper.htm.Accessed 28 May 2013. Udo, I.U., and U.E. Umoren. 2011. Nutritional Evaluation of some
Locally Available Ingredients used for Least-Cost Ration Formulation for African Cat Fish (Clarias garieprinus) in Nigeria. Asian Journal of Agricultural Resource, 5(3): 164-175.
Van Fleet, E. L., O. Frank, and J. Rosenbeck. 2013. A Guide to Safety and Health in Feed and Grain Mills, prepared for the North Carolina Department of Labour, Industrial
Guide 29. Available at
http://www.nclabor.com/osha/etta/indguide/ig29.pdf. Accessed 28 May 2013.
Wesley, A.S. 2005. Small and Medium Scale Milling and Fortification, Micronutrient Initiative, Ottawa, Canada.
Available at
http://www.micronutrient.org/CMFiles/Publib/SSF-backgr ound-paper-Annie1NRA-3242008-8511.pdf. Accessed 28 May 2013.
Nomenclature
EMm: Male manual energy input, MJ
EMF: Female manual energy input, MJ
EFLD: Liquid fuel energy input for diesel, MJ
EFLP: Liquid fuel energy input for petrol, MJ
EM: Total manual energy, MJ
EFL: Total fuel energy, MJ
EE: Total electrical energy, MJ
ET: Total energy input for operation, MJ
EFP: Total energy content of finished product, MJ
ECP: Energy content (gross energy) of a unit mass of product,
MJ/kg
MFP: Mass of finished product, kg