A Human Body Gait Recognition System Based on
Fourier Transform and Quartile Difference Extraction
https://doi.org/10.3991/ijoe.v13i07.7294
Xi-juan Wang
Shaanxi Institute of International Trade & Commerce, China [email protected]
Abstract—A research method of gait recognition based on feature combina-tion is proposed, which includes the wavelet transform (WT), Fourier transform (FT) and the quartile difference, to explore the gait recognition system in Inter-net of things human body sensor based on smart phone. It can extract the low-dimensional gait parameters of the acceleration signal, and these gait parame-ters can reflect the movement characteristics. Then, they are combined into feature vector to identify by a pattern recognition algorithm. Finally, the experimental verification is carried out in the experimental system. The results show that this gait recognition method simplifies the processing flow to a certain extent, and improves the recognition accuracy. In conclusion, the algo-rithm has a good effect, and can identify the gait behavior with high precision.
Keywords—Internet of things, body area network, sensor, gait recognition
1
Introduction
IOT (Internet of Things) has the ability of recognition, sensing and communica-tion, which is convenient for people's daily life, so it has been paid more and more attention and research [1]. While the BAN (Body Area Network) belongs to the Inter-net of things related to the human body, which is widely used in the field of remote diagnosis, medical care and special population monitoring and so has a very important significance and a huge demand [2-3]. It has become a hot spot of scientific research and practical application. Biometrics refers to the physiological and behavioral char-acteristics unique to each individual, and biometric recognition is the use of these features for motion recognition or identification, the gait recognition is the biometric recognition method being widely concerned in recent years [4]. A lot of experiments have been done on the combination of gait recognition and application of the body area network [5].
extract the low-dimensional gait parameters of the acceleration signal, but these gait parameters can reflect the movement characteristics. Then, they are combined into feature vector and identified by a pattern recognition algorithm. Finally, the experimental verification is carried out in the experimental system.
2
State of the Art
In this paper, we studied a set of experiments based on acceleration sensor body network test system. The system has the functions of data acquisition, data collection, data transmission and data processing [7]. The three-axis acceleration signal acquired by the sensor is the data source for the subsequent data analysis. Through the analysis and processing of the acceleration signal, the recognition of human gait and the fall detection are realized. The experimental verification system uses Shimmer sensor platform, Android smart phone and computer-side signal analysis and processing software components [8]. The Shimmer sensor is fixed in the middle position of the waist of the subject and used to acquire the three-axis acceleration signal of the sub-ject during the movement. Then, the data will be sent to the Bluetooth smart phone Android, and then transmitted via 3G / WiFi to the server / database, and save filter rules as file to subsequent data processing. In order to make the collected data can better reflect the movement of the human body, Shimmer was fixed in the middle of the waist of the subjects, and the sampling frequency was set to 50Hz [9]. Once the data has been analyzed and processed, the results are displayed on the front page. Therefore, the users can query the results of the analysis on the terminal device. The three-axis direction of the sensor is the x-axis, the y-axis, and the z-axis, respectively, in the vertical direction.
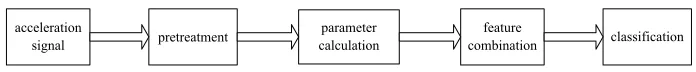
The data processing flow chart of this paper is shown in figure 1. Because the acceleration signal is high frequency fluctuation, it is difficult to use the original acceleration signal to identify the basic gait pattern, and thus need to find a relatively stable, able to characterize the gait characteristics of the characteristic parameters. Before extracting a feature, it is necessary to remove any interfering signals, such as noise, that may have an effect. After the signal preprocessing, we began to feature extraction. In this experiment, a small number of low-dimensional and easy-to-calculate parameters are selected from the acceleration signals, and these are combined into feature vectors. Finally, the feature vector is trained and classified by the decision tree algorithm and the Bayesian network algorithm in pattern recognition.
acceleration
signal pretreatment calculationparameter combinationfeature classification
3
Methods
3.1 Gait feature calculation
Frequency. Fourier Transform in signal processing, information communication and other fields have an important role. It is a linear integral transform, which can transform the time domain signal into frequency domain signal, in order to facilitate the researchers on the signal frequency domain analysis.
If the function f (t) satisfies the condition: it has a finite number of discontinuities; it has a finite number of extremum points; absolutely integrable. Then, the the formula (1) is workable. The F (w) is called the Fourier transform of the integral operation f (t).
( )
w
F
[ ]
f
( )
t
f
( )
t
e
dt
F
! -iwt!
-
"
=
=
(1) Formula (1) is a continuous Fourier transform formula, a lot of data is not continuous, but in a discrete way. Therefore, the discrete Fourier transform is required, and the formula (2) is the discrete Fourier transform.
( )
N( )
iN!knn
x
n
e
k
X
=
!
=-10 -2 (2)Among them, x (n) is a discrete sequence, and x (k) is called a discrete Fourier transform of x (n).
The acceleration signal in the vertical direction is subjected to Fast Fourier Transform (FFT). The frequency of the gait is the frequency corresponding to the maximum energy in the spectrum, which is used to characterize the speed of human gait behavior. Under normal circumstances, the normal frequency of walking between 1 ~ 3Hz.
Gait cycle. People walking is an alternating movement of the feet, and feet before the line is a regular alternating, which is a cyclical repetitive action. Thus the gait cycle refers to a periodic change in the gait signal (acceleration signal) obtained from the human body, which begins at one foot touching the ground and ending at the same foot again touching the ground.
In order to better understand the gait cycle, gait phase must be used to describe a complete gait cycle. Through different stages of gait mode analysis, it can more directly identify the individual joints of different functional significance of movement. In this paper, the normal gait cycle is divided into eight different phases: initial contact period, load-bearing reaction period, standing middle stage, standing stage, early stage, starting swing phase, moving mid-stage.
characteristics of this paper, and compared to the cycle detection is more simple. Therefore, this paper uses the discrete wavelet transform (DWT) of the acceleration signal. It makes the signal waveform becomes smooth and cyclical obvious, and thus extract the gait cycle.
Discrete wavelet transform referred to as DWT. The scale factor a and the translation factor b are discretized to obtain a set of discrete wavelet bases:
( )
(
- 0)
0 5 . 0 -0 n
m,
=
!
-!
t
a
ma
mt
nb
(3) Among them, a = a0m, b = ka0nb0, a0>l, b!0, m and n are integers.
By properly choosing the parameters such as ", a0, b0, a canonical orthonormal basis of "m,n(t) can be formed. Usually use a0 = 2, b0 = l constitute a discrete dyadic wavelet.
Quartile difference. QuartileDeviation are also known as Inter-QuartileRange. The four point difference between the 50% reflects the degree of discrete data, the greater the value, indicating the data more dispersed, the smaller the value, indicating the data more concentrated. Quartiles are not affected by extremes.
A set of data from (or from large to small) after sorting, with three points of all the data is divided into four equal parts, and the three point numerical position is called the four percentile, which were recorded as Q1 (the first four percentile), Q2 (the 24 percentile, namely median) Q3, (the three or four percentile). The distance difference between Q3 and Q1 is called the quartile difference.
x, z axis cross correlation coefficient. The cross-correlation function represents the degree of correlation between the values of the two time series at any two different moments, that is, the cross-correlation function is the degree of correlation between the values of the random signals x (t), y (t) at any two different times t1, t2.
Suppose that the length of the discrete signal x (n), y (n) is N, the cross-correlation coefficient of x (n), y (n) can be calculated from (4), where x (n), y (n) are not 0 at the same time.
( ) ( )
( )
( )
!
!
!
1
= =1
2 2 1 =
=
N n N n N nn
y
n
x
n
y
n
x
!
(4)3.2 Extraction of gait features
In this series of feature combinations, how to select the optimal combination of features? In this paper, the merge method is adopted. The merge method uses a bottom-up approach, which combines the features gradually, until the newly added features can no longer cause the improvement of the classification performance. The specific steps can be divided into the following steps:
1.The candidate feature set is X ={x1,...,xn}. Each feature in X is taken as training set. There are n training sets, namely{x1},...,{xn}. The n training sets are trained and tested one by one, and the best training set is selected as the feature vector Y. Suppose that the training set is {xk}, then Y={xk}. In this case, the candidate feature set is the set X ={x1,...,xk-1,xk+1,...,xn} with xk removed.
2.For candidate feature set X ={x1,...,xk-1,xk+1,...,xn}, each of these features is combined with the feature vector Y to form a training set. There are n-1 training sets, namely {{x1}Y},...,{{xk-1}Y},{{xk+1}Y},...,{{xn}Y}. The n-1 training set is trained and tested one by one, and the training set with the best result is chosen, which is assumed to be Z ={{xi}Y}.
3.The results of classification and recognition of the set Z and the feature vector K are compared. If the recognition result of the set Z is superior to the classification result of the feature vector y, Z is given to Y as the feature vector, that is, the feature vector is Y = Z.
4.If the classification result of feature vector Y is superior to the classification result of set Z, it is considered that the optimal solution is the optimal solution.
After comparing the results of previous experiments, we choose the feature set {fx,cyclex,peakx,iqrx,cyclez,peakz,iqrz,#,#w}. They represent the x-axis frequency (feature 1), x-axis period (feature 2), x-axis peak (feature 3), x-axis quartile difference (feature 4), the z-axis period (feature 5), the z-axis peak (feature 6), the z quartile difference (feature 7), the cross-correlation coefficient (feature 8) of the x-axis and the z-axis, and the cross-correlation coefficient after wavelet transformation (feature 9).
3.3 Gait feature alignment
This paper uses the decision tree classifier (C4.5) and the Bayesian network classifier (BayesNet) to carry on the polymerization experiment to these nine characteristic. Decision tree, also known as decision tree or multi-class classifier, is a tree structure used for classification and prediction, which is particularly convenient for solving multi-class or multi-peak distribution problems. C4.5 algorithm is one of the more classic algorithm. Bayesian network classifier is also a widely used classifier algorithm.
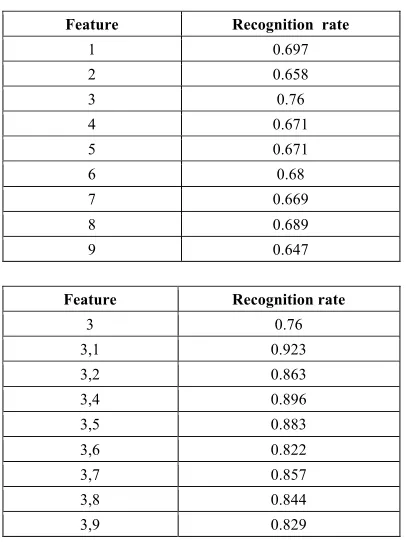
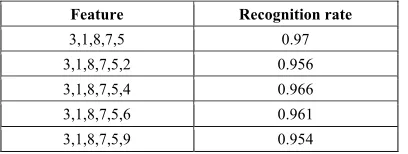
Table 1 (a) records the results of the first experiment, from which the recognition rate of feature 3 is the highest, so feature 3 is selected as the first feature of the feature vector.
Table 1 (b) records the results of the second experiment. It can be seen that the combination of feature 1 and feature 3 has the highest recognition rate, and then compared with the best results of the first experiment, that is, compared with the recognition rate of feature 3. As a result, the recognition rate of the combination of feature 1 and feature 3 is higher, so feature 1 is selected as the second feature of the feature vector.
Table 1 (c) records the results of the last experiment. It can be seen that the recognition rate of feature combinations 3, 1, 8, 7, 5, 4 is the highest, and then compared with the best results of the last experiment, that is, compared with the recognition rate of the feature combinations 3, 1, 8, 7, 5. As a result, the recognition rate of the feature combinations 3, 1, 8, 7, 5 is higher, and the polymerization is com-pleted. And the best feature combination is the best combination of the previous ex-perimental results, namely the feature combination 3, 1, 8, 7, 5.
The feature selection process of Bayesian network algorithm is also the same. Table 2 and Table 3 briefly describe the decision tree and Bayesian network algorithm selection process. Each combination listed in the table is a set of features with the highest overall correctness rate for each experiment.
Table 1. Feature selection process of decision tree algorithm Feature Recognition rate
1 0.697
2 0.658
3 0.76
4 0.671
5 0.671
6 0.68
7 0.669
8 0.689
9 0.647
Feature Recognition rate
3 0.76
3,1 0.923
3,2 0.863
3,4 0.896
3,5 0.883
3,6 0.822
3,7 0.857
3,8 0.844
Feature Recognition rate
3,1,8,7,5 0.97
3,1,8,7,5,2 0.956
3,1,8,7,5,4 0.966
3,1,8,7,5,6 0.961
3,1,8,7,5,9 0.954
Table 2. Feature selection process of decision tree algorithm
Feature 3 3,1 3,1,8 3,1,8,7 3,1, 8, 7, 5 3, 1,8, 7, 5,4
C4.5 0.76 0.932 0.964 0.966 0.97 0.966
Table 3. Feature selection process of Bayesian algorithm
Feature 3 3,1 3,1,8 3,1,8,6 3,1,8,6,2 3,1,8,6,2,9 3,1,8,6,2,9,7 3,1,8,6,2,9,7,5
BayesNet 0.717 0.893 0.924 0.936 0.942 0.944 0.951 0.949
Therefore, the characteristic parameters of the decision tree are chosen as 3, 1, 8, 7, 5, and BayesNet's characteristic parameter selection is 3, 1, 8, 6, 2, 9, 7.
Therefore, equation (5) and equation (6) are defined as the decision tree and BayesNet feature vector:
(
peakx
fx
!
iqrz
cyclez
)
fea
=
,
,
,
,
(5)(
peakx
fx
!
peakz
cyclex
!
w
iqrz
)
fea
=
,
,
,
,
,
(6)4
Results and Analysis
Table 4. BayesNet and C4.5 classification test results
Correct rate False rejection rate False acceptance rate Accuracy Accuracy BayesNet C4.5 BayesNet C4.5 BayesNet C4.5 BayesNet C4.5
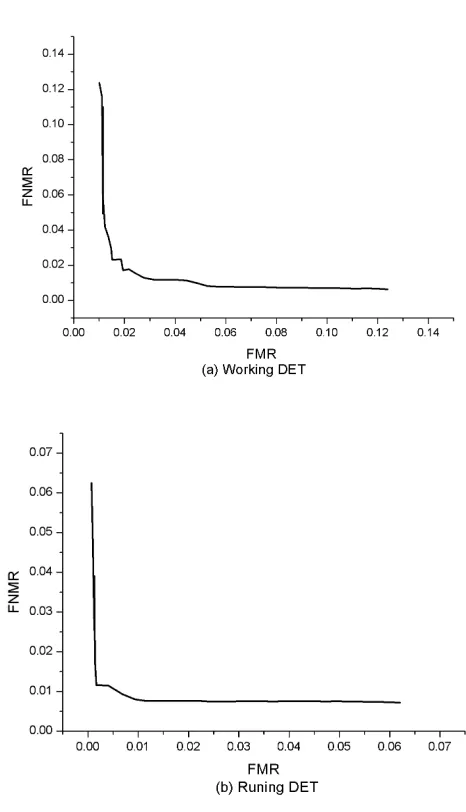
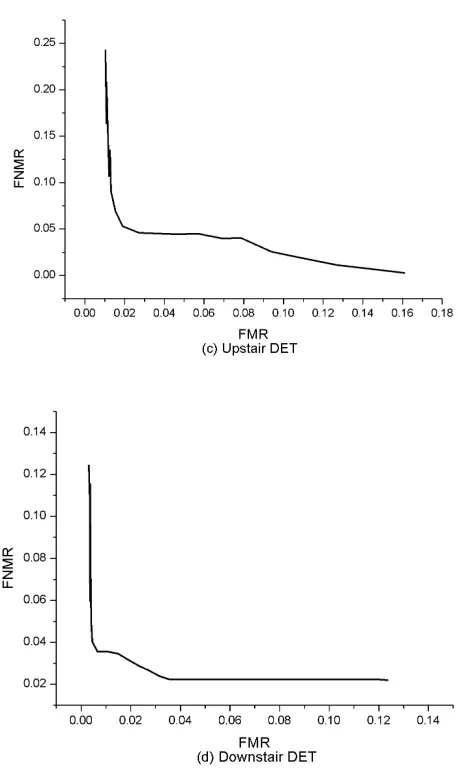
Fig. 2. DER curve
Table 4 shows the Bayesian network algorithm and decision tree algorithm classification test results. From the comparison of Table 4, the decision tree algorithm is better than the Bayesian network algorithm in the overall performance, the former is 97%, the latter is 95.1%, the former has higher recognition rate and better effect. In addition to a slight decline in running, the other three have a greater increase, especially upstairs has significantly improved, from 86.5% to 93.3%, the recognition rate increased by 6.8 percentage points.
correct type. The vertical axis represents the False Non-Match Rate (FNMR), that is, the correct type is mistaken for the wrong type. The intersection point represents the Equal Error Rate (EER). From the figure, we can see that the EER is about 2%, the running EER is about 1%, the EER is about 5%, and the EER is 2.8%. This shows that the best recognition is running, followed by the downstairs, walking and upstairs, and Table 3 results are very consistent. At the same time from Table 4 shows that in addition to the effect of slightly worse, the rest of the results are more satisfactory.
5
Conclusion
In the realization of the gait recognition algorithm, the relevant experimental veri-fication is carried out in this paper, and the experimental results show that the algo-rithm has a good effect, and can identify the gait behavior with high precision. How-ever, there are still some problems, so it still needs to be further improved. For exam-ple, only a single triaxial acceleration sensor is used in gait recognition, but in more complex scenarios, the acceleration sensor alone cannot achieve the overall monitor-ing, and other types of sensors need to be added in future work to make the scope of the detection more wide.
6
References
[1] Bulling A., Blanke U., Schiele B. (2014). A tutorial on human activity recognition using body-worn inertial sensors. ACM Computing Surveys (CSUR), 46(3): 33. https://doi.org/10.1145/2499621
[2] Muro-de-la-Herran A., Garcia-Zapirain B., Mendez-Zorrilla A. (2014). Gait analysis methods: An overview of wearable and non-wearable systems, highlighting clinical appli-cations. Sensors, 14(2): 3362-3394. https://doi.org/10.3390/s140203362
[3] Sprager S., Juric M. B. (2015). Inertial sensor-based gait recognition: a review. Sensors, 15(9): 22089-22127. https://doi.org/10.3390/s150922089
[4] Suh D. H, Song J. H. (2016). Establishing Crime Prevention Systems based on Internet of Things and Associated Spatial Urban Factors.
[5] Veenendaal A., Daly E., Jones E., et al. (2016). Sensor Tracked Points and HMM Based Classifier for Human Action Recognition. Computer Science and Emerging Research Journal, 5.
[6] Zhu N., Diethe T., Camplani M., et al. (2015). Bridging e-health and the internet of things: The sphere project. IEEE Intelligent Systems, 30(4): 39-46. https://doi.org/10.1109/MIS.2 015.57
[7] Lara, O. D., Pérez, A. J., Labrador, M. A., & Posada, J. D. (2012). Centinela: A human ac-tivity recognition system based on acceleration and vital sign data. Pervasive and mobile computing, 8(5): 717-729. https://doi.org/10.1016/j.pmcj.2011.06.004
[8] Sama, A., Angulo, C., Pardo, D., et al. (2011). Analyzing human gait and posture by com-bining feature selection and kernel methods. Neurocomputing, 74(16): 2665-2674. https://doi.org/10.1016/j.neucom.2011.03.028
7
Author
Xi-juan Wang is with the Shaanxi Institute of International Trade & Commerce, China ([email protected]).