ORIGINAL ARTICLE
Proposal and validation of a modified
staging system to improve the prognosis
predictive performance of the 8th AJCC/
UICC pTNM staging system for gastric
adenocarcinoma: a multicenter study
with external validation
Cheng Fang
1†, Wei Wang
1†, Jing‑Yu Deng
2†, Zhe Sun
3, Sharvesh Raj Seeruttun
1, Zhen‑Ning Wang
3,
Hui‑Mian Xu
3*, Han Liang
2*and Zhi‑Wei Zhou
1*Abstract
Background: The 8th edition of the American Joint Committee on Cancer/Union for International Cancer Control (AJCC/UICC) pathological tumor‑node‑metastasis (pTNM) staging system may have increased accuracy in predicting prognosis of gastric cancer due to its important modifications from previous editions. However, the homogeneity in prognosis within each subgroup classified according to the 8th edition may still exist. This study aimed to compare and analyze the prognosis prediction abilities of the 8th and 7th editions of AJCC/UICC pTNM staging system for gastric cancer and propose a modified pTNM staging system with external validation.
Methods: In total, clinical data of 7911 patients from three high‑capacity institutions in China and 10,208 cases from the Surveillance, Epidemiology, and End Results (SEER) Program Registry were analyzed. The homogeneity, discrimina‑ tory ability, and monotonicity of the gradient assessments of the 8th and 7th editions of AJCC/UICC pTNM staging system were compared using log‑rank χ2, linear‑trend χ2, likelihood‑ratio χ2 statistics and Akaike information criterion
(AIC) calculations, on which a modified pTNM classification with external validation using the SEER database was proposed.
Results: Considerable stage migration, mainly for stage III, between the 8th and 7th editions was observed in both cohorts. The survival rates of subgroups of patients within stage IIIA, IIIB, or IIIC classified according to both editions were significantly different, demonstrating poor homogeneity for patient stratification. A modified pTNM staging
© The Author(s) 2018. This article is distributed under the terms of the Creative Commons Attribution 4.0 International License (http://creativecommons.org/licenses/by/4.0/), which permits unrestricted use, distribution, and reproduction in any medium, provided you give appropriate credit to the original author(s) and the source, provide a link to the Creative Commons license, and indicate if changes were made. The Creative Commons Public Domain Dedication waiver (http://creativecommons.org/ publicdomain/zero/1.0/) applies to the data made available in this article, unless otherwise stated.
Open Access
*Correspondence: [email protected]; [email protected]; [email protected]
†Cheng Fang, Wei Wang and Jing‑Yu Deng contributed equally to this work
1 Department of Gastric Surgery, Sun Yat‑sen University Cancer Center, State Key Laboratory of Oncology in South China, Collaborative Innovation Center for Cancer Medicine, 651 Dongfeng Road East, Guangzhou, Guangdong 510060, P. R. China
2 Department of Gastric Cancer Surgery, Tianjin Medical University Cancer Institute & Hospital, Tianjin 300000, P. R. China
Background
Gastric cancer (GC) remains both the second most prevalent cancer [1] and the most frequent cause of can-cer-related death in China [2]. Nearly half of the global total new GC diagnoses each year occur in China [3, 4]. Although current practice includes chemotherapy, irradi-ation, and/or targeted therapy in the treatment protocol, surgical resection remains the only means for cure [5]. Regarding the prognostic markers for patients undergo-ing surgical treatment, the American Joint Committee on Cancer (AJCC)/International Union against Cancer (UICC) pathological tumor-node-metastasis (pTNM) staging system is currently used as the most important and basic tool for patient stratification. The AJCC/UICC has published the 8th edition of pTNM staging system for GC and has introduced some changes on the basis of the 7th edition [6, 7]. Among those changes, the most impor-tant one is the subdivision of the category N3ab into N3a and N3b, which affects consequent staging, especially for stage III. Thus, the prediction of survival probability of stage III patients are believed to be considerably affected, and this latest edition may have implications on treat-ment. To date, although the prognosis prediction ability of the 8th AJCC/UICC pTNM staging system for GC has already been addressed, its accuracy remains unclear.
In this retrospective study, we compared the prognosis prediction abilities of the 8th and 7th editions of AJCC/ UICC pTNM staging system using a large Chinese mul-ticenter database of GC as a training cohort. We then proposed a modified pTNM staging system for better prognosis prediction of advanced GC and performed external validation in a large cohort of Western GC patients.
Patients and methods Patients
Between January 1, 2000 and December 31, 2012, a con-secutive cohort of GC patients who underwent radical gastrectomy at the Department of Gastric Surgery at the Sun Yat-sen University Cancer Center (SYSUCC),
Department of Gastric Cancer Surgery at Tianjin Medi-cal University Cancer Institute & Hospital (TJMU), and Department of Surgical Oncology at the First Hospi-tal of China Medical University (CMU) were selected. The eligibility criteria were as follows: (1) pathologically confirmed primary gastric adenocarcinoma; (2) no syn-chronous malignancy; (3) no distant metastasis; (4) no preoperative chemotherapy; (5) patients having under-gone gastrectomy plus lymphadenectomy (limited or extended) according to the Japanese Gastric Cancer Treatment Guidelines 2014 (version 3) [8]; (6) R0 resec-tion (i.e., no residual macroscopic or microscopic tumor); (7) postoperative survival of at least 3 months; and (8) patients with no missing data regarding the analyzed clinicopathological characteristics.
From 18 registries of the Surveillance, Epidemiol-ogy, and End Results Program (SEER), a retrospective review of clinical records of all GC patients who under-went gastrectomy between January 1998 and December 2012 was performed. The patients were excluded if they had incomplete/missing information regarding their age, tumor size, tumor location, Lauren type, depth of inva-sion, lymph node status, non-radical resection, and/ or status of distant metastasis. This study protocol was approved by the institutional review boards of SYSU, TJMU, and CMU.
Follow‑up
A strict disease-monitoring program with outpatient records, telephonic interviews, and electronic messages was conducted and included clinical and laboratory examinations every 3 months for the first 2 years, every 6 months from the 3rd to the 5th years, and annually thereafter until at least 5 years after the operation or until the patient died, whichever came first. The last date of follow-up was December 31, 2016. The endpoint of this study was overall survival (OS), which was defined as the date from surgery until the date of death or the last date of follow up. Patients who were still alive after the com-pletion of follow-up were all censored.
system using data from the Chinese cohort was then formulated and demonstrated an improved homogeneity in these abovementioned subgroups. This staging system was further validated using data from the SEER cohort, and similar promising results were obtained. Compared with the 8th and 7th editions, the modified pTNM staging system displayed the highest log‑rank χ2, linear‑trend χ2, likelihood‑ratio χ2, and lowest AIC values, indicating its superior
discriminatory ability, monotonicity, homogeneity and prognosis prediction ability in both populations.
Conclusions: The 8th edition of AJCC/UICC pTNM staging system is superior to the 7th edition, but still results in homogeneity in prognosis prediction. Our modified pTNM staging system demonstrated the optimal stratification and prognosis prediction ability in two large cohorts of different gastric cancer populations.
Statistical analyses
All patients were restaged according to the 8th and 7th AJCC/UICC GC pTNM staging systems. Survival curves were plotted using the Kaplan–Meier method, and the log-rank test was used to determine the relationships between the investigated clinicopathological factors and OS. Factors deemed having potential significance (P < 0.05) on univariate analysis were included in mul-tivariate analyses. Mulmul-tivariate analysis of OS was per-formed using the Cox proportional hazards model with the forward logistic regression (LR) stepwise procedure for variable selection.
The prognosis prediction performance of the 8th and 7th AJCC/UICC GC staging systems was investigated in terms of discriminatory ability (differences in the sur-vival among patients in different stages), monotonicity (patients at earlier stages with longer survival than those in later stages), homogeneity (small differences in the survival among patients within the same stage) [9]. The log-rank χ2 test, linear-trend χ2 test, likelihood-ratio χ2 test, and Akaike information criterion (AIC) within the Cox regression model were used to compare the strati-fication and prognosis prediction performance between the two editions of staging systems. The discrimina-tory ability and monotonicity of gradient assessments were measured using the log-rank χ2 test and the lin-ear-trend χ2 test. Homogeneity was measured using the
likelihood-ratio χ2 test, and AIC was used to measure the prognostic stratifications. Higher log-rank χ2 and linear-trend χ2 scores indicated better discriminatory ability and monotonicity, higher likelihood-ratio χ2 scores indicated greater homogeneity, and smaller AIC values represented better prognostic stratification. Hazard ratios (HR) and 95% confidence intervals (95% CI) were also generated. All calculations were performed using SPSS 20.0 software (SPSS Inc., Chicago, IL, USA), and a P value < 0.05 was considered statistically significant.
Results
Patient clinicopathological features, univariate and multivariate analyses
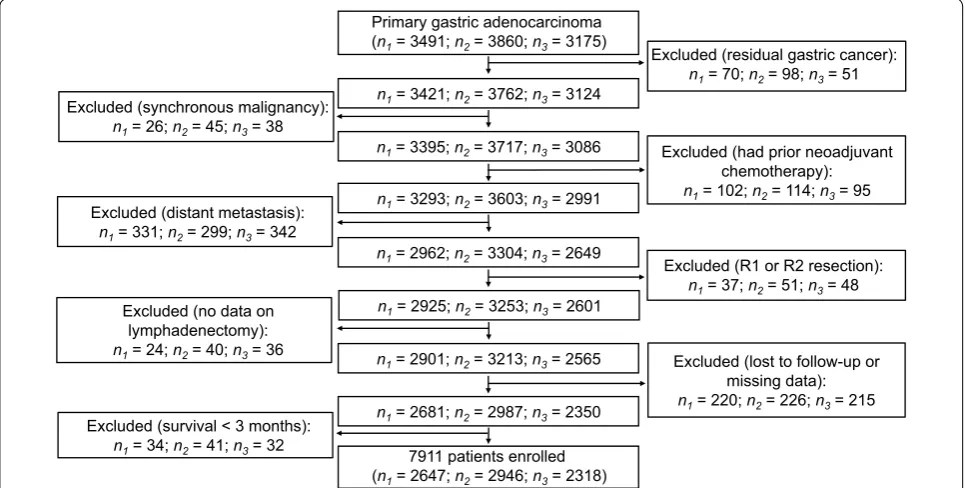
After screening of all the patients to be investigated, 7911 patients from the Chinese database were identi-fied as being eligible (median age, 59 years; age range, 15–89 years) and were defined as the training cohort (Fig. 1). Among 31,988 cases from 18 SEER registries, 10,208 were eligible (median age, 67 years; age range, 14–100 years) and were defined as the external vali-dation cohort. The median follow-up was 74 months (range, 1–182 months). The proportions of patients with ≤ 15 and > 15 retrieved lymph nodes (LNs) were 30.5% and 69.5%, respectively, in the training cohort and 53.2% and 46.8%, respectively, in the external vali-dation cohort. Table 1 illustrates the association of
Primary gastric adenocarcinoma (n1= 3491; n2= 3860; n3= 3175)
n1= 3395; n2= 3717; n3= 3086
n1= 3293; n2= 3603; n3= 2991
n1= 2962; n2= 3304; n3= 2649
n1= 2925; n2= 3253; n3= 2601
n1= 2681; n2= 2987; n3= 2350 n1= 2901; n2= 3213; n3= 2565
7911 patients enrolled (n1= 2647; n2= 2946; n3= 2318)
n1= 3421; n2= 3762; n3= 3124
Excluded (residual gastric cancer): n1= 70; n2= 98; n3= 51
Excluded (synchronous malignancy): n1= 26; n2= 45; n3= 38
Excluded (had prior neoadjuvant chemotherapy): n1= 102; n2= 114; n3= 95
Excluded (distant metastasis): n1= 331; n2= 299; n3= 342
Excluded (R1 or R2 resection): n1= 37; n2= 51; n3= 48 Excluded (no data on
lymphadenectomy):
n1= 24; n2= 40; n3= 36 Excluded (lost to follow-up or
missing data): n1= 220; n2= 226; n3= 215
Excluded (survival < 3 months): n1= 34; n2= 41; n3= 32
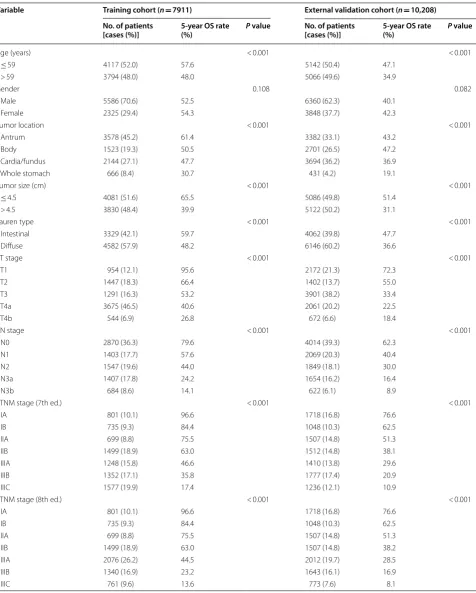
Table 1 Clinicopathologic variables and univariate analysis of the Chinese training cohort and SEER external validation cohort of gastric cancer patients
Variable Training cohort (n= 7911) External validation cohort (n= 10,208)
No. of patients
[cases (%)] 5‑year OS rate (%) P value No. of patients [cases (%)] 5‑year OS rate (%) P value
Age (years) < 0.001 < 0.001
≤ 59 4117 (52.0) 57.6 5142 (50.4) 47.1
> 59 3794 (48.0) 48.0 5066 (49.6) 34.9
Gender 0.108 0.082
Male 5586 (70.6) 52.5 6360 (62.3) 40.1
Female 2325 (29.4) 54.3 3848 (37.7) 42.3
Tumor location < 0.001 < 0.001
Antrum 3578 (45.2) 61.4 3382 (33.1) 43.2
Body 1523 (19.3) 50.5 2701 (26.5) 47.2
Cardia/fundus 2144 (27.1) 47.7 3694 (36.2) 36.9
Whole stomach 666 (8.4) 30.7 431 (4.2) 19.1
Tumor size (cm) < 0.001 < 0.001
≤ 4.5 4081 (51.6) 65.5 5086 (49.8) 51.4
> 4.5 3830 (48.4) 39.9 5122 (50.2) 31.1
Lauren type < 0.001 < 0.001
Intestinal 3329 (42.1) 59.7 4062 (39.8) 47.7
Diffuse 4582 (57.9) 48.2 6146 (60.2) 36.6
pT stage < 0.001 < 0.001
T1 954 (12.1) 95.6 2172 (21.3) 72.3
T2 1447 (18.3) 66.4 1402 (13.7) 55.0
T3 1291 (16.3) 53.2 3901 (38.2) 33.4
T4a 3675 (46.5) 40.6 2061 (20.2) 22.5
T4b 544 (6.9) 26.8 672 (6.6) 18.4
pN stage < 0.001 < 0.001
N0 2870 (36.3) 79.6 4014 (39.3) 62.3
N1 1403 (17.7) 57.6 2069 (20.3) 40.4
N2 1547 (19.6) 44.0 1849 (18.1) 30.0
N3a 1407 (17.8) 24.2 1654 (16.2) 16.4
N3b 684 (8.6) 14.1 622 (6.1) 8.9
pTNM stage (7th ed.) < 0.001 < 0.001
IA 801 (10.1) 96.6 1718 (16.8) 76.6
IB 735 (9.3) 84.4 1048 (10.3) 62.5
IIA 699 (8.8) 75.5 1507 (14.8) 51.3
IIB 1499 (18.9) 63.0 1512 (14.8) 38.1
IIIA 1248 (15.8) 46.6 1410 (13.8) 29.6
IIIB 1352 (17.1) 35.8 1777 (17.4) 20.9
IIIC 1577 (19.9) 17.4 1236 (12.1) 10.9
pTNM stage (8th ed.) < 0.001 < 0.001
IA 801 (10.1) 96.6 1718 (16.8) 76.6
IB 735 (9.3) 84.4 1048 (10.3) 62.5
IIA 699 (8.8) 75.5 1507 (14.8) 51.3
IIB 1499 (18.9) 63.0 1507 (14.8) 38.2
IIIA 2076 (26.2) 44.5 2012 (19.7) 28.5
IIIB 1340 (16.9) 23.2 1643 (16.1) 16.9
the investigated clinicopathological features with the 5-year OS rates of GC patients. The median tumor size was 4.5 cm (range, 0.1–35.0 cm), and the median number of LNs retrieved was 21 (range, 1–118) in the training cohort. For the external validation cohort, the median tumor size was 4.1 cm (range, 0.1–30.0 cm), and the median number of LNs retrieved was 15 (range, 1–90). In the univariate analyses of both cohorts, age, tumor location, tumor size, Lauren type, pT stage, pN stage, and pTNM stage classified according to the 7th and 8th editions of AJCC/UICC staging system were significantly associated with the 5-year OS rates (all P < 0.001).
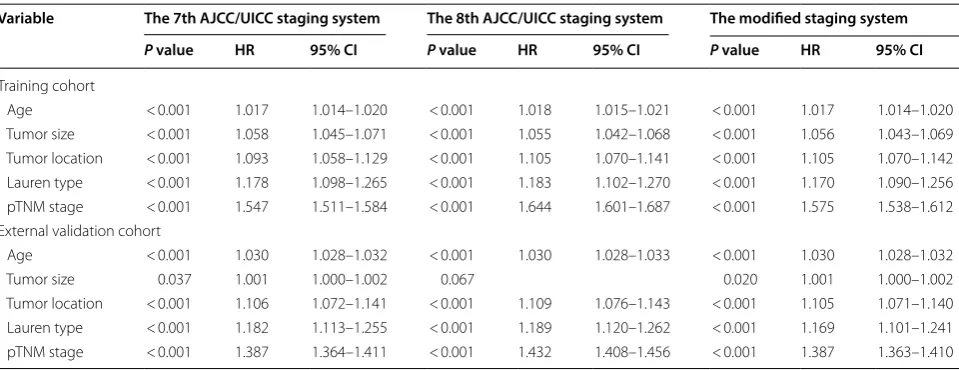
In multivariate analyses, age, tumor size, tumor loca-tion, Lauren type, and pTNM stage classified according to the 7th and 8th editions of AJCC/UICC staging sys-tem were identified as independent prognostic factors (all P < 0.001; Table 2).
Stage migration
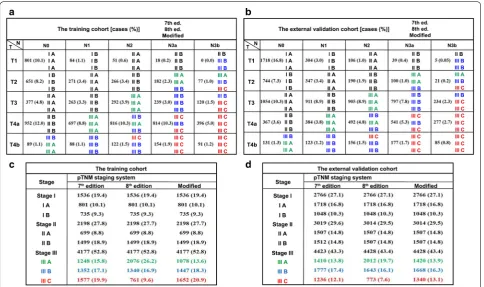
Figure 2 illustrates the stage migration between the 7th and 8th AJCC/UICC staging systems for both cohorts. The migration was mainly observed in stage III patients. In the training cohort, 197 (2.5%) and 1841 (23.2%) patients were observed to be upstaged and downstaged, respectively, as classified according to the 8th edition over the 7th edition of AJCC/UICC staging system. The external validation cohort similarly demonstrated that 260 patients (2.5%) were upstaged, and 1320 patients (12.9%) were downstaged.
Discriminatory ability and monotonicity of the 7th and 8th AJCC/UICC staging systems
The OS curves of patients grouped according to the two editions of AJCC/UICC staging system are displayed in Fig. 3a, b, d, e. The 5-year OS rates of the training and external validation cohorts were 53.0% and 41.0%, p pathological, TNM tumor-node-metastasis, ed. edition
Table 1 (continued)
Variable Training cohort (n= 7911) External validation cohort (n= 10,208)
No. of patients
[cases (%)] 5‑year OS rate (%) P value No. of patients [cases (%)] 5‑year OS rate (%) P value
pTNM stage (modified) < 0.001 < 0.001
IA 801 (10.1) 96.6 1718 (16.8) 76.6
IB 735 (9.3) 84.4 1048 (10.3) 62.5
IIA 699 (8.8) 75.5 1507 (14.8) 51.3
IIB 1499 (18.9) 63.0 1507 (14.8) 38.2
IIIA 1078 (13.6) 50.9 1420 (13.9) 30.3
IIIB 1447 (18.3) 36.9 1668 (16.3) 21.7
IIIC 1652 (20.9) 16.0 1340 (13.1) 9.7
Table 2 Multivariate survival analyses of the training and external validation cohorts of gastric cancer patients
HR hazard ratio, CI confidence interval, p pathological classification, TNM tumor-node-metastasis staging system
Variable The 7th AJCC/UICC staging system The 8th AJCC/UICC staging system The modified staging system
P value HR 95% CI P value HR 95% CI P value HR 95% CI
Training cohort
Age < 0.001 1.017 1.014–1.020 < 0.001 1.018 1.015–1.021 < 0.001 1.017 1.014–1.020 Tumor size < 0.001 1.058 1.045–1.071 < 0.001 1.055 1.042–1.068 < 0.001 1.056 1.043–1.069 Tumor location < 0.001 1.093 1.058–1.129 < 0.001 1.105 1.070–1.141 < 0.001 1.105 1.070–1.142 Lauren type < 0.001 1.178 1.098–1.265 < 0.001 1.183 1.102–1.270 < 0.001 1.170 1.090–1.256 pTNM stage < 0.001 1.547 1.511–1.584 < 0.001 1.644 1.601–1.687 < 0.001 1.575 1.538–1.612 External validation cohort
Age < 0.001 1.030 1.028–1.032 < 0.001 1.030 1.028–1.033 < 0.001 1.030 1.028–1.032
Tumor size 0.037 1.001 1.000–1.002 0.067 0.020 1.001 1.000–1.002
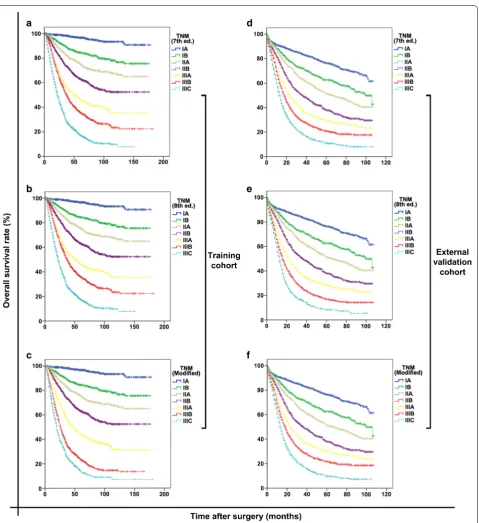
respectively. For the training cohort, the OS curves showed significant differences between every two groups classified according to either the 7th (all P < 0.001; Fig. 3a) or the 8th AJCC/UICC staging system (all P < 0.001; Fig. 3b). Similar results were observed in the external validation cohort (all P < 0.001; Fig. 3d, e). The observed survival differences among the groups represented satis-factory discriminatory ability and monotonicity of both staging editions.
Homogeneity of the 7th and 8th AJCC/UICC staging systems
In the training cohort, the 7th AJCC/UICC staging sys-tem demonstrated poor homogeneity in stage IIIA-C because the survival rates of subgroups of patients within stage IIIA, IIIB, or IIIC were significantly different (all
P < 0.001; Fig. 4a–c). When classified according to the 8th AJCC/UICC staging system, subgroups of patients within stage IIIA or IIIB still showed significant differences in survival (both P < 0.001; Fig. 4d, e), but those within stage IIIC did not show such differences (P= 0.364; Fig. 4f).
In the external validation cohort, the 7th AJCC/UICC staging system demonstrated good homogeneity in stage IIIA (P= 0.397; Fig. 4j), but not in stages IIIB and IIIC (P= 0.034 and P= 0.005; Fig. 4k, l); the 8th AJCC/UICC staging system demonstrated good homogeneity in stages IIIA and IIIC (P= 0.085 and 0.060; Fig. 4m, o), but not in stage IIIB (P= 0.002; Fig. 4n).
Proposal of a modified pTNM staging system
To improve the homogeneity in stage III classification, a modified pTNM staging system was proposed accord-ing to the best log-rank χ2 values in the training cohort. In the modified pTNM staging system, with the best-observed homogeneity (Fig. 5, upper part), stage IIIA was composed T3N2, T4aN1, and T4bN0; stage IIIB was composed of T2N3a, T3N3a, T4aN2, T4bN1, and T4bN2; and stage IIIC was composed of T2N3b, T3N3b, T4aN3a, T4aN3b, T4bN3a, and T4bN3b (Fig. 5, lower part). Stage I and II classifications remained unchanged. The modified pTNM staging system demonstrated opti-mal discriminatory ability and monotonicity in both the training and external validation cohorts as supported by
Fig. 2 Stage migration between the 7th and 8th editions of AJCC/UICC staging system as well as the modified pTNM staging system for both the training and external validation cohorts. a Classification illustrated in the training cohort; b classification illustrated in the external validation cohort;
mild differences in survival (Fig. 3c, f). When classified according to the modified pTNM staging system, sub-groups of patients within stage IIIA, IIIB, or IIIC showed
no significant differences in survival in either the training cohort (all P > 0.05; Fig. 4g–i) or the external validation cohort (all P > 0.05; Fig. 4p–r).
Fig. 3 Discriminatory ability and monotonicity of the 7th and 8th AJCC/UICC staging systems and the modified pTNM staging system for both the training and external validation cohorts. a–c The training cohort grouped according to the 7th, 8th, and modified pTNM staging systems, respectively; d–f the external validation cohort grouped according to the 7th, 8th, and modified pTNM staging systems, respectively. AJCC/UICC
Prognosis prediction performances of the 7th and 8th AJCC/UICC staging systems against the modified pTNM staging system
The performance results of the competing staging sys-tems are displayed in Table 3. Compared with the 7th and 8th AJCC/UICC staging systems, the modified pTNM staging system demonstrated the best homogeneity (the highest likelihood-ratio χ2 score), discriminatory ability, gradient monotonicity (the highest log-rank χ2 and lin-ear-trend χ2 scores), and the lowest AIC value, display-ing an optimal prognostic stratification ability in both the training and external validation cohorts.
Discussion
In the present study, both the 7th and 8th AJCC/UICC staging systems demonstrated poor homogeneity in the training and external validation cohorts, particularly for stages IIIA, IIIB, and IIIC, an observation that was not mentioned by the International Gastric Cancer Associa-tion (IGCA). Thus, a modified pTNM staging system was proposed. For convenience in the clinical application of the proposed modified pTNM staging system, the classi-fications of “T” and “N” categories were not altered, and, based on our statistics, we focused on a more homoge-nized re-classification approach to improve the subgroup classification. The Kaplan–Meier OS curves demon-strated similarity among the subgroups of patients within stage IIIA, IIIB, or IIIC classified according to the modi-fied pTNM staging system and revealed optimal homo-geneity. Furthermore, compared with the 7th and 8th AJCC/UICC staging systems, the modified pTNM stag-ing system also displayed the best homogeneity, discrimi-natory ability, and monotonicity of gradients both in the training and external validation cohorts.
The TNM staging system is the common “language of cancer” [10, 11], enabling comparisons between different populations irrespective of country and ethnicity. With the improvement of surgical techniques, the number of retrieved LNs is increased dramatically, and the defini-tion of the category N3ab as the presence of more than 6 metastatic LNs is too broad. In the 8th AJCC/UICC pTNM staging system for GC, the category N3ab is sub-divided into N3a and N3b to improve the accuracy of staging and prognosis prediction. Our results have shown
that, with this subdivision, the 8th AJCC/UICC pTNM staging system (comprised of 25 subgroups of the T, N, and M categories) provided a more precise classification than those the 7th edition (comprised of 20 subgroups), emphasizing personalized treatment. However, among the recently published studies that had compared the prognosis prediction performance between the 8th and 7th editions, none focused on the homogeneity of both editions [12–15].
In the present study, 197 (2.5%) patients were upstaged and 1841 (23.2%) were downstaged as classified accord-ing to the 8th edition over the 7th edition of AJCC/UICC pTNM staging system in the training cohort, whereas 260 (2.5%) were upstaged and 1320 (12.9%) were downstaged in the external validation cohort. We also observed that the majority of stage migration occurred for stage III patients (99%, data not shown) in both cohorts, whereas only 1% was observed for stage II patients (T1N3b and T2N3b). As such, the present study was mainly focused on patients with stage III disease.
Furthermore, our analyses revealed that the 8th edition had better discriminatory ability and monotonicity than did the 7th edition in both cohorts, which was consist-ent with the results reported by IGCA [16]. However, Kaplan–Meier analyses indicated significant differences in OS among the subgroups of patients within stage IIIA, IIIB, or IIIC classified according to either of the two stag-ing editions. This poor homogeneity was significantly improved in our modified pTNM staging system.
Although our proposed modified pTNM staging sys-tem was shown to be superior to the 7th and 8th AJCC/ UICC pTNM staging systems, there are certain limita-tions worth mentioning. First, our training cohort was based on a Chinese population database. Whether this proposed modified pTNM staging system is suitable for populations from other countries has yet to be verified. However, the treatment protocol for locally advanced GC of the same TNM category differs in Asian and West-ern cancer centers and may explain the observed lower 5-year OS rate in the external validation cohort as com-pared with that in the training cohort. Neoadjuvant ther-apies followed by radical resection (including D1 or D1+
lymphadenectomy) are conventionally opted in the west; however, in Asian cancer centers, radical surgery (D2
Fig. 4 Homogeneity in stage classifications using the 7th and 8th AJCC/UICC staging systems and the modified pTNM staging system for both the training and external validation cohorts. a–c Stages IIIA, IIIB, and IIIC classified according to the 7th edition, respectively; d–f stages IIIA, IIIB, and IIIC classified according to the 8th edition, respectively; g–i stages IIIA, IIIB, and IIIC classified according to the modified pTNM staging system, respectively. j–l Stages IIIA, IIIB, and IIIC classified according to the 7th edition, respectively; m–o stage IIIA, IIIB, and IIIC classified according to the 8th edition, respectively; p–r stage IIIA, IIIB, and IIIC classified according to the modified pTNM staging system, respectively. The homogeneity of the proposed modified pTNM staging system is higher, supporting by mild differences in survival curves, than those of the 7th and 8th AJCC/UICC staging systems
lymphadenectomy) followed by adjuvant therapy are pri-marily considered. Therefore, to extend the possible use of our proposed modified pTNM staging system, we used the SEER database for external validation. Additionally, to the best of our knowledge, the sample size of the train-ing cohort, came from three highest-capacity GC centers
across North and South China, is the largest among all such studies. This further supports the reliability of the results of the present study. Additionally, despite the difference in OS between the training and external vali-dation cohorts that may have been caused by distinct demographic features, different lymphadenectomy types
Fig. 5 Proposal of a modified pTNM staging system according to the best log‑rank χ2 values in the training cohort. In the modified pTNM staging
and pathological variables, the proposed modified pTNM staging system can still be universally applied in the West because it was successfully validated in a large exter-nal validation cohort from the SEER database. Second, the sample sizes of some subgroups classified accord-ing to the 8th AJCC/UICC pTNM stagaccord-ing system were relatively small [for instance, T1N3b (0% in the train-ing cohort and 0.05% in the external validation cohort) and T2N3b (1.0% in the training cohort and 0.2% in the external validation cohort)], possibly due to the low rate of LN metastasis in patients at stage T1 or T2, and may have influenced the efficiency of comparison. Therefore, a study with a much larger sample size is required to fur-ther confirm the findings of the present study. Third, due to the retrospective nature of the present study, tumors involving the esophagogastric junction (EGJ) were not included in our analysis because the distances of their epicenters from the EGJ were not specifically mentioned in the retrieved Chinese and SEER databases.
Conclusions
Using large cohorts of patients from Chinese cancer centers and the SEER database, our results identified that both the 7th and 8th AJCC/UICC pTNM staging systems still possess poor homogeneity, particularly for stage III GC patients, although the homogeneity, discriminatory ability, and monotonicity of gradients are improved in the 8th edition. A modified pTNM staging system for GC was thereby proposed and validated, demonstrating superior stratification and prognosis prediction ability and suggesting high potential for clinical application in different populations.
Authors’ contributions
Conception and design: CF, ZW, HX, HL, and ZZ. Collection and assembly of data: WW, SRS, JD, and ZS. Data analysis and interpretation: WW. Manuscript writing: CF, WW, and SRS. All authors read and approved the final manuscript.
Acknowledgements
The authors thank Medbanks (Beijing) Network Technology Co. Ltd for facilitat‑ ing data collection, entry, and management.
Competing interests
The authors declare that they have no competing interests.
Availability of data and materials
The key raw data have been deposited into the Research Data Deposit (www. resea rchda ta.org.cn) with the Approval Number of 2018000773.
Consent for publication Not applicable.
Ethics approval and consent to participate
Each patient provided written informed consent before treatment, and the study protocol was approved by the institutional review boards of SYSU, TJMU, and CMU.
Funding
This work was supported by the Major Program of Collaborative Innovation of Guangzhou (No. 201508030042), the Natural Science Foundation of Guang‑ dong Province (No. 2015A030313089, 2018A030313631), Guangdong Pro‑ vincial Scientific and Technology Project (No. 2014A020232331), Guangzhou Medical, Health Science and Technology Project (No. 20151A011077), China Postdoctoral Science Foundation Grant (No. 2017M622879), and National Natural Science Foundation of China (No. 81802451).
Received: 16 March 2018 Accepted: 6 November 2018
References
1. Torre LA, Bray F, Siegel RL, Ferlay J, Lortet‑Tieulent J, Jemal A. Global cancer statistics, 2012. CA Cancer J Clin. 2015;65(2):87–108. https ://doi. org/10.3322/caac.21262 .
2. Zheng R, Zeng H, Zhang S, Chen W. Estimates of cancer incidence and mortality in China, 2013. Chin J Cancer. 2017;36(1):66. https ://doi. org/10.1186/s4088 0‑017‑0234‑3.
3. Chen W, Zheng R, Baade PD, Zhang S, Zeng H, Bray F, et al. Cancer statistics in China, 2015. CA Cancer J Clin. 2016;66(2):115–32. https ://doi. org/10.3322/caac.21338 .
4. Chen W, Zheng R, Zeng H, Zhang S. The incidence and mortality of major cancers in China, 2012. Chin J Cancer. 2016;35(1):73. https ://doi. org/10.1186/s4088 0‑016‑0137‑8.
5. Ajani JA, D’Amico TA, Almhanna K, Bentrem DJ, Chao J, Das P, et al. Gastric cancer version 3.2016, NCCN clinical practice guidelines in oncology. J Natl Compr Cancer Netw. 2016;14(10):1286–312.
Table 3 Comparison of prognosis prediction performances of the 7th and 8th AJCC/UICC staging systems with the modified pTNM staging system
AJCC/UICC American Joint Committee on Cancer/Union for International Cancer Control, pTNM pathological tumor-node-metastasis staging system, AIC Akaike information criterion
pTNM staging system Figure Log‑rank χ2 Linear‑trend χ2 Likelihood‑ratio χ2 AIC
Training cohort
7th edition 3A 2236 1595 2251 56781
8th edition 3B 2295 1636 2283 56749
Modified 3C 2425 1727 2360 56672
External validation cohort
7th edition 3D 1917 1643 1870 84973
8th edition 3E 1941 1662 1884 84959
•fast, convenient online submission •
thorough peer review by experienced researchers in your field • rapid publication on acceptance
• support for research data, including large and complex data types •
gold Open Access which fosters wider collaboration and increased citations maximum visibility for your research: over 100M website views per year •
At BMC, research is always in progress.
Learn more biomedcentral.com/submissions
Ready to submit your research? Choose BMC and benefit from:
6. Amin MB, Edge S, Greene F, Byrd DR, Brookland RK, Washington MK, Gershenwald JE, Compton CC, Hess KR, Sullivan DC, Jessup JM, Brierley JD, Gaspar LE, Schilsky RL, Balch CM, Winchester DP, Asare EA, Madera M, Gress DM, Meyer LR. The 8th edition of the AJCC cancer staging manual. New York: Springer; 2017.
7. Edge S, Byrd DR, Compton CC, Fritz AG, Greene F, Trotti A. The 7th AJCC cancer staging handbook. New York: Springer; 2010.
8. Japanese Gastric Cancer A. Japanese gastric cancer treatment guidelines 2014 (ver. 4). Gastric Cancer. 2017;20(1):1–19.
9. Wang W, Sun XW, Li CF, Lv L, Li YF, Chen YB, et al. Comparison of the 6th and 7th editions of the UICC TNM staging system for gastric cancer: results of a Chinese single‑institution study of 1,503 patients. Ann Surg Oncol. 2011;18(4):1060–7. https ://doi.org/10.1245/s1043 4‑010‑1424‑2. 10. Greene FL, Sobin LH. The staging of cancer: a retrospective and
prospective appraisal. CA Cancer J Clin. 2008;58(3):180–90. https ://doi. org/10.3322/CA.2008.0001.
11. Wang W, Sun Z, Deng JY, Qi XL, Feng XY, Fang C, et al. A novel nomogram individually predicting disease‑specific survival after D2 gastrectomy for advanced gastric cancer. Cancer Commun. 2018;38(1):23. https ://doi. org/10.1186/s4088 0‑018‑0293‑0.
12. In H, Solsky I, Palis B, Langdon‑Embry M, Ajani J, Sano T. Validation of the 8th edition of the AJCC TNM staging system for gastric cancer using the
national cancer database. Ann Surg Oncol. 2017;24(12):3683–91. https :// doi.org/10.1245/s1043 4‑017‑6078‑x.
13. Ji X, Bu ZD, Yan Y, Li ZY, Wu AW, Zhang LH, et al. The 8th edition of the American joint committee on cancer tumor‑node‑metastasis staging system for gastric cancer is superior to the 7th edition: results from a Chinese mono‑institutional study of 1663 patients. Gastric Cancer. 2017. https ://doi.org/10.1007/s1012 0‑017‑0779‑5.
14. Lu J, Zheng CH, Cao LL, Ling SW, Li P, Xie JW, et al. Validation of the Ameri‑ can joint commission on cancer (8th edition) changes for patients with stage III gastric cancer: survival analysis of a large series from a specialized eastern center. Cancer Med. 2017;6(10):2179–87. https ://doi.org/10.1002/ cam4.1118.
15. Seeruttun SR, Yuan S, Qiu H, Huang Y, Li Y, Liang Y, et al. A comprehen‑ sive analysis comparing the eighth AJCC gastric cancer pathological classification to the seventh, sixth, and fifth editions. Cancer Med. 2017;6(12):2804–13. https ://doi.org/10.1002/cam4.1230.