Apple leaf disease identification using genetic algorithm and
correlation based feature selection method
Zhang Chuanlei
1,
Zhang Shanwen
2,
Yang Jucheng
1,
Shi Yancui
1,
Chen Jia
1 (1.College of Computer Science and Information Engineering, Tianjin University of Science and Technology, Tianjin 300222, China;2. Xijing University, Xi’an, 710123, China)
Abstract: Apple leaf disease is one of the main factors to constrain the apple production and quality. It takes a long time to detect the diseases by using the traditional diagnostic approach, thus farmers often miss the best time to prevent and treat the diseases. Apple leaf disease recognition based on leaf image is an essential research topic in the field of computer vision, where the key task is to find an effective way to represent the diseased leaf images. In this research, based on image processing techniques and pattern recognition methods, an apple leaf disease recognition method was proposed. A color transformation structure for the input RGB (Red, Green and Blue) image was designed firstly and then RGB model was converted to HSI (Hue, Saturation and Intensity), YUV and gray models. The background was removed based on a specific threshold value, and then the disease spot image was segmented with region growing algorithm (RGA). Thirty-eight classifying features of color, texture and shape were extracted from each spot image. To reduce the dimensionality of the feature space and improve the accuracy of the apple leaf disease identification, the most valuable features were selected by combining genetic algorithm (GA) and correlation based feature selection (CFS). Finally, the diseases were recognized by SVM classifier. In the proposed method, the selected feature subset was globally optimum. The experimental results of more than 90% correct identification rate on the apple diseased leaf image database which contains 90 disease images for there kinds of apple leaf diseases, powdery mildew, mosaic and rust, demonstrate that the proposed method is feasible and effective.
Keywords: apple leaf disease, diseased leaf recognition, region growing algorithm (RGA), genetic algorithm and correlation based feature selection (GA-CFS)
DOI: 10.3965/j.ijabe.20171002.2166
Citation: Zhang C L, Zhang S W, Yang J C, Shi Y C, Chen J. Apple leaf disease identification using genetic algorithm and correlation based feature selection method. Int J Agric & Biol Eng, 2017; 10(2): 74–83.
1 Introduction
In recent years, due to the growing deteriorated environment for apples and other reasons, more than one
Received date: 2016-03-02 Accepted date: 2016-08-09
Biographies: Zhang Chuanlei, PhD, Associate Professor, research interest: image processing, Email: [email protected];
Zhang Shanwen, PhD, Professor, research interest: image processing, data mining, Email: [email protected]; Shi Yancui, PhD, research interest: data mining, Email: [email protected];
Chen Jia, Graduate student, research interest: data mining, Email: [email protected].
*Corresponding author:Yang Jucheng,PhD, Professor, research interest: bio recognition. College of Computer Science and Information Engineering, Tianjin University of Science and Technology, 1038 Dagu Nanlu, Hexi District, Tianjin 300222, China. Tel/Fax: +86-22-60662573, Email: [email protected].
tree. So far, the naked-eye observation of farmers or experts in field is the main approach adopted in practice for detection and identification of apple diseases[4]. However, manual identification of apple diseases is expensive, inefficient and difficult. It is well known that the perception capability of the human eyes is not strong and thus human eyes cannot discriminate minor variation in the infected part of leaf images. However, the pattern change of color leaf caused by different disease on leaf is usually tiny. In the meantime, long-time failure to adopt the accurate and quantitative method on symptom description might result in the confusing judgement standard of the apple diseases, which might lead to blind utilization of pesticides and serious pollution of agricultural products, soil and water[5,6]. As the apple
diseases could cause diverse and complex apple leaf symptoms, diseased leaf image processing and recognition have attracted many researchers in the area of pattern recognition[1-6]. In the research of identifying and diagnosing plant diseased leaf image using computer vision techniques, feature extraction or dimensionality reduction is a key task. Usually after being infected, the color, texture and shape of plant diseased leaves are different from the normal ones, which could be an important evidence to diagnose the plant disease[7-9]. So far, many methods have been proposed for plant diseases recognition. Using color, shape or texture as distinguishing evidences, some scholars determined the threshold of the normal part and the pathological part and recognized the disease type from colorimetry. If only choosing one feature of color, shape and texture as discriminant factor, the recognition accuracy of the apple disease is not satisfactory. Recently, features of the shape, texture and color of the plant diseased leaf image were adopted for the apple leaf disease type identification. Inspired by this, in this research, we proposed an apple disease recognition method by using apple leaf image processing and pattern identification algorithm, with 38 classifying features of color, texture and shape extracted from each disease spot image. To reduce the dimensionality
of the feature space and improve the accuracy of the apple leaf disease identification, the most valuable features were selected by combining genetic algorithm
(GA) and correlation based feature selection (CFS). The manuscript is organized as follows: section 2 describes the process of the apple image acquirement, pre-processing, and spot segmentation with region growing algorithm (RGA); section 3 introduces the features extraction from the spot images, feature selection by combing GA and CFS, and disease recognition by SVM classifier; section 4 gives the experiment results and analysis; section 5 concludes the paper and outlines directions of future research work.
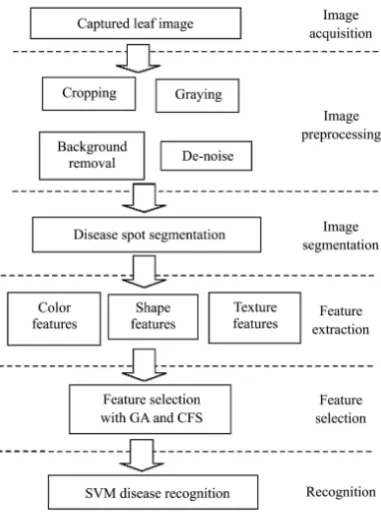
2 Materials and methods
2.1 Apple diseased leaf image collection
Among the over 100 common apple diseases, we chose powdery mildew, mosaic and rust as the testing diseases. Powdery mildew is a very common apple leaf disease, except for damaging apple, powdery mildew also damages begonia, binzi etc. Mosaic is a kind of virus disease occurs generally in the apple orchard. Apple rust is another kind of leaf disease, which is a main danger to apple leaf stick, leaves, shoots and tender green fruits. In recent years, with the development of city and road planting, as well as a large number of distant transportation of planting trees, rust becomes much more popular in some growing areas, and the incidence of the disease is increasing year by year. Rust has become a major disease to apple tree.
denoising, image segmentation and plant recognition, etc. A and B are connected through a USB cable and the captured plant leaf images are stored in a SD card in B. Among all of them, the CCD digital camera is used with close-up mode, auto white balance, flash off, and various settings are fixed to guarantee the same conditions to collect each leaf image. In addition, the leaf images were collected with 2560×1920 resolution and transformed into computer in the form of JPEG. The proper background is also quite significant for gaining the high quality images. Total 90 diseased leaf images of the three kinds of apple diseases were taken with light blue background.
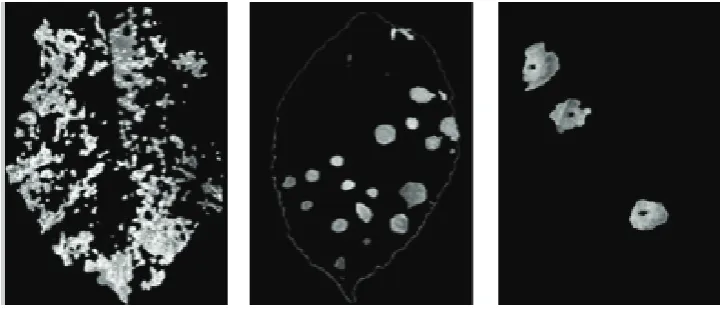
Figure 2a shows the three apple diseased leaf images collected by this image collection system. It can be seen that the collection system largely solves the illumination
unevenness problem and assures the uniformity of the external sampling conditions. It should be noticed that the apple diseases have obvious infected spots. Figure 2b is the gray images of Figure 2a. From the gray histogram, we can see that the histogram presents multiple peaks and the interval is not obvious (shown in Figure 2c), which would bring certain problem for late image processing and disease spot segmentation.
Figure 1 The leaf image collection system
a. The original apple diseased leaf images of powdery mildew,
mosaic and rust, respectively
b. The gray images of powdery mildew, mosaic and rust, corresponding to Figure 2a
c. The gray images of powdery mildew, mosaic and rust, corresponding to Figure 2b
d. The spots of powdery mildew, mosaic and rust
2.2 Spot image segmentation
Before extracting the classifying features from the apple diseased leaf images, some pre-processing steps must be implemented, i.e., resizing image, reducing noise, masking the green-pixels, removing the masked green pixels, etc.[9] To improve the operation speed of computer programs, all of the diseased leaf images were resized to 400×300 without changing the image ratio by the nearest neighbor interpolation method, and were denoised by the median filter algorithm (medfilt2) in Matlab, which uses the default 3-by-3 neighborhood, to enhance image quality.
In order to accurately segment the spot region on a diseased leaf image, the diseased leaf image was segmented from the background by using histogram method and then RGA was employed to separate the diseased leaf spots from the diseased leaf images. RGA is a simple region-based image segmentation approach to partition an image into regions in which neighboring pixels of the initial seed points are examined whether the pixel neighbors should be added to the region[11-13].
Compared with the dynamic threshold method, fuzzy clustering and Otsu method, RGA is more suitable for the situation where the boundary of the disease spot is not distinct, and the disease spot can be exactly segmented[11-14]. After histogram based segmentation, uniform blocking was performed with a size 8×8. Then a quad tree structure based merge-split routine was conducted in RGA based apple leaf disease spot segmentation scheme, which means that the merging and splitting of regions goes from 4 to 1 and 1 to 4, respectively. Firstly, an initial threshold was set as an input. The threshold decides if a region can be merged into another and if a region can be split into smaller ones based on the difference between the maximum and minimum intensities in each region. If the max-min difference value of a region is close to the max-min difference of its neighbors, which means that the difference between regions is within the threshold, then the region and its neighbors are merged into one region. A region is split if the max-min difference of the region exceeds the threshold. This process is done recursively
until no regions satisfy the criteria to be split or merged[13]. The threshold value can be set based on experience. In our experiment, we set it as 16. Region growing was done by examining properties of each region and merging them with adjacent regions that satisfy some rules. The rule used in this research is to check the max-min difference and combine adjacent regions whose max-min difference is within a threshold. The new region is now the seed and the process is repeated, examining adjacent regions, comparing max-min differences, and adding regions that are within the threshold. The threshold value was set the same as the one used in the merge-split, though it does not have to be that. To eliminate the image noise, open and close operations were used to the segmented images, which can remove some small spots and small holes. The segmentation result is demonstrated in Figure 2d. One advantage of RGA is that the borders of regions found by region growing are perfectly thin and connected, as we only added pixels to the exterior of region in interest.
3 Feature extraction
As the disease leaves and the spot images are very complex, diverse and irregular, image processing techniques were applied to the acquired images to extract useful features that are necessary for further disease type identification[1,7,9,14]. The number of samples for each disease (powdery mildew, mosaic and rust) leaf is 30 and the total dataset size used in the experiment is 90.
3.1 Color features extraction
and HSI. These features include mean value, correlation, deviation, energy in RGB and HSI space. In this study, the nine mean value parameters of R, G, B, r, g, b, H, I and S were extracted from each spot image. In order to further identify the color features that can distinguish the different diseases, we also utilized the statistical characteristics of five statistical parameters, i.e., variance, skewness, peak value, energy and entropy of hue H, the formula is as follows[13,14]:
3 3 1 2 2 1 4 4 1 2 1 1
1 / ( ) ( )
( ) ( )
1 / ( ) ( ) 3
[ ( )]
( ) lg[ ( )]
K b b F b N b E b
b b b p b
b b p b
b b b p b
b p b
b p b p b
δ δ δ = = = = = = − = − = − − = =
∑
∑
∑
∑
∑
(1)where, p(b)=H(b)/A0is grey level; H(b) is the histogram
of the diseased leaf spot; A0 is the area of the spot, cm2;
1
( )
b
b bp b =
=
∑
is mean value; d is variance; bK is skewness;bF is peak value; bN is energy; bE is entropy.
According to the above analysis, the nine mean values of the color components and five statistical parameters of hue H are expressed as color feature parameter of the disease spot.
3.2 Shape features extraction
Shape is one of the most important features for infected apple leaf disease spot image. It can be seen from the apple disease leaves that the shape of different kinds of diseases varies a lot. After diseased leaf image edge extraction and spot image segmentation, the edge and area of target disease spot were obtained and then the shape features of disease spot could be extracted. It is not very suitable to use the absolute value of the classifying features as classification evidence, and instead the relative value of the classifying features should be considered[9,17]. The shape description can be derived from the disease spot outline, through which, the geometric features of four relative values, i.e., circularity of the selected disease spot area SCIR, eccentricity SECC,
shape complexity SCOM and shape parameter SFAC are
calculated and they could be treated as shape feature of disease spot. The formulas are as follows:
2
2
/ /
( ) /
4 / ( )
CIR incricle excricle
ECC long short COM
FAC
S R R
S Length Length S Perimeter Area S πArea Perimeter
= = = = (2)
where, Rincricle is the inscribed radius of disease spot;
Rexcricle is the circumscribed radius of disease spot;
Lengthlong is long axis length of disease spot;
Lengthshort is short axis length of disease spot; Perimeter
is perimeter of disease spot and Area is the field area of disease spot.
Circularity is the ratio of inscribed radius and circumscribed radius. Eccentricity represents the ratio of disease area long axis and short axis to describe the compactness of the area, that is, the fatter the disease shape is, the larger the eccentricity is. Shape complexity describes the perimeter of unit area, the complexity of area, dispersion degree, that is, the larger the value is, the more complex the target shape is. Shape parameters describe the proximity to round and the parameter value ranges from 0 to 1, that is, under the same condition of area, if the boundary of the disease area is round and smooth, the perimeter is the shortest and the value is 1. The more deflected from round the configuration of disease spot, the smaller the value is and the closeness to round is 1 and other cases are smaller than 1.
3.3 Texture feature extraction
The texture of tissue of apple diseased leaf is usually different from the healthy ones[17,18]. The color co-occurrence texture features can be extracted through spatial gray-level dependence matrices (SGDM), which is a statistical way to describe shape by statistically sampling in the way where certain gray-levels occur in relation to other gray levels. SGDM can measure the probability that a pixel at one particular gray level will occur at a distinct distance and orientation from any pixel given that pixel has an another particular gray level. The matrices are represented by the function p(i, j, d, θ), where i represents the gray level of the location (x, y), and
the RGB spot image into gray, the four gray level co-occurrence matrices are produced from four directions (0º, 45º, 90º and 135º) of spot image. In the calculation of the gray level co-occurrence matrix, the texture features will be different with the variation of the distance parameter d. Different texture features will inevitably lead to changes in the description of the texture. Therefore, it is very important to determine the optimal value of distance parameter d. If the distance parameter is too large, the pixel information between gray levels will be lost and there will be some gray scales that cannot be extracted. If the distance parameter is too small, there will be overlap with the text features and the calculation load is high. Based on the comprehensive balance, we set the value of distance parameter d to be 20 pixels. Five statistical texture features, contrast of disease area TCON, correlation TCOR, energy TENE, inertia moment TINV and entropy TENT are extracted by
p(i, j, d, θ) from each matrix, respectively, as follows.
Thus, 20 texture features form a texture feature vector.
1 1 2 0 0 1 1 0 0 1 1 2 0 0 1 1 2 0 0 1 1 0 0 ( ) ( , , , ) ( )( ) ( , , , ) ( , , , ) ( , , , ) 1 ( )
( , , , )log[ ( , , , )]
L L CON i j L L x y COR
i j x y L L ENE i j L L LVN i j L L ENT i j
T i j p i j d
i j p i j d T
T p i j d
p i j d T
i j
T p i j d p i j d
θ
μ μ θ
σ σ θ θ θ θ − − = = − − = = − − = = − − = = − − = = = − − − = = = + − = −
∑∑
∑∑
∑∑
∑∑
∑∑
(3)where, μx and μyis mean value; σx and σy is variance; p(i, j)
is a normalized gray-level co-occurrence matrix; i and j
represent gray value of pixel; L is the grey level of image. The physical significance shown by the formula can refer to reference[19,20].
3.4 Feature selection
GA is a heuristic search method that simulating the process of natural selection to solve the optimization problem[21-23]. GA belongs to the larger class of
evolutionary algorithms, which generate solutions to optimize problems using techniques inspired by natural evolution, such as inheritance, mutation, selection, and
crossover. There are three important steps for GA. Firstly, selecting the solutions for the crossover and mutation. This step can be done using a metric. Secondly, taking pairs of solutions for crossing, which can be done randomly. Crossover consists in creating new solutions with parts of two solutions. The two original solutions are named parents (father and mother) and the two new solutions are sons. The son is half from father and half from mother. Lastly, it takes some sons for mutation. The mutation is a step that allows creating new solutions. It can be done using a perturbation or a local search. Feature selection aims to select the most significant features, which can be effectively implemented by GA. It is important to design the fitness function in GA. The merit value of correlation feature selection (CFS)[23,24] can be regarded as the fitness function of GA. CFS is a good measure to evaluate a subset of features on the basis of the following hypothesis: the good feature subset contains the features highly correlated with the classification, yet uncorrelated to each other. Given a feature subset S that containing k features, CFS finds an optimal feature subset to predict the class and the correlation between the features of the subset by the merit value, as follows:
max ( 1) k cf S ff kr M
k k k r
=
+ − (4)
where, rcf is the mean of all feature-feature correlations, ff
r is the mean of all feature-class correlations.
The correlation between two feature vectors X and Y
is computed as follows:
2 2 2 2
( ) ( ) ( ) ( ) ( ) ( ) ( )
XY
E XY E X E Y r
E X E X E Y E Y
− =
− − (5)
By the above analysis, we can select an optimal feature subset for apple leaf disease recognition by combining the CFS and GA. The feature subset has the highest capacity to predict the apple disease class and the least correlation among features of the subset.
3.5 Support vector machine (SVM)
analyzing a given set of labeled observations (the training set) so as to predict the labels of unlabeled future data (the test set). In the case of SVM, a data point is viewed as an r-dimensional vector (a list of p numbers), and one wants to know whether such points can be separated with an (r-1)-dimensional hyper plane. Multiclass SVM aims to assign labels to samples by using SVM, where the labels are drawn from a finite set of several elements. The dominant approach for doing so is to reduce the single multiclass problem into multiple binary classification problems.
3.6 Apple leaf disease identification
The original apple leaf images were processed in the form of JPEG by using Matlab7.6 and their sizes are all 2560×1920. Running under Windows XP, the Lenovo 4600 commercial computer was used with 2.5 GHz processor, 1 GB memory and 160 GB hard disk. From Subsection 3.1-3.3, a total of 38 valid feature parameters of color, shape and texture were extracted from each segmented spot image, respectively. The 14 color parameters include mean values of R, G, B, r, g, b, H, I and S, and five statistical color moment parameters of hue H. Four shape parameters are area SCIR, eccentricity SECC,
shape complexity SCOM and shape parameter SFAC.
Twenty texture parameters are contrast of disease area
TCON, correlation TCOR, energy TENE, inertia moment TINV
and entropy TENT in four directions. Usually, the largest
proportion of classification features indicates the largest contribution in recognition. In fact, it does not mean that more features are better. Too many features may degrade the effectiveness of the disease recognition algorithm. Among all of the 38 features, some features may not contribute meaningful information to the disease recognition algorithm; even some features may actually reduce the quality and accuracy of the recognition algorithm, and some features have little or no effect on the recognition[27,28]. Therefore, selecting the most significant features is a very important step in the apple leaf disease recognition task, which can be conducted by combining CFS and GA. When the optimal feature subset obtained, the apple diseases can be recognized by SVM. The process of the apple leaf disease recognition is shown in Figure 3.
Figure 3 Process of the apple leaf disease recognition
4
Experiment results and comparison analysis
By now, it is a known hard problem that which features and how many features need to be extracted from every diseased leaf image. In all most of leaf based plant recognition methods, a number of features are extracted and selected from each leaf image for plant leaf classification. The difference between these methods is the different extracted features and different classifiers used to classify the leaf images. Ten texture feature used in literature [15] when applied to the current dataset does not yield satisfactory results, due to the complexity of the spot image segmented from the diseased leaf image. Color feature used in literature [15] when applied to the current dataset does not yield satisfactory results, due to slight deviations in green shades between leaves in general. Because the plant disease is relate to the color, texture and shape of leaf, so many features of color, texture and shape need to be extracted. In the proposed method, 38 features of color, texture and shape were extracted from each spot image. One of the highlight of the proposed method is that an optimal feature subset for apple leaf disease recognition is selected by combining the CFS and GA.
Figure 2. The experiment is conducted by using image processing & statistical tools in Matlab7.6. Each of the image is read in R=rgb_image(:, :, 1), G=rgb_image(:, :, 2) and B=rgb_image(:, :, 3). The size of the original apple leaf disease image is 2560×1920 with format of JPEG, 24 bitmap. To improve the operation speed of computer programs, the image of grape diseases is compressed from 2560×1920 to 400×300 in the same proportion without losing much image resolution by using the nearest neighbor interpolation method. Then the apple diseased leaf images are de-noised by the median filter algorithm. After image pre-processing, RGA was used to segment the apple diseased leaf images and the spot images can be obtained. With Matlab7.6, 38 image features including 14 color features, 4 shape features and 20 texture features are extracted from every segmented spot image, and then were normalized, respectively. All normalized features from each image constitute a feature vector. That is to say, each vector represents a spot image. The feature dataset have 90 rows, representing 30 spot images from each of three classes of apple disease leaves. Each row has 38 columns representing the 38 features extracted from each spot image. Each row had a unique number (1, 2 or 3) which represented the class (i.e., the disease class) of the particular row of data. “1” represents powdery mildew disease infected leaf, “2” represents mosaic disease infected leaf, and “3” represents rust disease infected leaf. All disease image feature dataset is divided into training set and test set. 20 feature vectors of each kind of apple disease were randomly selected as the training set, and the remaining were regarded as the testing set. Then, a software program was written in Matlab which takes in “.mat” files representing the training and testing database. The classifier was trained by using the “train files”, and the “test file” was used to perform the classification task on the test database. Consequently, a Matlab routine would load the training and testing data files and make modifications to the data according to the proposed model chosen. In the experimental results, the threshold value for each of the three classes is constant for all spot images infected with the same disease. This threshold is a global image threshold that is computed using region
growing algorithm (RGA). In the training set, a feature selection task was conducted by combining CFS with GA, and then the optimal feature subset was obtained, including eight features which are mean values of R, H, entropy of H bE, shape complexity SCOM, the field area
of disease spot Area, energy TENE, inertia moment TINV and entropy TENT. After the optimal feature subset is obtained, the apple leaf diseases can be recognized by SVM. To verify the effectiveness of the proposed method, we compared the results of the proposed method with other two methods. One is leaf diseases detection using k-means-based segmentation and neural-networks-based classification (KMS+NNC)[4], and the other is color feature extraction of tomato leaf diseases (CFE)[15]. For comparison purpose, all three
methods perform the experiment 50 times, recording the highest recognition rates in each experiment for each algorithm and calculating the mean of 50 times values to obtain the final recognition results. Table 1 shows the average recognition rates of three methods on three kinds of apple diseases.
Table 1 Recognition results of apple leaf diseases in training set %
Methods Powdery Mildew Mosaic Rust Total
KMS+NNC 91.34 89.75 90.62 90.57
CFE 91.62 88.29 87.12 89.01
The proposed method 96.30 95.03 95.11 95.48
Table 2 Recognition results of apple leaf diseases in test set
%
Methods Powdery Mildew Mosaic Rust Total
KMS+NNC 87.85 87.21 88.12 87.73
CFE 88.38 85.32 86.30 86.67
The proposed method 94.78 93.61 94.28 94.22
features selected by GA+CFS. For the different types of apple leaf disease, appropriate image segmentation method and GA+CFS could be determined after simulation based on the extracted features.
5 Conclusions
In this study, RGA, GA-CFS and SVM were used to achieve image recognition of apple diseases based on the extracted color features, shape features and texture features from the diseased leaf images and their combined features. The experiment results showed that GA-CFS can be used to select useful features to achieve identification and classification of the apple leaf diseases based on disease image processing and pattern recognition. This paper provided some theoretical basis and practical technology for developing the automatic apple disease diagnosis and monitoring system with practical value, and has some practical significance in enhancing the further application of electronic information technology in apple protection. With the method proposed in this paper, by acquisition of apple disease leaves, feature extraction and selection, combined with plant protection expert system, powdery mildew, mosaic and rust could be more accurately identified specifically. The method also can be extended to other apple leaf diseases.
In further studies, image segmentation, disease feature extraction and selection methods should be explored and a web-based apple disease image recognition system should be developed with computer vision and Internet of things (IoT) technologies. The diseased leaf image recognition system should be capable of processing the diseased leaf images acquired in different ways. Especially, the apple diseased leaf images in this paper were captured in a controlled environment. We will consider conducting the exploration under natural illumination in future research.
Acknowledgements
The authors would like to thank the anonymous reviewers for their critical and constructive comments and suggestions. This work was partially supported by Natural Science Foundation of China (grant Nos.
61473237, 61202170, and 61402331). It is also supported by the Shaanxi Provincial Natural Science Foundation Research Project (2014JM2-6096), Tianjin Research Program of Application Foundation and Advanced Technology (14JCYBJC42500), Tianjin science and technology correspondent project (16JCTPJC47300), the 2015 key projects of Tianjin science and technology support program (No.15ZCZDGX00200) and the Fund of Tianjin Food Safety & Low Carbon Manufacturing Collaborative Innovation Center.
[References]
[1] Delalieuxa S, Aardtb J, Keulemansc W, Schrevensa E, Coppina P. Detection of biotic stress (Venturia inaequalis) in apple trees using hyperspectral data: Non-parametric statistical approaches and physiological implications. Europ. J. Agronomy, 2007; 27(2): 130–143.
[2] Vishnu S, Ranjith Ram A. Plant disease detection using leaf pattern: A review. International Journal of Innovative Science, Engineering & Technology, 2015; 2(6): 774–780.
[3] Wang S, He D, Li W, Wang Y C. Plant leaf disease recognition based on kernel k-means clustering algorithm. Transactions of the CSAM, 2009; 40(3): 152–155. (in Chinese)
[4] Bashish D A, Braik M, Sulieman B A. Detection and classification of leaf diseases using k-means-based segmentation and neural-networks-based classification. Information Technology Journal, 2011; 10: 267–275.
[5] Chaudhary P, Chaudhari A K, Cheeran A N. Color transform based approach for disease spot detection on plant leaf. International Journal of Computer Science and Telecommunications, 2012; 3(6): 65–70.
[6] Dong P, Wang X. Recognition of greenhouse cucumber disease based on image processing technology. Open Journal of Applied Sciences, 2013; 3: 27–31.
[7] Kadir A, Nugroho L E, Susanto A, Santosa P I. Neural network application on foliage plant identification. International Journal of Computer Applications, 2011: 29(9): 15–22
[8] Song K, Sun X Y, Ji J W. Corn leaf disease recognition based on support vector machine method. Transactions of the CSAE, 2007, 23:155–157. (in Chinese)
[10] Zhang S, Lei Y, Huang D, Wang X. Computer aided classification system for plant species based on level set and locally sensitive discriminant mapping. China Patent, No.201020204409.2. 2011-01-12. (in Chinese)
[11] Yang W, Sun C, Du H S, Yang J. Feature extraction using Laplacian Maximum Margin Criterion. Neural Processing Letters, 2011; 33(1): 99–110
[12] Adams R, Bischof L. Seeded region growing. IEEE Transactions on Pattern Analysis and Machine Intelligence, 1994; 16: 641–647.
[13] Kamdi S, Krishna R K. Image segmentation and region growing algorithm. International Journal of Computer Technology and Electronics Engineering (IJCTEE), 2013; 2(1): 103–107.
[14] Valliammal N, Geethalakshmi S N. A novel approach for plant leaf image segmentation using fuzzy clustering. International Journal of Computer Applications, 2012; 44(3): 10–20.
[15] Patil J K, Kumar R. Color feature extraction of tomato leaf diseases. International Journal of Engineering Trends and Technology, 2011; 2(2):72–74.
[16] Huang Z C, Chan P P, Ng W W, Yeung D S. Content-based image retrieval using color moment and gabor texture feature. International Conference on Machine Learning and Cybernetics (ICMLC), 2010; pp.719–724.
[17] Dhaygude S B, Kumbhar N P. Agricultural plant leaf disease detection using image processing. International Journal of Advanced Research in Electrical, Electronics and Instrumentation Engineering, 2013; 2(1): 599–603.
[18] Arivazhagan S, Shebiah R N, Ananthi S, Varthini S V. Detection of unhealthy region of plant leaves and classification of plant leaf diseases using texture features. Agric Eng Int: CIGR Journal, 2013; 15(1): 211–217.
[19] Wang K. Diagnosis of crop disease, insect pest and weed based on image recognition. Beijing: Chinese Academy of Agricultural Sciences, 2005. (in Chinese)
[20] Wang N, Wang K, Xie R. Maize leaf disease identification based on fisher discrimination analysis. Scientia Agricultura Sinica, 2009; 42(11): 3836–3842.
[21] Ziarati A. A multilevel evolutionary algorithm for optimizing numerical functions. International Journal of Industrial Engineering Computations, 2011; 2(2): 419–430. [22] Babatunde O H, Armstrong L J, Leng J, Diepeveen D. A
genetic algorithm-based feature selection. International Journal of Electronics Communication and Computer Engineering, 2014; 1(5): 889–905.
[23] Tiwari R, Singh M P. Correlation-based attribute selection using genetic algorithm. International Journal of Computer Applications, 2010: 4(8): 28–34.
[24] Guyon I, Weston J, Barnhill S, Vapnik V. Gene selection for cancer classification using support vector machines. Machine Learning, 2002; 46: 389–422.
[25] Hsu C W, Lin C. A comparison of methods for multiclass support vector machines. IEEE Transactions on Neural Networks, 2002; 13(2): 415–425.
[26] Saeys Y, Inza I, Larranāga P. A review of feature selection techniques in bioinformatics. Bioinformatics, 2007; 23(19): 2507–2517.
[27] Forman G. An extensive empirical study of feature selection metrics for text classification. Journal of Machine Learning Research, 2003; 3: 1289–1305.