Development of database and mathematical models for predicting
engine performance parameters using biodiesel
P. K. Pranav
,
Thaneswer Patel
*,
K. Padmeshore Singh
(Department of Agricultural Engineering, North Eastern Regional Institute of Science and Technology (NERIST), Nirjuli – 791 109, Arunachal Pradesh, India)
Abstract: A database for complete and quick knowledge of biodiesel was developed in Microsoft access linked with interactive interfaced of Visual Basic which contains various information such as biodiesel properties, engine performance parameters and emission characteristics. The comparisons of fuel properties among the biodiesel, its blends and engine performance parameters are one of the most attractive features of the developed database. Based on the data collected from the developed database, the analysis of variance (ANOVA) was carried out to know the effect of fuel properties on engine performance parameters. The fuel properties such as a change in calorific value and viscosity with respect to diesel were found to be significant at 5% level with brake power (BP) and brake specific fuel consumption (BSFC). However, flash point and density were found to be insignificant. Therefore, mathematical models were developed for (i) change in BP and (ii) BSFC based on the significant fuel properties. The model efficiency for BP and BSFC were found to be 92% and 91% respectively. The RMSE values were also calculated from the predicted value and found to be 1.85 and 5.45 for BP and BSFC respectively. From the above statistical facts, it is revealed that the developed mathematical models can be used to predict the change in BP and BSFC. Further, it is also expected that the developed database shall be expedient for researchers and engineers to locate various information related to biodiesel.
Keywords: biodiesel, engine performance, database, mathematical models, brake power, BSFC
DOI: 10.3965/j.ijabe.20171003.1789
Citation: Pranav P K, Patel T, Singh K P. Development of database and mathematical models for predicting engine performance
parameters using biodiesel. Int J Agric & Biol Eng, 2017; 10(3): 121–129.
1 Introduction
The scarcity of known petroleum reserves makes renewable energy resources more attractive. The most
Received date: 2015-03-08 Accepted date: 2015-12-06
Biographies: P. K. Pranav, PhD, Assistant Professor, research
interests: farm machinery & power, revewable energy and applications of computer and electronics, Email: pkjha78@gmail. com; K. Padmeshore Singh, M. Tech., research interests: farm
machinery & power and biodiesel, Email: padmeshore.k@gmail. com.
*Corresponding author: Thaneswer Patel, PhD, Assistant
Professor, research interests: agricultural ergonomics, digital human modelling and simulation, farm tools and equipment design, renewable energy. Department of Agricultural Engineering, North Eastern Regional Institute of Science and Technology (NERIST), Nirjuli (Itanagar) – 791109, Arunachal Pradesh, India. Tel: +91-360-2257401-08, Ex. 6263, Fax: +91-360-2257418, Email: [email protected].
feasible way to meet this growing demand is by utilizing alternate fuel sources. Biodiesel is one of the best candidates as an alternate fuel in diesel engines. The various fuel properties like density, kinematic viscosity, calorific values, flash point etc. are directly responsible factors for the efficient and smooth running of the engine. In recent decades, many researchers worked on different biodiesel such as Jatropha[1-7], Karanja[8-14], Coconut[15-17],
Cotton[18-21], others biodiesel[22-29] and reported the
properties of fuel and their blends. These properties are important to compare with diesel before conducting the engine performance tests. Further, comparison of fuel properties and their blends among different biodiesels are also vital. In the recent past, limited attempts[30-32] were
work is to be devoted to collect the information from different published papers. This necessitates a computer based user-friendly database of fuel properties and their corresponding engine performance parameters. By getting the comparative performance of different fuels and blends, a further research plan can be formulated in these areas without conducting exhaustive review work.
Further, the researchers are interested in knowing the performance of the C.I. engine for various proportions of biodiesels and blends. It is complex, time consuming and costly to investigate the engine performance experimentally. A mathematical model based on major fuel properties would be helpful to estimate the engine performance without conducting the exhaustive experiments. Mustafa et al.[33] and Shivakumar[34] have put their effort to develop the ANN-based engine performance model, but these are limited for the specific biodiesel as well as engine type.
In the light of the above contexts, the present study has been formulated to develop a user-friendly database for fuel properties and mathematical modeling for predicting the engine performance based on fuel properties irrespective of biodiesel and engine type with following specific objectives: 1) To develop database for different biodiesels properties and engine performance parameters in Visual Basic environment; 2) To develop mathematical models for predicting changes in brake power and brake specific fuel consumption with reference to diesel and its validation.
2 Development of database
2.1 Data collection
The data were collected by an exhaustive review of the published and unpublished scientific research work. All the available information of biodiesels are taken into consideration for developing the database in the present study. The biodiesels of main concern was Karanja, Safflower, Palm, Rapeseed, Cottonseed, Coconut and Jatropha. Information such as (i) scientific classification (production, country and state wise) (ii) chemical properties (arachidic, gadoleic, linoleic, myristic, oleic, palmitic, palmitoleic, stearic, lauric, behemic and lignoceric) (iii) Fuel properties (calorific value, flash point, pour point, kinematic viscosity, density, refractive
index and cetane index) and (iv) engine performance (brake power, brake specific fuel consumption, brake thermal efficiency and exhaust gas temperature) were collected for each biodiesel and their blends. These data of the biodiesels were fed into a database of Microsoft access and same can be read in systematic ways as and when required through a developed program in Visual Basis environment which has very interactive user interface.
2.2 Overview of the developed program
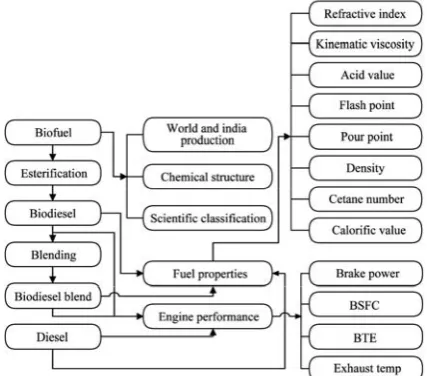
The overall approach described in this paper involves development and use of computerized simulation model for different biodiesel fuels. The software was developed in visual basic environment containing windows, a graphical user interface (GUI), which makes the software easy to use and understand. The software was developed in such a manner that novice user (without prior knowledge of software) can also run with the help of getting information from the help menu. The help menu guides the user in the proper execution, description of the software and its content available in the help menu. Software consists of several windows serving specific purposes such as databases for production related information, chemical properties, trans-esterification process, fuel, blend properties, engine performance parameters and so on. User can add, update or remove data from databases. The software has provision to export and save desired information in spreadsheet and text formats. The overall graphical representation of the developed program is shown in Figure 1.
2.3 Functioning of the software
The first window of the developed program is shown in Figure 2. On pressing the ‘Select Fuels’ button, the various fuels list appears on the window. In this window the type of fuel can be chosen from the drop down menu to view the database on the fuel. The flowchart for the production of biodiesel can be seen by selecting the ‘Production Process’ button. The components which play a major role in the production of biodiesel are stated under the ‘Basic Component’. This also includes the
description regarding the feedstock, alcohol, catalyst and neutralizer. The blending methods are also included in the database, which are mainly splash, In-tank, In-line and Rack. This can be viewed by clicking button ‘Type of Blending’.
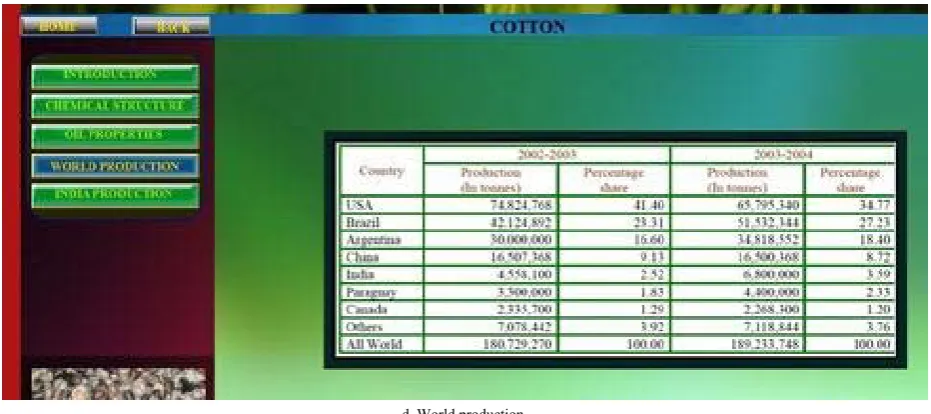
After selecting a particular oilseed second window appears which contains five menus Introduction, Chemical Structure, Oil Properties, World and India Production. These windows for cotton seed are shown in Figure 3.
Figure 2 Front page of the developed program
a. Introduction b. Chemical structure
d. World production
Figure 3 Windows showing the different information of cotton seed
2.4 Comparisons of biodiesel
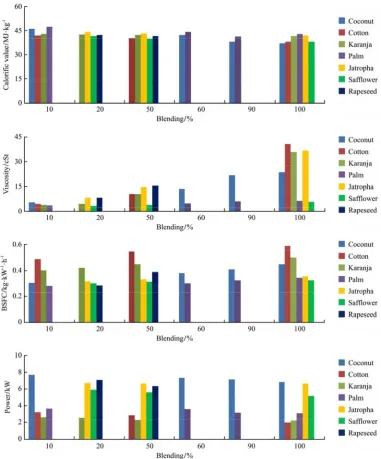
There are two different ways for the comparison in the developed program. First comparison can be done among the methyl ester of biodiesels which are obtained directly after esterification process. In order to make the comparison, click the “COMPARE” after selecting the preferable biodiesels. The fuel properties and engine performance parameters of the selected biodiesel will be displayed in the list box that is provided within the window (Figure 4a). Secondly, blend of one fuel can be compared with the blends of other biodiesels. This comparison is very much helpful, before going to conduct the engine performance test. The fuel properties and engine performance parameters of the selected blends appear in the list box (Figure 4b). Apart from the numeric comparison, a very good graphical comparison is also possible from the developed program. A graphical
comparison of some of the fuel properties and engine performance is shown in Figure 5.
3 Development of mathematical model
3.1 Data collection and compilation
The following data were accessed from the developed biodiesel database and their blends, to develop mathematical models for brake power and brake specific fuel consumption. Further, similar information for diesels were also noted for respective research. The collected data were arranged in Microsoft Excel sheet for ease of access and further analysis.
1) Fuel properties of biodiesel and their blends: i. Calorific value
ii. Flashpoint
iii. Kinematic viscosity iv. Density
a. methyl ester of biodiesels b. biodiesel blends
Figure 5 Graphical comparison of fuel properties and engine performance various biodiesel
2) Engine performance of biodiesel and their blends i. Brake power
ii. Brake specific fuel consumption
The percentage change in the biodiesel properties with respect to diesel properties of the selected research work were calculated using Equation (1). It was observed that the diesel properties were different for different research work because of error involved in measuring method and the apparatus. The negative value shows the lower than diesel and positive means higher than diesel. Further, the changed in engine performance parameter with respect to particular engine was also calculated to eliminate the effect of engine parameters.
Percentage change
Property of biodiesel Property of diesel 100 Property of diesel
=
− × (1)
3.2 Analysis of variance
the change in flash point and density were non-significant at 5% significance level because of α>0.05. Similarly, observations were also made from Table 2 that change in calorific value and viscosity have significance at 5% (α <0.05) level.
Table 1 Tests for effects for power between subjects
Source Type III sum of squares df
Mean
square F-value Sig.(α)
ΔC* 499.627 1 499.627 56.986 0.000
ΔV* 435.243 1 435.243 49.642 0.000
ΔF 10.557 1 10.557 1.204 0.275
ΔD 1.034 1 1.034 0.118 0.732 Error 867.987 99 8.768 Total 16236.272 104 Corrected Total 5241.195 103 Note: ΔC, ΔV, ΔF & ΔD – Percentage change in calorific value, kinematic viscosity, flash point & density; * Significance at 5% level.
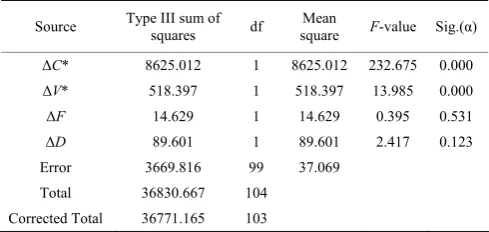
Table 2 Tests for effects of BSFC between subjects
Source Type III sum of squares df
Mean
square F-value Sig.(α)
ΔC* 8625.012 1 8625.012 232.675 0.000
ΔV* 518.397 1 518.397 13.985 0.000
ΔF 14.629 1 14.629 0.395 0.531
ΔD 89.601 1 89.601 2.417 0.123 Error 3669.816 99 37.069
Total 36830.667 104 Corrected Total 36771.165 103
Note: ΔC, ΔV, ΔF & ΔD – Percentage change in calorific value, kinematic viscosity, flash point & density; * Significance at 5% level.
3.3 Model development
Mathematical models of BP and BSFC were developed for the engine performance parameters using multiple linear regression in SPSS statistical tool. 3.3.1 Brake power model
A multiple linear regression model was developed using SPSS for percentage change in brake power. The independent variables were percentage change in calorific value and viscosity. The results of model development are shown in Table 3, which indicates that viscosity and calorific values are significant with coefficients value of –0.011 and 0.604, respectively. The value for coefficient of determination, correlation and standard error of the developed model are 0.83, 0.91 and 2.9, respectively which are considered as an acceptable model. The developed model is given as:
0.604 0.0108 1.139
ΔBP= × Δ −C × Δ −V
where, ΔBP = change in brake power, %; ΔC = change in calorific value, % and ΔV = change in viscosity, %.
Table 3 Coefficients of variables for power model
Unstandardized coefficients
Standardized coefficients Model
B Std. error Beta
t-value Sig.
Constant –1.139 0.524 - –2.173 0.032
ΔV* –0.011 0.002 –0.467 –7.078 0
ΔC* 0.604 0.080 0.498 7.557 0 Note: Dependent variable: Power (*significance).
3.3.2 BSFC model
The results related to model development are presented in Table 4. The mathematical expression of the developed BSFC model is given as:
2.543 0.011 25.697
ΔBSFC= − × Δ +C × Δ −V
where, ΔBSFC = change in brake specific fuel
consumption, %; ΔC = change in calorific value, % and ΔV = change in viscosity, %.
Table 4 Coefficients of variables for BSFC model
Unstandardized coefficients Standardized coefficients Model
B Std. error Beta
t-value Sig.
Constant* –25.697 1.084 - –23.697 0
ΔV* –2.543 0.166 –0.793 –15.361 0
ΔC* 0.011 0.003 0.187 3.629 0 Note: Dependent variable: BSFC (*significance).
The performance of the developed model was
represented by correlation (r), coefficient of
determination (R2) and standard error which was found to be 0.94, 0.897 and 6.12, respectively. These values clearly signify that the developed model for the BSFC fit well.
3.4 Validation of the developed models
The developed models were validated with the data which were not used in the model development process. This was carried out by 15% of the total collected data. The validations of the developed models were evaluated with the help of Graph Pad Prism (GPP) software. For this purpose null hypothesis of equal variance and equal means at 5% level of significance with 29 degrees of freedom for change in power and BSFC were tested using
F-test and t-test respectively.
calculated using following relationships:
1
1
( )
=
⎡ ⎤
=⎢ − ⎥
⎣
∑
⎦N
si oi
i
ME C C N
1
2 2
1
1
( )
=
⎡ ⎤
=⎢ − ⎥
⎢ ⎥
⎣
∑
⎦N
si oi
i
RMSE C C N
where, ME = model efficiency; RMSE = root mean square error; N = total number of data; Csi =ith simulated data;
and Coi = ith observed data.
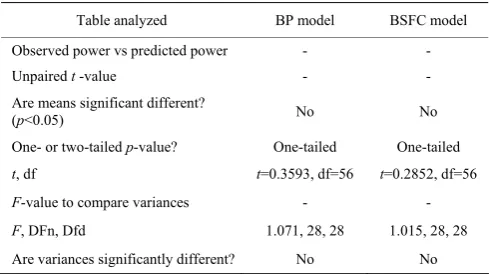
The validation result of BP and BSFC models were represented in Tables 4. The calculated value of F-test and t-test were found less than critical value at that level of 5% significance and degree of freedom. Therefore, null hypotheses were accepted and it was concluded that simulated values of change in brake power and BSFC not differ significantly from observed value. F-test and
t-test revealed the facts that developed models can be used for predicting the change in BP and BSFC by using the change in calorific value and viscosity of a particular biodiesel blend with reference to diesel fuel.
Table 4 Output of Graph Pad Prism for BP and BSFC model
Table analyzed BP model BSFC model
Observed power vs predicted power - - Unpaired t -value - - Are means significant different?
(p<0.05) No No
One- or two-tailed p-value? One-tailed One-tailed t, df t=0.3593, df=56 t=0.2852, df=56
F-value to compare variances - -
F, DFn, Dfd 1.071, 28, 28 1.015, 28, 28
Are variances significantly different? No No
Further, Root Mean Square Error (RMSE) and Model Efficiency (ME) were calculated and found that ME is more than 90% for the both models. The RMSE of the BP and BSFC models are 1.85 and 5.45, respectively. These statistical values revealed that the developed model may be the good predictor of change in BP and BSFC.
The observed and predicted data were also plotted on 1:1 line to validate the developed models which are shown in Figures 6 and 7 for brake power and BSFC, respectively. A linearity pattern was observed in both the cases i.e. BP and BSFC with R2 values of 0.9297 and 0.9076 respectively. These further strengthen the above statements that the developed models may be a good predictor for engine performance.
Figure 6 Plot of 1:1 between observed and predicted for brake power
Figure 7 Plot of 1:1 between observed and predicted for BSFC
4 Conclusions
[References]
[1] Pramanik K. Properties and use of jatropha curcas oil and diesel fuel blends in compression ignition engine. Renewable Energy, 2003; 28: 239–248.
[2] Forson F K, Oduro E K, Hammond E. Performance of jatropha oil blends in a diesel Engine. Renewable Energy, 2004; 29: 1135–1145.
[3] Hanumantha Rao Y V, Ram S V, Hariharan V S, Sitarama Raju A V. Jatropha oil methyl ester and its blends used as an alternative fuel in diesel engine. Int J Agric & Biol Eng, 2008; 1(2): 32–38.
[4] Baitiang T, Suwannakit K, Duangmukpanao T, Sukjamsri C, Topaiboul S, Chollacoop N. Effects of biodiesel and jatropha oil on performance, black smoke and durability of single-cylinder diesel engine. Journal of Metals, Materials and Minerals, 2008; 18: 181–185.
[5] Rao T V, Rao G P, Reddy K H C. Experimental investigation of pongamia, jatropha and neem methyl esters as biodiesel on C.I. engine. Jordan Journal of Mechanical and Industrial Engineering, 2008; 2: 117–122.
[6] Rao V H, Voleti Y R S, Hariharan V S, Sitarama A V, Redd P N. Use of jatropha oil methyl ester and its blends as an alternative fuel in diesel engine. J. of the Braz. Soc. of Mech. Sci. & Eng., 2009; 31: 253–260.
[7] Sahoo P K, Das L M, Babu M K, Arora P, Singh V P, Kumar N R, et al. Comparative evaluation of performance and emission characteristics of jatropha, karanja and polanga based biodiesel as fuel in a tractor engine. Fuel, 2009; 88: 1698–1707.
[8] Bhatt Y C, Verma M K. Effect of fuel temperature and injection pressure on engine performance with karanja (pongamia glabra) methyl ester oil and blends with diesel. Fuel Sci. Technology, 2000; 4: 3–7.
[9] Raheman H, Phadatare A G. Emissions and performance of diesel engine from blends of karanja methyl ester (biodiesel) and diesel. Biomass and Bioenergy, 2004; 27: 393–397. [10] Stalin N, Prabhu H J. Performance test of IC engine using
karanja biodiesel blending with diesel. Journal of Engineering and Applied Sciences, 2007; 2: 5–8.
[11] Sureshkumar K, Velraj R, Ganesan R. Performance and exhaust emission characteristics of a CI engine fueled with Pongamia pinnata methyl ester (PPME) and its blends with diesel. Renewable Energy, 2008; 33: 2294–2302.
[12] Agarwal K A, Rajamanoharan K. Experimental investigations of performance and emissions of Karanja oil and its blends in a single cylinder agricultural diesel engine. Applied Energy, 2009; 86: 106–112.
[13] Ghosal M K, Sahoo N. Performance study of diesel engine by using karanja methyl ester (biodiesel) and its blends with diesel fuel. International Journal of Agricultural Engineering,
2010; 3: 40–44.
[14] Nagarhalli M V, Nandedkar V M, Mohite K C. Emission and performance characteristics of karanja biodiesel and its blends in a C.I. engine and its economics. Journal of Engineering and Applied Sciences, 2010; 5: 2–5.
[15] Machacon H T C, Shiga S, Karasawa T, Nakamura H. Performance and emission characteristics of a diesel engine fueled with coconut oil-diesel fuel blend. Biomass and Bioenergy, 2001; 20: 63–69.
[16] Kalam M A, Husnawan M, Masjuki H H. Exhaust emission and combustion evaluation of coconut oil-powered indirect injection diesel engine. Renewable Energy, 2003; 28: 2405–2415.
[17] Singh P J, Khurma J, Singh A. Preparation, characterisation, engine performance and emission characteristics of coconut oil based hybrid fuels. Renewable Energy, 2010; 35: 2065–2070.
[18] Capareda S C, Powell J, Parnell C. Engine performance and exhaust emissions of cottonseed oil biodiesel. Beltwide Cotton Conferences, Nashville, Tennessee. 2008.
[19] Kadir A, Metin G, Duran A, Ali K. Using of cotton oil soapstock biodiesel – diesel fuel blends as an alternative diesel fuel. Renewable Energy, 2008; 33: 553–557.
[20] Krishna B M, Mallikarjuna J M. Properties and performance of cotton seed oil–diesel blends as a fuel for compression ignition engines. Journal of renewable and sustainable energy, 2009; 1: 023106.
[21] Nabi N, Rahaman M, Akhter S. Biodiesel from cotton seed oil and its effect on engine performance and exhaust emissions. Applied Thermal Engineering, 2009; 29: 2265–2270.
[22] Nwafor O M I, Rice G. Performance of rapeseed oil blends in a diesel engine. Applied Energy, 1996; 54: 345–354. [23] Aziz A A, Farid S, Mohamad A A. Performance of palm
oil-based biodiesel fuels in a single cylinder direct injection engine. Palm Oil Developments, 2005; 42: 25–29.
[24] Prasad S N, Reddy V K, Kumar B S P, Ramjee E, Hebbel O D, Nivendgi M C. Performance and emission characteristics of a diesel engine with castor oil. Indian Journal of Science and Technology, 2009; 2: 10.
[25] Yuan W, Hansen A C. Computational investigation of the effect of biodiesel fuel properties on diesel engine NOx emissions. Int J Agric & Biol Eng, 2009; 2(2): 41–48. [26] Chakrabarti M H, Ali M. Performance of compression
ignition engine with Indigenous castor oil bio diesel in Pakistan. Ned University Journal of Research, 2009; 6: 1. [27] Cumali I, Selman A, Rasim B, Huseyin A. Biodiesel from
safflower oil and its application in a diesel engine. Fuel Processing Technology, 2010; 14: 199–205.
CI engine. Applied Thermal Engineering, 2010; 30: 1199–1204.
[29] Ejilah R I, Lukman A, Bello A A. Investigation of Sclerocarya birrea seed oil extracted as a bioenergy resource for compression ignition engines. Int J Agric & Biol Eng, 2012; 5(3): 1.
[30] Hossain A K, Davies P K. Plant oils as fuels for compression ignition engines: A technical review and life-cycle analysis. Renewable Energy, 2010; 35: 1–13. [31] Ramadhas A S, Jayaraj S, Muraleedharan C. Use of
vegetable oils as I.C. engine fuels - A review. Renewable Energy, 2004; 29: 727–742.
[32] Sahoo P K, Das L M, Babu M K G, Arora P, Singh V P, Kumar N R, et al. Comparative evaluation of performance and emission characteristics of jatropha, karanja and polanga based biodiesel as fuel in a tractor engine. Fuel, 2009; 88: 1698–1707
[33] Mustafa C, Eradil A, Arcaklioglu E. Performance and exhaust emissions of a biodiesel engine. Applied Energy, 2006; 83: 594–605.