CODEN [USA]: IAJPBB ISSN: 2349-7750
I
INNDDOOAAMMEERRIICCAANNJJOOUURRNNAALLOOFF
P
P
H
H
A
A
R
R
M
M
A
A
C
C
E
E
U
U
T
T
I
I
C
C
A
A
L
L
S
S
C
C
I
I
E
E
N
N
C
C
E
E
S
S
http://doi.org/10.5281/zenodo.837292
Available online at: http://www.iajps.com Research Article
METHOD DEVELOPMENT AND VALIDATION OF NEW
RP-HPLC METHOD FOR THE ESTIMATION OF PAROXETINE
IN PHARMACEUTICAL DOSAGE FORM
P. Hari Sravanth Reddy
*, Anusha Kota, Syed Muneer
Department of Pharmaceutical Analysis & Quality Assurance, K.C.Reddy Institute of
Pharmaceutical Sciences, Jangamguntla Palem (Vill.), Medikondur (Mandal),
Guntur-522438, A.P, India
.
Abstract:
Present study aims to develop rapid, greater sensitivity and faster elution by RP-HPLC method for the estimation of Paroxetine. The developed method will be validated in terms of accuracy, precision, linearity,
robustness and ruggedness, and results will be validated statistically according to ICH guidelines. The scope of
developing and validating analytical methods is to ensure suitable methods for a particular analyte of more specific, accurate, precise and robust. The main objective for this is to improve the conditions and parameters, which should be followed in the development and validation. The existing physicochemical methods are inadequate to meet the requirements, hence it is proposed to improve the existing methods and to develop new methods for the assay of Paroxetine.in pharmaceutical dosage forms adapting different available analytical techniques like HPLC.
Keywords:Paroxetine, RP-HPLC, Method Development, Chromatographic Conditions, ICH guidelines
Corresponding Author:
P.Hari Sravanth Reddy,
Department of Pharmaceutical Analysis & Quality Assurance,
K.C.Reddy Institute of Pharmaceutical Sciences,
Jangamguntla Palem (V), Medikondur (Md),
Guntur-522438, A.P, India
.
E-Mail: harisravant [email protected]
Please cite this article in press as P.Hari Sravanth Reddy et al, Method Development and Validation of New RP-HPLC Method for the Estimation of Paroxetine in Pharmaceutical Dosage Form, Indo Am. J. P. Sci,
2017; 4(07).
INTRODUCTION:
HPLC is a modern technique, it is a much more reliable and reproducible method for the standardization of both single and compound formulations. HPLC is a separation technique based on a stationary phase and a liquid mobile phase. Separations are achieved by partition, adsorption or ion exchange process, depending upon the size of stationary phase used1, 2.
HPLC is one of the most versatile instruments used in the field of pharmaceutical analysis. It provides the following features2 ,3:
High resolving power
Continuous monitoring of the
column effluent
Accurate quantitative
measurement
Repetitive and reproducible
analysis using the same column
Automation of the analytical
procedure and data handling
TYPES OF MODES IN HPLC3, 4
It includes
Based On Modes Of Separation:
Normal Phase Chromatography
Reverse Phase Chromatography Based On Principle Of Separation: Adsorption Chromatography
Ion exchange Chromatography
Size exclusion Chromatography
Affinity Chromatography
Chiral phase Chromatography Based On Elution Technique:
Isocratic separation
Gradient separationNormal Phase Chromatography 5, 6
The term normal phase refers to a system where the stationary phase is a polar and mobile phase is a relatively non-polar liquid (Hexane, benzene, CHCl3, etc). In this mode most probably used
stationary phase is silica gel.
Reverse-Phase Chromatography 6, 7
Reversed-phase chromatography refers to the use of a polar eluent with a non-polar stationary phase in contrast to normal-phase chromatography, where a polar stationary phase is employed with a non-polar mobile phase.
Development of RP- HPLC Method7, 8
HPLC currently accounts for 35% of all instrument usage across the pharmaceutical and cosmetic industries and remains the fastest growing
technique in both industries. HPLC provides reliable quantitative precision and accuracy, along with a linear dynamic range sufficient to allow for the determination of the Active Pharmaceutical Ingredient (API) and related substances in the same run using a variety of detectors along with excellent reproducibility and is applicable to a wide array of compound types by judicious choice of HPLC column chemistry. Major modes of HPLC include reverse phase and normal phase.
2. DRUG PROFILE PAROXETINE Structure:
Chemical Name: 4-tert-butyl-N-[6-(2-hydroxyethoxy)-5-(2-methoxyphenoxy)-2-
(pyrimidin- 2-yl) pyrimidin-4-yl] benzene-1-sulfonamide
Molecular formula : C27H29N5O6S Molecular weight : 551.614 Dose : 125mg
Description : Paroxetine is a white to yellowish powder, In the solid state, Paroxetine is very stable, is not hygroscopic and is not light Sensitive.
Solubility : Methanol Melting point : 107-110 °C Mechanism of Action:
Paroxetine is a dual endothelin receptor antagonist. Endothelin-1 (ET-1) is a neurohormone, and a potent vasoconstrictor with the ability to promote fibrosis, cell proliferation and tissue remodeling.The effects of which are mediated by binding to ETA and ET B receptors in the endothelium and vascular smooth muscle. ET-1 concentrations are elevated in plasma and lung tissue of patients with pulmonary arterial hypertension, suggesting a pathogenic role for ET-1 in this disease. Paroxetine exerts a specific and competitive antagonist at endothelin receptor types ETA and ETB, with a slightly higher affinity for ETA than ETB receptors. Paroxetine decreases both pulmonaryand systemic vascular resistance resulting in increased cardiac output without increasing heart rate.
MATERIALS AND METHODS:
Table1: Shows Chemicals And Reagents
S. No. Chemicals/standards and reagents Grade Make
1 Potassium dihydrogen phosphate HPLC Fisher
2 Ortho phosphoric acid HPLC Fisher
3 HPLC Grade Methanol HPLC Merck
4 HPLC Grade Acetonitrile HPLC Merck
5 Double Distilled Water HPLC Merck
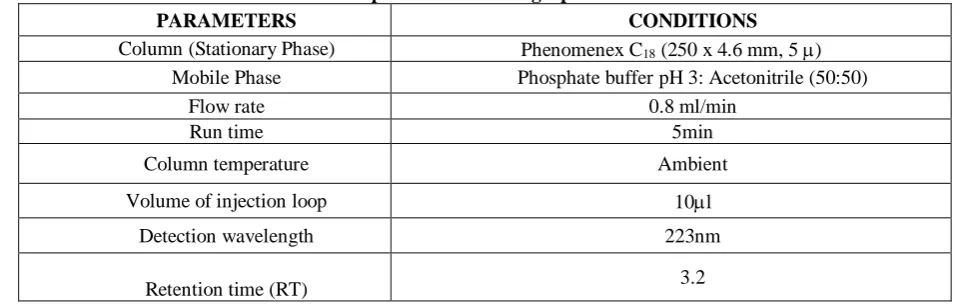
Table 2: Optimized chromatographic conditions
PARAMETERS CONDITIONS
Column (Stationary Phase) Phenomenex C18 (250 x 4.6 mm, 5 )
Mobile Phase Phosphate buffer pH 3: Acetonitrile (50:50)
Flow rate 0.8 ml/min
Run time 5min
Column temperature Ambient
Volume of injection loop 10l
Detection wavelength 223nm
Retention time (RT) 3.2
Optimized Method
Preparation of Phosphate buffer:
Accurately weighed and placed 2.72gm of potassium dihydrogen phosphate in 1000 ml of volumetric flask. Add about 900 ml of water and sonicate and make up to the final volume with ml of water, adjust pH to 3 with dilute Orthophosphoric acid solution.
Preparation of mobile phase:
A mixture of pH 3 phosphate buffer 500 ml (50 %) and Acetonitrile 500 ml (50 %) were mixed well, degassed in a Sonicator for about 10 minutes and filtered through 0.45 µ Millipore nylon filter.
Diluent Preparation:
HPLC grade Methanol was used as diluent.
RESULTS AND DISCUSSION:
Table 3: Data of Trails of Paroxetine
Table 4: Data of Assay of Standard Chromatograms Trail
No.
Mobile phase composition Retention time Paroxetine Theoretical plates Paroxetine Tailing factor Paroxetine Inference
1. Phosphate Buffer pH 3: Methanol (60:40) (V/V)
3.315 2282 1.3 low plate count and splitting
of peaks 2. Phosphate Buffer pH 3:
Methanol (70:30) (V/V)
3.157 2156 1.3 low plate count and
splitting of peaks 3. Phosphate Buffer pH 3:
Methanol (80:20) (V/V)
3.148 3013 1.2 Low Rt and high tailing
factor 4. Phosphate Buffer pH 3:
Acetonitrile (70:30) (V/V)
2.807 4670 1.1 Low Rt and low tailing
factor 5 Phosphate Buffer pH 3:
Acetonitrile (50:50) (V/V)
3.240 2897 1.2 optimized
Injection Peak name Retention time Peak area USP plate count
USP tailing
1. Paroxetine 3.25 509034 4196 1.17
2. Paroxetine 3.26 516539 4101 1.15
3. Paroxetine 3.23 511787 4131 1.17
Mean
512453 Standard
deviation 3796.61
% RSD
Table 5: Data of Assay of Sample Chromatograms
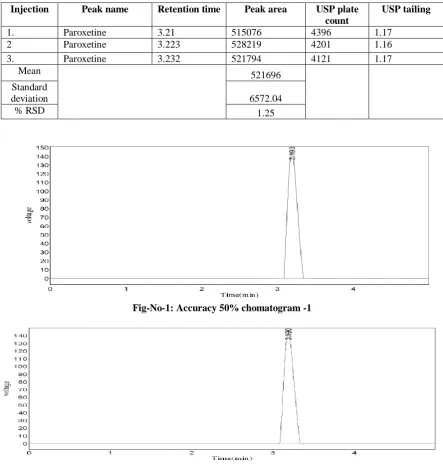
Fig-No-1: Accuracy 50% chomatogram -1
Fig-No-2: Accuracy 50 % Chromatogram-2
Fig-No-3: Accuracy 50 % Chromatogram -3
Injection Peak name Retention time Peak area USP plate count
USP tailing
1. Paroxetine 3.21 515076 4396 1.17
2 Paroxetine 3.223 528219 4201 1.16
3. Paroxetine 3.232 521794 4121 1.17
Mean 521696
Standard
deviation 6572.04
Fig-No-4: Accuracy 100 % Chromatogram -1
Fig-No-5: Accuracy 100 % Chromatogram -2
Fig-No-6: Accuracy 100 % Chromatogram -3
Fig-No-8: Accuracy 150 % chromatogram -2
Fig-No-9: Accuracy 150 % chromatogram -3
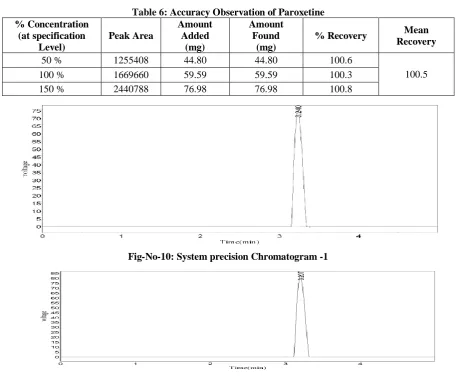
Table 6: Accuracy Observation of Paroxetine % Concentration
(at specification Level)
Peak Area
Amount Added
(mg)
Amount Found
(mg)
% Recovery Mean Recovery
50 % 1255408 44.80 44.80 100.6
100.5
100 % 1669660 59.59 59.59 100.3
150 % 2440788 76.98 76.98 100.8
Fig-No-10: System precision Chromatogram -1
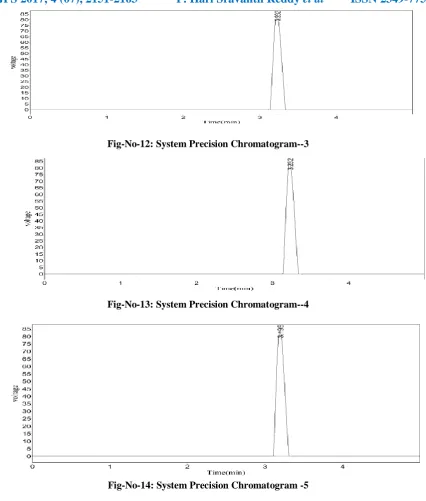
Fig-No-12: System Precision Chromatogram--3
Fig-No-13: System Precision Chromatogram--4
Fig-No-14: System Precision Chromatogram -5
Table 7: Observation of System Precision INJECTION PAROXETINE AREA
Injection1 590927
Injection2 587426
Injection3 589286
Injection4 587964
Injection5 584481
Average 588006
Standard Deviation
2417.9
Fig-No-15: Linearity Chromatogram -1
Fig-No-16: Linearity Chromatogram -2
Fig-No-17: Linearity Chromatogram -3
Fig-No-19: Calibration Curve for Paroxetine
Table 8:
Linearity Observation of Paroxetine:
Fig 20: Actual flow rate Chromatogram-1
(0.8 ml/Min)
S.No Level Concentration Retention time (min) Peak Area
1 I 10 µg/ml 3.215 221885
2 II 20 µg/ml 3.223 544528
3 III 30 µg/ml 3.232 820567
4 IV 40 µg/ml 3.090 1204657
5 V 50 µg/ml 3.182 1541189
Slope 32987
Intercept 11905
Fig 21: Less flow rate Chromatogram
(0.7 ml/min)
Fig 22: More flow rate Chromatogram (0.9 ml/min)
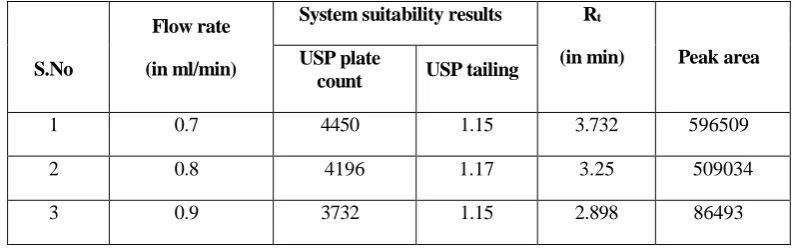
Table 9:
Flow Rate Observation of ParoxetineS.No
Flow rate
(in ml/min)
System suitability results Rt
(in min) Peak area USP plate
count USP tailing
1 0.7 4450 1.15 3.732 596509
2 0.8 4196 1.17 3.25 509034
Fig 23: Actual Mobile Phase Chromatogram-1 (Buffer pH 3: Acetonitrile (60:40))
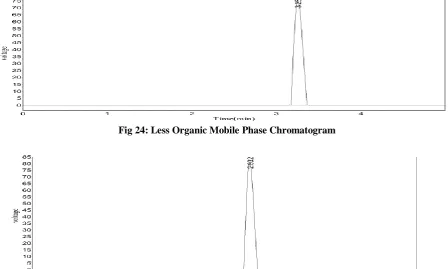
Fig 24: Less Organic Mobile Phase Chromatogram
Fig 25: More Organic Mobile Phase Chromatogram
Table 10: Mobile Phase Change Observation of Paroxetine
S.No
Flow rate (in ml/min)
System suitability results Rt
(in min) Peak area USP plate
count USP tailing
Table 11: Observation of System Suitability Parameters
S. No Parameter Paroxetine
1 Retention time 3.25
2 Theoretical plates 4196
3 Tailing factor 1.17
4 Area 509034
5 Resolution 3.23
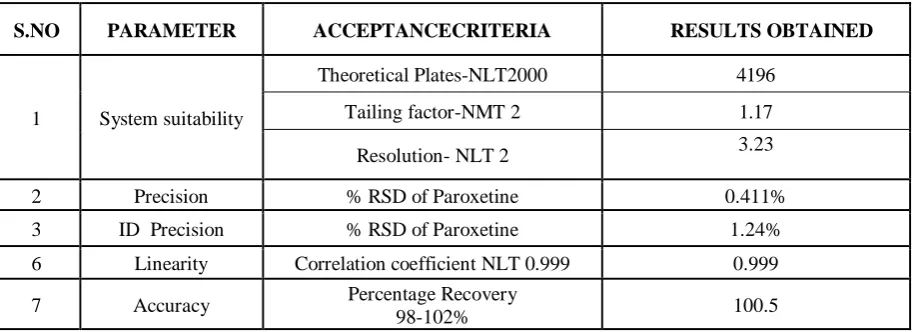
Table 12: summary for RP-HPLC method
CONCLUSION:
The proposed HPLC method was found to be specific, precise, accurate, rapid and economical for simultaneous estimation of Paroxetine in Pharmaceutical dosage form. The developed method was validated in terms of accuracy, precision, linearity, robustness and ruggedness and results will be validated statistically according to ICH guidelines. The sample recoveries in all formulations were in good agreement with their respective Label Claims and this method can be used for routine Analysis.
REFERENCES:
1.R. Snyder, J. Kirkland, L. Glajch. Practical HPLC method development, 1997, II Ed, A Wiley International publication, PP 235,266-268,351-353.653-600.686-695.
2.Method validation guidelines International Conference on harmonization; GENEVA; 1996. 3.International Conference on Harmonization (ICH) Topic Q2A, Validation of Analytical Procedures; Methodology, CPMP / ICH /281, 1995.
4.Wolff ME (Ed.), Burger’s Medicinal Chemistry and Drug Discovery vol. 2, Therapeutic Agents, fifth ed., Wiley, New York, Chichester, Toronto, 1996, chapter 27.
5.K.K Pandya, V. D. Mody, M.C. Satia, I.A. Modi, R.I. Modi, B.K. Chakravarthy, T.P. Gandhi, J. Chrom. B. Biomed. App., 693,199 (1997).
6.Dandiya PC, Kilkarni SK. Introduction to Pharmacology, 7th Ed, Vallabh Prakashan, Delhi 2008, p. 265.
7.Analysis Profile of Drugs Substances, Paroxetine drug bank.
8.Chen X, Ji ZL, Chen YZ: TTD: Therapeutic Target Database. Nucleic Acids Res. 2002 Jan 1;30(1):412-5.
S.NO PARAMETER ACCEPTANCECRITERIA RESULTS OBTAINED
1 System suitability
Theoretical Plates-NLT2000 4196
Tailing factor-NMT 2 1.17
Resolution- NLT 2 3.23
2 Precision % RSD of Paroxetine 0.411%
3 ID Precision % RSD of Paroxetine 1.24%
6 Linearity Correlation coefficient NLT 0.999 0.999
7 Accuracy Percentage Recovery