ISSN 2229-760X (Print) ISSN 2319-7625 (Online) Journal of Chemistry and Chemical Sciences, Vol.6(4), 406-417, April 2016
(An International Research Journal), www.chemistry-journal.org
Pyrolysis of Post Consumer Polyethene Waste and
Composition Analysis for Pyrolysis Fuel Oils
and Solid Residue
Jane Njoki Mburu1, Paul Njogu Mwangi2 and Jackson Wachira Muthengia3
1,2Institute of Energy and Environmental Technology,
Jomo Kenyatta University of Agriculture and Technology,
P.O. Box 62000- 00200NAIROBI, KENYA
email: [email protected] 3Embu University College,
School of Pure and Applied Sciences, P.O. 6-60100, EMBU KENYA.
(Received on: April 26, 2016)
ABSTRACT
Kenya faces a big challenge on management of post consumer plastic waste (PCPW) as it contributes to large amounts in the Municipal solid waste (MSW). In this study, pyrolysis process was used to convert (PCPW) into fuel oils. Physical-chemical composition analysis of the resulting products was conducted. Low Density Polythene (LDPE), High Density polythene (HDPE) and Polypropylene (PP) samples were separately heated in a locally assembled batch pyrolysis reactor at temperatures ranging between 200-350 °C and with heating rate of 5-°C /minute. The resulting gases were condensed into liquid oils and collected in glass jars. The incondensable gases were flared and the char recovered. Fractionation was conducted to partition the crude into petrol and diesel fractions at 150 oC and 350 oC respectively. Characterization of pyrolysis oils was conducted
using the Fourier Transform Infrared (FTIR) Spectrometer instrument from Bruker. Elemental composition analysis of solid residue was done using X- ray fluorescence (XRF) technique. The results in this study indicate that HDPE, LDPE and PP are potential waste materials for making diesel oils with high energy values.
Keywords: Pyrolysis; PCPW, petrol, diesel.
1. INTRODUCTION
cases non biodegradable (McMurry, 2000). The society of plastics industries (SPI) established identification resin codes that classify plastics into 7 different types (Haslam and Willis, 1965). These are; Polyethylene terephthalate (PETE), Low Density Polyethylene (LDPE), Polyvinyl chloride (PVC), High Density Polyethylene (HDPE), Polypropylene (PP), Polystyrene (PS) and Other plastics (Qiao-fen, 2000).
Demand for plastics has continued growing in the recent years. Plastics have found various applications as packaging materials, storage tanks, insulating electric cables, pipes among others (Andrady and Neal, 2009a). The world’s plastic demand is currently over 14.5 million tons per annum with only 50% of this waste getting recycled (Andrady and Neal, 2009c). Poor management of post consumer plastic waste (PCPW) has resulted into littering, accumulation and fragmentation in the environment (Thompson et al., 2009b). Common practices of plastic waste disposal include incineration, open burning and disposal into landfills (Hopewell et al., 2009). These practices present challenges as some lead to the release of green house gasses (GHG’s) that cause global warming (Lithner et al., 2011), also the emission of persistent organic pollutants (POP’S) that have been found to be carcinogenic (Wade, 2000). In some cases the waste accumulates and peals up in landfills thus become a health hazard, contaminates ground water and cause chocking of the soil (Barnes et al., 2009)
Pyrolysis technology is a potential method of recovering petrochemical fuel products from plastics waste (Kiran et al., 2000). During Pyrolysis process, plastics undergo thermo decomposition at elevated temperatures and in complete absence of air to produce fuel gas, oils and solid residue (Demirbas, 2004). Thermo decomposition process involves cracking of long polymer chains of hydrocarbons (Miskolczi et al., 2006). This takes place through three progressive chemical decomposition mechanisms. These are end-chain scission, random-chain scission and random-chain stripping (Mlynková et al., 2008). During this process, chemical bonds of the main polymer brake into shorter polymer chains(Encinar and Gonzalez, 2008). In some cases fragments having low molecular weight are formed and result to products such as incondensable fuel gasses and oils (Demirbaş, 2005).
2. METHODOLOGY
2.1 Sample collection and preparation
Samples of LDPE, HDPE and PP wastes were collected from the open dumpsites in Nairobi Kenya during the months of May and August 2015. These were washed with water and detergent and sun-dried. Samples were sorted out according to resin codes developed by the Society of Plastic Industries (SPI)(Haslam and Willis, 1965). The samples were sliced and pelletized into small pieces of dimensions of 2 mm and stored in precleaned polyethene bags.
2.2 Pyrolytic Reactor design
Jane Njoki Mburu, et al., J. Chem. & Cheml. Sci. Vol.6(4), 406-417 (2016)
T T
FM
codensation
codensed oil
storage tank
gas scrabbing
plastic + catalyst
N2 gas incondesible gases
packed column
crude oil
clean gas recycled
heating electric coil
Pyrolytic reactor
Temperature probe
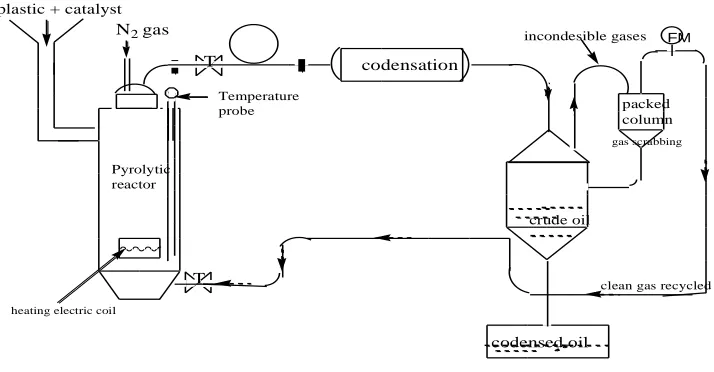
Figure 1: A schematic representation of the pyrolysis reactor
2.3 Pyrolytic conversion of HDPE, LDPE and PP waste plastics
Plastic sample pellets in batches of 500 g were introduced in the pre-warmed reactor at 200 °C. Nitrogen gas was purged into the reactor at a flow rate of 2 L/min to expel any oxygen present. The reactor was heated within temperatures ranging between 200 and 350 °C and at a heating rate of 5 °C /minute. The incondensable gases and oil vapors produced from the reactor were evacuated using the outlet tube system as shown in Fig. 1. The gases and oil vapors were passed through a water based condensation chamber that was maintained at room temperature. The oil vapors were condensed into crude oil that was weighed after each run of the experiment then stored in appropriate glass bottles and stored away from sunlight. The incondensable gases were flared. Solid residues were formed at the bottom of the reactor as byproducts of the plastic pyrolysis process. The solid residues generated after each run of the experiment were collected at room temperatures and weighed. These were stored in precleaned containers. The process was done in triplicates.
2.4 Fractional distillation of crude oil
Upgrading of the crude oil was done using a Buchi Rotary Evaporator model R- 200 fractionating column form Swaziland. Fifty (50) ml aliquots of the crude oil were transferred into a 1 L round bottomed flask and heated within temperature range of 150 to 350 °C. Petrol and diesel were recovered in separate volumetric flasks at temperatures of <150 °C and <350 °C respectively.
Flash Points
petrol sample was put in a boiling tube and placed on a sand bath. Thermometer probe was inserted in the boiling tube. The sand bath was steadily heated at a rate of 5 °C/min while holding a burning lighting-stick over the open end of the boiling tube. The temperature at which the petrol fumes caught fire with a continuous flame was recorded as the flash point of the petrol. Similar procedure was repeated for the diesel samples and the obtained results were recorded.
Density
The density for pyrolysis petrol and diesel was determined using a hydrometer according to the reference method D 1298-99. (ASTM, 1999). In the test, 30 ml of petrol sample was brought to temperature of 25 ºC. The sample was transferred into a 50 ml cylinder. A hydrometer was lowed into petrol sample and allowed to settle. After attaining stable temperature equilibrium, the hydrometer scale was read and the temperature of the sample was noted. The above procedure was repeated for diesel samples. The experiment was done in triplicates to obtain an accurate reading.
2.5 Calorific Value
Jane Njoki Mburu, et al., J. Chem. & Cheml. Sci. Vol.6(4), 406-417 (2016)
therefore = (6.32 w1 kcal/g) / (O2 – O1 ) = Y. When calculated the value of (Y) was 6.6526. The standardizing test was repeated five times and the average value (Y) of calibration constant was obtained.
Mass of sample was = Z grams, Galvanometer deflection with sample was = O3. Therefore galvanometer deflection due to sample was = (O3 - O1). Heat release from sample was = (O3 – O1) × Y kcal. Therefore calorific value of sample was calculated as = (O3 – O1) × Y/Z kcal/g.
Figure 2: Calorific value analysis for oil samples Figure 3: FTIR Spectrometry from Bruker using Gallenkamp Ballistic bomb calorimeter
2.6 Chemical composition analysis for pyrolysis oil using the Fourier Transform Infrared (FTIR) Spectrometer
Qualitative analysis for the pyrolysis oil samples was done using an FTIR Spectrometer model Alpha 1005 4238 from Bruker as shown in Fig. 3. The analysis was carried out in accordance to the test method D 7624-10 (ASTM D7624-10, 2010). The instrument was calibrated as explained in equipment manual (ABB. FT-IR., 2003). Petrol and Diesel oil samples were prepared for analysis by dissolving in carbon tetrachloride (CCl4) to form 10% solution. A series of standards were prepared in CCl4 to form (0, 2, 4, 6, 8, 10) %.solutions respectively. The standard solutions were injected into an FTIR liquid cell for measurement. Background spectrum of the solvent used was obtained and subtracted away from the standard and sample spectrums. The samples were analyzed in triplicates in the same manner and spectrums obtained. Correlation of the absorption bands obtained in the spectrum of the sample (unknown compound) with that of the known was used for data interpretation. Sample results were subjected to calibration curves for quantification.
2.7 XRF Elemental Composition Analysis for Solid Residue from HDPE, LDPE and PP.
characteristic X rays of the elements analyzed were detected by the spectrometer. The measured X ray intensities were directly proportional to the concentration range of elements present. The results were obtained in mg/kg. All samples were analyzed in triplicates. These analyses were conducted in the XRF Laboratory of the ministry of mining in Nairobi.
3. RESULTS AND DISCUSSION
3.1 Physical-chemical properties of pyrolysis oils
The concentrations, densities and flash points for petrol and diesel pyrolysis oils recovered from HDPE, LDPE and PP were assessed. Results presented in Table 1a show that, diesel oil concentration levels are varying. Diesel oil from HDPE has the highest concentration. The difference in concentration levels can be attributed to the possible reactions occurring during pyrolysis process. The reactions include; dehydrogenation, isomerization of normal paraffins to form isoparaffins and dehydrocyclization reaction that causes aromatization. Similar observations were made by (Demirbaş, 2005; Kyong, 2012; Walendziewski and Steininger, 2001). The authors however were working with PET bottles and HDPE.
It is observed that pyrolysis petrol samples have low density while that of diesel oils is higher in comparison to conventional fuels. This high density in pyrolysis diesel oils can be attributed to the heavy hydrocarbon molecules present in the products chemical composition. Chemical bonds break depending on the molecular structure of the polymer. Thermal stability of LDPE polymer is highly affected by branching. This applies to PP polymer as well due to the presence of a methyl group in the tertiary position. Therefore LDPE and PP undergo thermal decomposition during pyrolysis to produce higher fractions of low molecular weight (MW) products. However HDPE chain is more stable and will undergo cross linking to produce higher fractions of high MW products such as diesel. This affects the property of diesel oil produced. Similar observation was made by (Saha and Ghoshal, 2005). The author was working with PET soft drinks bottles.
Results show that the flash points for pyrolysis petrol oils are low as compared to commercially sold petrol. The low flash points are attributed to the presence of large proportions of light weight hydrocarbons that are easily volatilized. Similar observations were made by other researchers (Bouster et al., 1989; Lee and Shin, 2007). The authours were however using and PS waste plastic mixtures respectively.
Table 1a: Physical-chemical results of pyrolysis oils
Sample % Conc. Density (g/cm3 ) Flash Point (1 °C)
PP Super petrol 63.33±0.29 0.62±0.03 39 ± 1.15 PP Diesel 94.52±0.15 0.82±0.01 142 ± 0.58 LDPE Supper petrol 62.38±0.16 0.61±0.02 39 ± 0.58 LDPE Diesel 99.28±0.06 0.85±0.01 144 ± 1.53 HDPE Super petrol 62.67±0.76 0.64±0.01 40 ± 1.103 HDPE Diesel 99.41±0.06 0.86±0.01 146 ± 1.21
Super petrol 100 0.78±0.01 43±1.15
Jane Njoki Mburu, et al., J. Chem. & Cheml. Sci. Vol.6(4), 406-417 (2016)
From Table 1b, it is observed that the boiling range of petrol pyrolysis oils was in the range between 1-198 ºC. This lies within the boiling range of the commercially sold petrol. This is attributed to the presence of hydrocarbons such as paraffins, olefins, and aromatics that have (4–12) carbon atoms in their molecular structure. Pyrolysis diesel has boiling range between 172- 328 ºC. This is attributed to the presence of hydrocarbons that have carbon chains with 12 to 24 carbon atoms in their molecular structure as was confirmed by other researchers (Murty, 1996; Williams and Slaney, 2007). The authors observed that pyrolysis products from PE, PP, and PS have properties that match petrol and diesel.
The results in Table 1b indicate that calorific values for both pyrolysis petrol and diesel oils are in the range of conventional/petroleum fuels. The chemical composition of HDPE, LDPE and PP constitutes hydrocarbons just as conventional petroleum fuels. During pyrolysis, the plastics are converted into petroleum oils having high energy values within the range of liquefied petroleum gas, petrol and diesel. Similar observations were made by other researchers (Aboulkas et al., 2010; Ciliz and Ekinci, 2004; Demirbas, 2004). The authors obtained diesel, petrol and combustible gases at temperature ranges of 380 – 650 ºC. The authors observed that the quality of plastic pyrolysis oils was dependent on the chemical composition of plastic feedstock used. In most cases, waste plastics are possibly contaminated before they get recycled. This has effect on the value of oil products formed.
3.2 Chemical composition analysis results for pyrolysis petrol and diesel oils
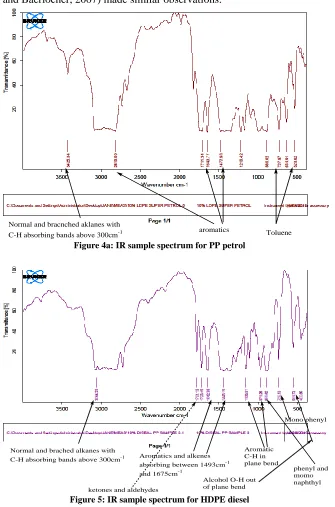
Chemical composition analysis for pyrolysis petrol and diesel oils was carried out in accordance to American Standard Test Method D7624-10, (ASTM D7624-10, 2010). The results obtained are as shown in Figure 4 and 5. As observed in the IR spectrum in Figure 4, absorbing groups such as; the normal and branched alkanes (parafins), alkenes (olefins) and aromatics are confirmed to be present in pyrolysis petrol samples.
From Figure 5, the results show that pyrolysis diesel oil has ketones, aldehydes, napthenes and high fractions of aromatics during pyrolysis, an extensive chemical change takes place as the hydrocarbon chains crack into free radicals and smaller hydrocarbon fragments. The free radicals and molecular spices formed undergo reactions such as; dehydrogenation, isomerization and dehydrocyclization. During dehydrogenation for example, a hydrogen molecule is removed from a napthene to from toluene. isomerization of normal paraffins (a napthene) can occur to form isoparaffins (toluene). Dehydrocyclization
Sample Calorific
Value (MJ/Nm3)
Boiling range °C
1st Distillation temp (°C)
Last distillation temp (°C)
PP Super petrol 41.97±0.12 1-197 83±0.7 149±0.5
PP Diesel 46.04±0.05 172-321 223±0.5 348±1.2
LDPE Supper petrol 41.84±0.08 1-197 85±0.58 148±1.2
LDPE Diesel 46.10±0.02 173-320 223±0.5 349±1.3
HDPE Super petrol 41.91±0.11 1-198 86±1.15 149±0.5
HDPE Diesel 46.30±0.03 176-328 228±1.1 348±0.5
Super petrol 44.0±0.01 1-216 53±0.5 149±1.0
for example can occur to form toluenes from normal heptanes. Authors (Maesen, 2007; McCusker and Baerlocher, 2007) made similar observations.
aromatics Toluene Normal and bracnched aklanes with
C-H absorbing bands above 300cm-1
Figure 4a: IR sample spectrum for PP petrol
Normal and brached alkanes with
C-H absorbing bands above 300cm-1 Aromatics and alkenes absorbing between 1493cm-1
and 1675cm-1
Mono phenyl
phenyl and momo naphthyl Aromatic
C-H in plane bend Alcohol O-H out of plane bend ketones and aldehydes
Jane Njoki Mburu, et al., J. Chem. & Cheml. Sci. Vol.6(4), 406-417 (2016)
3.3 XRF Elemental composition analysis for solid residue from HDPE, LDPE and PP
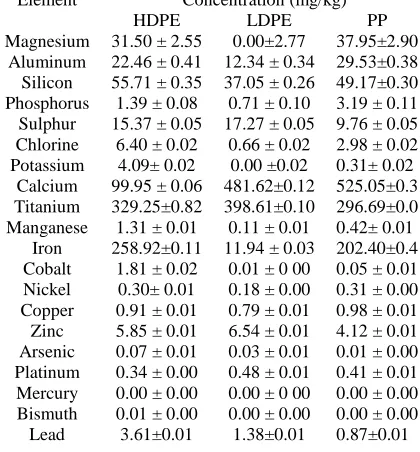
Elemental composition results for HDPE, LDPE and PP are as presented in Table 5. Calcium, Aluminum, Silicon and Barium are in high amounts in all plastic residue analyzed. This can be attributed to inorganic fillers such as Carbon, Calcium carbonate, Silica and Barium sulphate added to plastics by manufactures. The fillers help to improve on plastic properties such as hardness, rigidity, performance, ageing properties and generally lower production cost (Sain et al., 2004; Thompson et al., 2009c; Zweifel, 2001). Silicon oil is also used as an additive to improve on surface properties. Aluminum oxide and magnesium oxide are used as flame retardants thus reduce flammability of the end product. Similar observations were made by (Andrady and Neal, 2009b; Sain et al., 2004; Zweifel, 2001). The authors however were working with mixtures of HDPE, LDPE, PS, PET and PP. The results indicate that plastics are potential sources of Calcium, Aluminum and Silicon elements. The elements can be used as catalysts when converted into metal oxides.
Table 5 a: XRF percentage composition results for HDPE, LDPE and PP
Results show that HDPE, LDPE and PP have high concentrations of Iron and titanium. This is attributed to Iron oxide and Titanium oxide additives used by manufactures to improve on the appearance of plastic material end products. Authors (Sain et al., 2004; Simoneit et al., 2005; Thompson et al., 2009a) made similar observations. The authors conducted thermo pyrolysis under atmospheric pressure and at temperature ranges of 450 - 500 ºC. The authors however were working with a mixture of HDPE, LDPE, PS, PET and PP.
Element Concentration (mg/kg)
HDPE LDPE PP
Magnesium 31.50 ± 2.55 0.00±2.77 37.95±2.90 Aluminum 22.46 ± 0.41 12.34 ± 0.34 29.53±0.38 Silicon 55.71 ± 0.35 37.05 ± 0.26 49.17±0.30 Phosphorus 1.39 ± 0.08 0.71 ± 0.10 3.19 ± 0.11 Sulphur 15.37 ± 0.05 17.27 ± 0.05 9.76 ± 0.05 Chlorine 6.40 ± 0.02 0.66 ± 0.02 2.98 ± 0.02 Potassium 4.09± 0.02 0.00 ±0.02 0.31± 0.02
Calcium 99.95 ± 0.06 481.62±0.12 525.05±0.3 Titanium 329.25±0.82 398.61±0.10 296.69±0.0 Manganese 1.31 ± 0.01 0.11 ± 0.01 0.42± 0.01
It is further observed that some of the heavy metals of interest such as, Lead and Arsenic are detected in small quantities of below (120 mg/kg and 50 mg/kg) Environmental Protection Administration (EPA) recommended limits respectively. Presence of heavy metals in plastics residue is attributed to the inorganic pigments such as lead carbonate and Arsenic added to plastics as stabilizers. However, Asenic and Lead are toxic to human health even when exposed to low concentrations. These metallic elements can therefore become a potential source of contamination (through the soil- plant –human pathway) in cases where plastic residue is improperly disposed. Cadmium and Mercury are below the detection limit in the plastic solid residue samples assessed. Authors (Achilias and Karayannidis, 2004; Thompson et al., 2009c) made similar observations. The authors however were working with PP and PET only.
CONCLUSION
Pyrolysis diesel oils from HDPE, LDPE and PP were confirmed to have physical chemical properties and composition similar to conventional pump diesel. Pyrolysis petrol samples had hydrocarbon absorbing groups of parafins, olefins and aromatics while diesel had parafins, aolefins, aromatics and naphthenes. Refined fractions of petrol and diesel oils were recovered from pyrolysis oils at temperatures within the range of 150 and 350 ºC. Petrol pyrolysis oils had low flash points and densities as compared to commercially sold petrol. Solid residue obtained from plastics was confirmed to have low concentrations of lead and arsenic. These were within the acceptable limits as per the EPA environmental standards.
RECOMMENDATION
Pyrolysis technology is recommended as the best solution for management of post consumer plastic waste by converting it to diesel oil. Fractional distillation is the most preferred method for upgrading of pyrolysis oils. Establishment of small and micro scale rural industries in Kenya for energy recovery from plastics though pyrolysis technology.
ACKNOWLEDGEMENT
The authors wish to acknowledge the Research, Production and Extensions division of JKUAT for providing funding for the project. authors also acknowledge JKUAT staff members for technical assistance and their contribution to the success of this study.
REFERENCES
1. ABB. FT-IR. (2003). Analytical and Advanced Solutions 585 Charest Blvd. East, Suite 300 Québec, QC G1K 9H4, CANADA. E-mail: [email protected] www.abb.com/analytical. 2. Aboulkas, A., Harfi, K. E., & Bouadili, A. E. Thermal Degradation Behaviors of Polye-thylene and Polypropylene. Energy Conversion and Management, 51, 1363-1369 (2010). 3. Achilias, D. S., & Karayannidis, G. P. The chemical recycling of PET in the framework
Jane Njoki Mburu, et al., J. Chem. & Cheml. Sci. Vol.6(4), 406-417 (2016)
4. Andrady, A. L., & Neal, M. A. Applications and societal benefits of plastics. Phil. Trans. R. Soc, 364, 1977–1984 (2009a).
5. Andrady, A. L., & Neal, M. A. Applications and societal benefits of plastics.
Philosophical Transactions of the Royal Society of London B: Biological Sciences, 364(1526), 1977-1984 (2009).
6. Andrady, A. L., & Neal, M. A. Applications and societal benefits of plastics. .
Philosophical Transactions of the Royal Society of London B: Biological Sciences,, 364(1526), 1977-1984 (2009b).
7. ASTM D7624-10. (2010). Standard Test Method for Condition Monitouring of Nitration in-Service Petroleum and Hydrocarbon-Based Lubricants by Trend Analysis Using Fourier Transform Infrared (FT-IR) Spectrometry. Vol. 05.04. P. A. Conshohochken (Ed.) ASTM International
8. Barnes, D., Galgani, F., Thompson, R., & Barlaz, M. Accumulation and fragmentation of plastic debris in global environments. Phil. Trans. R. Soc B, 364 (2009).
9. Viable Production of Diesel From Non-Recyclable Waste Plastics, (2013).
10. Bouster, C., Vermande, P., & Veron, J. Evolution of the product yield with temperature and molecular weight in the pyrolysis of polystyrene. Journal of Analytical and Applied Pyrolysis, 15(37), 249-259 (1989).
11. Ciliz, N., & Ekinci, E. Pyrolysis of virgin and waste polypropylene and its mixtures with waste polyethylene and polystyrene. Waste Management, 24(2), 173-181 (2004).
12. Demirbas, A. Pyrolysis of municipal plastic wastes for recovery of gasoline-range hydrocarbons. Journal of Analytical and Applied Pyrolysis, 72(1), 97-102 (2004). 13. Demirbaş, A. Recovery of chemicals and gasoline-range fuels from plastic wastes via
pyrolysis. Energy Sources, 27(14), 1313-1319 (2005).
14. Encinar, J. M., & Gonzalez, J. F. Pyrolysis of synthetic polymers and plastic wastes. Kinetic study. Fuel Processing Technology, 89, 678-686 (2008).
15. Haslam, J., & Willis, H. Identification and analysis of plastics. In Identification and analysis of plastics. Van Nostrand, 483 (1965).
16. Hopewell, J., Dvorak, R., & Kosior, E. Plastics recycling: challenges and opportunities.
Philosophical Transactions of the Royal Society of London B: Biological Sciences,, 364.(1526), 2115-2126 (2009).
17. Kiran, N., Ekinci, E., & Snape, C. Recyling of plastic wastes via pyrolysis. Resources, Conservation and Recycling, 29(4), 273-283 (2000).
18. Kyong, H. L. Pyrolysis of Waste Polystyrene and High-Density Polyethylene. Material Recycling Trends and Perspectives (2012).
19. Lee, K. H., & Shin, D. H. Characteristics of liquid product from the pyrolysis of waste plastic mixture at low and high temperatures: Influence of lapse time of reaction. Waste Management,, 27(2), pp. 168-176 (2007).
21. Maesen, T. The Zeolite Scene - An Overview. Introduction to Zeolite Science and Practice. Zurich, Switzerland: Elsevier, 1(3), 1-12 (2007).
22. McCusker, L., & Baerlocher, C. Zeolite Structures. Introduction to Zeolite Science and Practice.Zurich, Switzerland: Elsevier, 2(3), 13-38 (2007).
23. McMurry, J. Organic Chemistry Vol. 5. 5 (Ed.)(pp. 172) (2000).
24. Miskolczi, N., Bartha, L., & Deák, G. Polymer Degradation and Stability. Fuel Processing Technology 91(517-526) (2006).
25. Mlynková, B., Hájeková, E., & Bajus, M. Fuel Processing Technology. Chemical Papers 89, 1047- 1055 (2008).
26. Murty, M. V. Thermal degradation/hydrogenation of commodity plastics and character-ization of their liquefaction products. Fuel Processing Technology, 49(1-3), 75-90 (1996).
27. Qiao-fen, Y. A. N. Reuse of waste plastics. Environment Protection in Petrochemical Industry, 1(40-42) (2000).
28. Saha, B., & Ghoshal, A. (2005). Thermal degradation kinetics of poly (ethyleneterephthalate) from waste soft drinks bottles. Chemical Engineering Journal, 111(1), 39-43.
29. Sain, M., Park, S. H., Suhara, F., & Law, S. Flame retardant and mechanical properties of natural fibre–PP composites containing magnesium hydroxide. Polymer Degradation and Stability, 83(2), 363-367 (2004).
30. Simoneit, B. R., Medeiros, P. M., & Didyk, B. M. Combustion products of plastics as indicators for refuse burning in the atmosphere. Environmental science & technology, 39(18), 6961-6970 (2005).
31. Thompson, R. C., Moore, C. J., Vom Saal, F. S., & Swan, S. H. Plastics, the environment and human health:. current consensus and future trends. Phil. Trans. R. Soc. B, 364, 2153–2166 (2009).
32. Thompson, R. C., Moore, C. J., Vom Saal, F. S., & Swan, S. H. Plastics, the environment and human health: current consensus and future trends. Philosophical Transactions of the Royal Society of London B: Biological Sciences,, 364(1526), 2153-2166 (2009). 33. Thompson, R. C., Swan, S. H., Moore, C. J., & Vom Saal, F. S. Our plastic age.
Philosophical Transactions of the Royal Society of London B: Biological Sciences, 364(1526), 1973-1976 (2009).
34. Wade, M. G. Human health and exposure to chemicals which disrupt estrogen, androgen and thyroid hormone physiology. Establishing a National Agenda on the Scientific Assessment of Endocrine Disrupting Substances, 83–101 (2000).
35. Walendziewski, J., & Steininger, M. Thermal and Catalytic Conversion of Waste Polyolefin. Catalysis Today, 65, 323-330 (2001).
36. Williams, P., & Slaney, E. Analysis of products from the pyrolysis and liquefaction of single plastics and waste plastic mixtures. Resources,Conservation and Recycling,, 51(4), pp. 754-769 (2007).