1
EXPERIMENTAL COOLER BOX PERFORMANCE USING TWO
DIFFERENT HEAT REMOVAL UNITS: A HEAT SINK FIN-FAN, AND A
DOUBLE FAN HEAT PIPE
Mirmanto*, I.B. Alit, I.M.A. Sayoga, R. Sutanto, Nurchayati, A. Mulyanto
Mechanical Engineering Department, Engineering Faculty, Mataram University, Mataram, NTB, 83125, Indonesia Jl. Majapahit no. 62, Mataram, NTB, 83125, Indonesia
A
BSTRACTA comparison study of the use of two different heat removal units was conducted to examine the performance of thermoelectric cooler box. The heat removal units employed were a heat sink fin-fan and a double fan heat pipe. Parameters measured as performance indicators are cooling capacity, temperature differences, and COP. In addition, the effect of electrical power on temperature difference and COP was also investigated. The cooler box size is 285 mm x 245 mm x 200 mm and constructed from styrofoam. The results show that there is no difference of the use of a double fan heat pipe or a heat sink fin-fan on the cooler box performances. The Carnot COP decreases with the time, while the experimental COP increases with the time then it is constant after the steady condition has been achieved. Increasing the power decreases the COP but increases the temperature difference.
Keywords: Cooler box, Thermoelectric, Heat removal unit, COP
1.
INTRODUCTION
*A portable medical refrigerator is essential to carry out planned immunization, preventive injection, serum and biological preparations. Over the past years until nowadays, a small box filled with ice is commonly used for transporting/ storing fish by fishermen. Foam cotton, ice bottle, glass liner are also used as insulation materials to prevent the heat coming into/ out the storage box. Ice cream sellers using a motorbike also use styrofoam boxes filled with an ice stone to avert their ice cream melting. This manner is not easy and effective. Also, using cotton, foam and other materials to make the box at a constant temperature causes the package to be large, small volume, and high cost, etc. (Yang et al., 1991). Therefore, there is an urgent demand for such works to find a new cooler box that is portable, small power, and temperature-controlled.
To fulfil the demand, a thermoelectric cooler (TEC) box is a better choice. TEC is a new artificial refrigeration technology which is based on the Peltier effect. The cold side of the thermoelectric can be used for absorbing heat or cooling things, Abdul-Wahab et al. (2009), Rawat et al. (2013), Reddy (2016), Ananta et al. (2017). Recently, studies on TEC have been quickly developed. Although the efficiency of TEC is lower compared with traditional refrigeration, it is irreplaceable for some cases. TEC is quiet, portable, and environmentally friendly and it has a high temperature-controlling capacity, Deng (1992). Furthermore, the advantages of TEC are no leakage problem, very compact, durable, easy in maintenance, and low power, Andersen (1962), Mei et al. (1989), McNaughton et al. (1995). Hence, it is suitable to be applied to the medical field or other purposes as mentioned in the previous paragraph. Most previous work on TEC system has examined optimization and performance improvement of electronic devices by building various thermoelectric modules, Shen et al. (2013), Cai et al. (2016), Cai et al. (2017), Chen et al. (2015), Lineykin and Ben-Yaakov (2007),
*Corresponding Author Email: [email protected]
Manikandan and Kaushik (2015). However, increasing the performance of the cooler box is difficult due to low COP (coefficient of performance) of the thermoelectric module (TE). Some researchers tried to increase the performance of TE by discovering new materials, e.g. Ghoshal et al. (2002), Yang et al. (1991) and Lee et al. (2015). Nevertheless, what they did does not improve the performance much. Then Lu et al. (2014) enhanced their TE refrigeration system by applying inhomogeneous thermal conductivity materials. They elucidated that this method increased the performance of the cooling system. Moreover, Rabari et al. (2015) investigated the effect of a thermal conductivity on the performance of TE systems. They concluded that this way increased the COP. Attey (1998) increased the COP in applications. They revealed that using low thermal impedance liquid raised the COP surprisingly, and even when they applied a solid heat sink, the COP obtained was approximately ranging from 0.4-0.6, but when they utilized liquid as the heat sink, the COP leveled by of approximately 0.95-1.85. Recently Reddy et al. (2013) also performed an investigation to increase the COP of their thermoelectric cooling system. They found a significant increase in COP or performance. Yu and Wang (2009) improved TE cooling system using internally cascaded TE couples and they found the significant increase in COP. Nevertheless, most of them found that COP of TEC was still lower than 1, see also Table 1.
From the above literature or Table 1, several types of heat sink installed on the hot side of TE to remove the heat have been investigated. Nevertheless, none of them investigated the effect of the use of different heat sinks (outer heat sinks) on the cooler box performance. Meanwhile, different heat sinks have different capacity to remove heat from the hot side of TE. Although the power used to operate the cooler box is the same, but different heat sinks employed may result in different performances. Therefore, this study investigates the effect of two different outer heat sinks on the cooler box performance.
Frontiers in Heat and Mass Transfer
Table 1 COP reported in the literature
Ref. Volume
(m³)
∆T=TH –
TC (°C)
Module power (W)-number
COP Hot side system Cold side system
Abdul-Wahab et al. (2009)
0.013 22 9.5-10 0.16 Air heat sink fan,
forced flow
Air heat sink fan, forced flow
Ananta et al. (2017) 0.033 18.6 12-2 0.33 Air heat sink fan Heat sink natural flow Vian and Astrain
(2008)
0.225 11.2 50-1 0.39 Phase change
Thermosypon
Thermosypon porous media
0.225 14.67 50-1 0.29 Phase change
Thermosypon Finned heat sink Min and Rowe
(2006) 0.115 0.04 10 16 52-1 120-1 0.3-0.5 0.2 Liquid heat exchanger Liquid heat exchanger Liquid heat exchanger Finned heat sink Jugsujinda et al.
(2011)
8.3x10⁻⁵ 17.6 - 0.1 Air flow Planar heat pipe
Tan and Zhao (2015)
0.225 18.9 50-2 0.23 Thermosypon with
two phase
Thermosypon with two phase and capillary lift and cold extender
2. RESEARCH METHOD
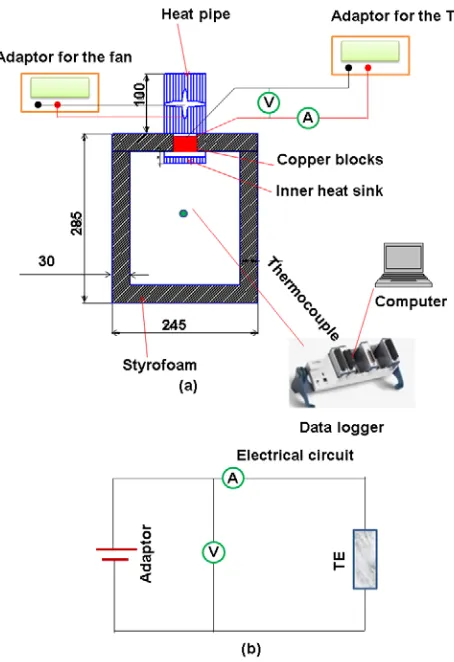
2.1 Experimental Facility and MethodThe schematic diagram of the cooler box system is shown in Fig. 1. At the beginning of the experiment, all temperatures were the same as the ambient temperature. For simplifying the cooler box model, the cooler box was made of styrofoam materials. Such cooler box is usually used by fishermen when they are fishing. However, this box can also be utilized for cooling drinking water or soft drink or even ice creams.
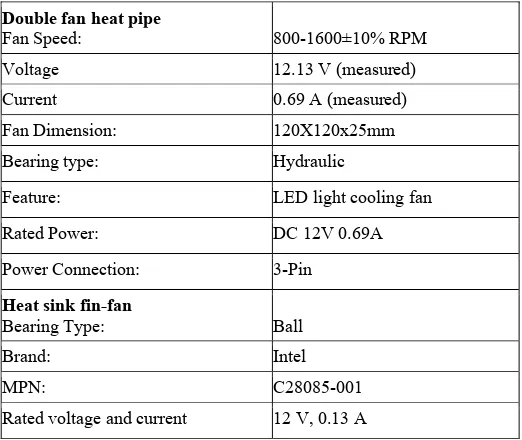
Table 2 Specifications of heat sink fin-fan and double fan heat pipe
Double fan heat pipe
Fan Speed: 800-1600±10% RPM
Voltage 12.13 V (measured)
Current 0.69 A (measured)
Fan Dimension: 120X120x25mm
Bearing type: Hydraulic
Feature: LED light cooling fan
Rated Power: DC 12V 0.69A
Power Connection: 3-Pin
Heat sink fin-fan
Bearing Type: Ball
Brand: Intel
MPN: C28085-001
Rated voltage and current 12 V, 0.13 A
All temperatures were measured using calibrated K-type thermocouples with an uncertainty of ± 0.5°C. While the power flowed to the thermoelectric was measured using a multimeter (model Professional Vichy Vc8145 Dmm Digital Bench Top Multimeter), see Fig. 2(d). The thermoelectric used was double plate thermoelectric (model TEC2-25408) as shown in Fig. 2(c). The material of the thermoelectric is ceramic (both surface), the semiconductor material (between two ceramic plates). The dimension of TE is 40 mm x 40 mm x 6.0 mm, and the TE contains 190 stacks of the P-N semiconductor junction. The rated voltage, current and power are 12-15.2 V, 8 A, and 65 W respectively. The maximum temperature difference is 80°C.
Meanwhile, the two types of the outer heat sink were heat sink fin-fan and double fan heat pipe, as shown in Fig. 2(a) and (b), and their specifications are shown in Table 2. The size of the cooler box was approximately of 285 mm x 245 mm x 200 mm, while the thickness of the box walls was 30 mm. Therefore, the volume of the cooler box is of 0.00489 m³.
Experiments were conducted using two different heat removal units, and the data were analyzed to determine the cooling capacities (QC) and
the COP. After that, the QC and COP obtained using heat sink fin-fan unit
are compared with those attained using the double fan heat pipe unit. All experiments were conducted under the same conditions. In addition, experiments investigating the effect of the thermoelectric power on the cooler box performances were also performed as additional information in this paper. The power used in this study were ranging from 1.04 W to 38.76 W, see Table 3.
Table 3 Volt, current and power tested
Tested power variable: Heat sink fin-fan
V(Volt) I(Ampere) Power (W)
1.93 0.54 1.04
5.26 1.58 8.32
8.00 2.40 19.20
8.85 2.68 23.68
10.86 2.95 38.76
Double fan heat pipe
V(Volt) I(Ampere) Power (W)
1.90 0.55 1.05
5.70 1.74 9.90
7.84 2.40 18.83
8.92 2.74 24.42
10.22 3.12 36.05
2.2 Heat Transfer Analysis
3 specific heat. The properties of the air at the atmospheric pressure can be seen in Cengel (2003).
) 1 ( ) ( ) 1 ( ) 1 ( ) 1 ( ) ( ) ( ) ( i t i t i T i p c i m i T i p c i m dt T p mc d dt dEQ (1)
Where Q is the heat transfer rate from the air (product) inside the cooler box (W), m is the product mass (kg), cp is the specific heat of the air
(product) (J/kg°C), T is the air temperature that is equal to the average temperature of the cooler box space (°C), and t is the time during the cooler box is operated (s).
Fig. 1 Schematic diagram of the experimental facility; (a) cooler box, (b) electrical circuit diagram, (c) the photograph of the test rig. Figure dimension is in mm but without scaling. TE (thermoelectric module).
x i in T i o T kA dx kAdT dt dt dx dT kA d dt dE k Q
) ( ) ( (2)The heat transfer area, the wall thickness, and the thermal conductivity do not change with the time. Tinis the inner wall temperature
(°C), To is the outer wall temperature (°C)Then the power supplied to
the thermoelectric, Pin, is evaluated as
VI in
P (3)
Where Pin is the power supplied to the thermoelectric (W), V is the
voltage (V), and I is the current (A). The cooling capacity is determined using Eq. (4). Eqs. (3) and (4) were also utilized in some papers to
calculate the power and the COP, e.g. Abdul-Wahab et al. (2009), Ananta et al. (2017), Cai et al. (2016), Wang et al. (2017).
k Q Q c
Q (4)
Then, the experimental coefficient of performance of the cooler box can be expressed as:
VI c Q in P c Q
COP (5)
Where QC is the cooling capacity (W) that is equal to the amount of the
heat absorbed by the inner heat sink and flowed toward the cold side of the thermoelectric.
Fig. 2 Heat sink; (a) heat sink fin-fan, (b) double fan heat pipe, (c) thermoelectric and (d) multimeter.
3. RESULTS AND DISCUSSION
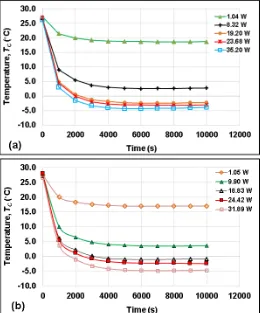
3.1 Temperatures and ∆TFig. 3 Room temperatures at several powers; (a) heat sink and fan heat removal unit (HSF), (b) double fan heat pipe (heat removal unit DFHP).
From Fig. 4, it can be seen that at the same given power, using HSF results in higher ∆T. Meanwhile, based on the theory of thermoelectric, see Eq. (5), higher ∆T at the same power reduces the cooling capacity of the TE. http://www.ferrotec- nord.com/support /choosing-thermoelectric-modules.
max
/ maxmax T T T
C Q C
Q (6)
Where Qcmax is the maximum cooling capacity (W) and ∆Tmax is the
maximum temperature difference (°C). The maximum cooling capacity is 65 (W) and the maximum temperature difference is 80°C.
Fig. 4 Effect of power on ∆T for both DFHP and HSF
3.2 Heat Transfer Rate
Heat transfer rate in this study comprises (i) heat transfer rate from the air inside the cooler box, (ii) heat transfer rate from conduction heat transfer flowing from the ambient to the cooler box room through the cooler box walls. The last heat transfer rate is seldom presented in the literature of cooling system using thermoelectric. Therefore, this is becoming the focus of this current study. To calculate the heat transfer rate from the air, Eq. (1) can be used. The results are shown in Fig. 5.
Fig. 5 Heat transfer rate from the air versus observation time; (a) HSF; (b) DFHP
In Fig. 5, heat transfer rate from the air at all powers decreases with the time but increases with the power. The decreased heat transfer rate is due to the cooler box room temperatures. The cooler box room temperatures decrease with the time and even become constant after steady conditions have been reached. At the steady condition, the heat transfer rate from the air is zero, however, the conduction heat transfer becomes dominant. The dominant heat transfer is presented in Fig. 6. Nevertheless, phenomena in Fig. 5 are obvious due to Eq. (1), but perhaps none of the above literature presented the phenomena. Therefore, the authors are persuaded to include the phenomena in this paper as a reference for further research in the use of TE for the cooler box. From Fig. 5, it is clear that the peak of the air heat transfer rate for HSF is higher than that of DFHP especially at the time of around 2000 s. However, after that, they both get constant and close to zero.
As presented in Fig. 6, the conduction heat transfer rate has different trend compared with the heat transfer rate from the air. The conduction heat transfer rate increases with the observation time. This is also due to the cooler box room temperatures. The lower cooler box temperature, the higher conduction heat transfer rate prevails. This agrees with Eq. (2). When Tin(i)gets lower while To(i) remains persistent, then Qk increases.
5 using HSF seems to be higher than that attained using the DFHP. At the power of 38.76 W for the HSF, the conduction heat transfer rate is approximately of 0.08 W, while that for the DFHP at the power of 36.05 W is approximately of 0.068 W. Meanwhile, at the lower power, the conduction heat transfer rate for HSF is almost the same as that of DFHP. Further analysis that may be able to give clear information about the use of those two different heat removal units is given in Fig. 7. Fig. 7 presents the total heat transfer rate or the cooling capacity for both HSF and DFHP at several operating powers. Here is clear that the total heat transfer rate for HSF is higher than that for DFHP. However, at the lower power such as around 1 W, the DFHP results in higher Qc.
Fig. 6Conduction heat transfer rate through the cooler box walls; (a) HSF; (b) DFHP
Fig. 7Total heat transfer rate, QC, for HSF and DFHP at several powers.
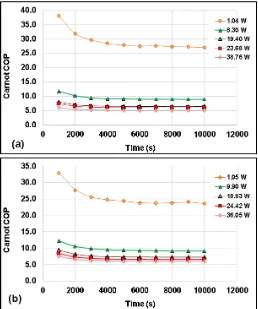
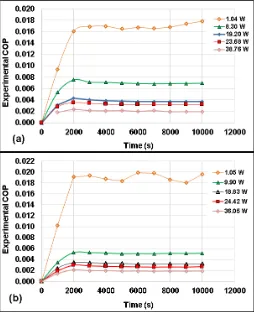
3.3 Carnot COP and Experimental COP
Figs. 8 and 9 present COP of the cooler box for both heat removal units. There are two kinds of COP that can be explored in this study. First is COP based on the Carnot refrigeration engine, Fig. 8, and the second is experimental COP based on the cooling capacity calculations, Fig. 9. From Fig. 8, it can be seen that the COP decreases with the time and then it gets constant. The trends are similar for all, even these were also found by Jugsujinda et al. (2011), Gokcek and Sahin (2017). At the lower power, the COP based on the Carnot refrigeration system for HSF is greater than that of DFHP, while at the higher power, the COP is just almost the same for both HSF and DFHP. The Carnot COP is obtained using Eq. (7).
c T H T
c T c COP
(7)
Where in Eq. (7) the temperatures are in absolute (K). This equation was used in Jugsujinda et al. (2011), Su et al. (2018). They used Eq. (7) to present their COP rather than experimental COP based on actual cooling capacities. Moreover, they did not present the conduction heat transfer rate.
Fig. 8 Relationship between Carnot COP and observation time for: (a) HSF, (b) DFHP
Fig. 9 Relationship between experimental COP and observation time for: (a) HSF, (b) DFHP
4. CONCLUSION
Experimental study on the use of two different heat removal units applied to the cooler box has been performed. The comparison of COP resulted in the use of heat sink fin-fan unit and double fan heat pipe unit has been analyzed and discussed. Some conclusion can be drawn as follows:
1. The cooler box temperature decreases with the time. 2. The heat transfer rates from the air decrease with the time. 3. The conduction heat transfer rate increases with the time then
after the steady conditions have been achieved, it is constant. 4. The Carnot COP decreases with the time, and then after a
steady condition occurs it becomes constant.
5. The experimental COP increases with the time, and then it is constant after it has been steady.
6. The effect of the heat removal unit is not clear, but when the energy consumed by the unit is considered, the heat sink fin-fan is more reliable.
ACKNOWLEDGMENTS
The authors would like to acknowledge the Mechanical Engineering Department for the facility, and thank everybody who has helped in writing this paper.
NOMENCLATURE
A heat transfer area (m²)
cp specific heat (J/kg K)
dE the change of energy (J)
dt the change of time (s)
dx the change of wall thickness (m)
I current (A)
k thermal conductivity (W/m K)
m mass (kg)
Pin input power (W)
Q heat transfer rate (W)
t time (s)
T temperature (°C)
V voltage (V)
x wall thickness (m)
Greek Symbols
∆ delta
Subscripts
C cold side
H hot side
in input
k conduction
Abbreviation
COP coefficient of performance DFHP double fan heat pipe HSF heat sink fin-fan
REFERENCES
Abdul-Wahab, S.A.A., Elkamel, A., Al-Damkhi, A.M., Al-Habsi, I.A., Al-Rubai’ey’, H.S., Al-Battashi, A.K., Al-Tamimi, A.R., Al-mamari, K.H., and Chutani, M.U., 2009, “Design and Experimental Investigation of the Portable Solar Thermoelectric Refrigerator”, Renewable Energy,
34, 30-34.
https://doi.org/10.1016/j.renene.2008.04.026
Ananta, H., Padang, Y.L., and Mirmanto, 2017, “Unjuk Kerja Kulkas Termoelektrik dengan Rangkaian Seri dan Paralel pada Beban Air 1500 ml”, Dinamika Teknik Mesin, 7(2), 80-86.
https://doi.org/10.29303/dtm.v7i2.157.
Andersen, J.R., 1962, “TE Air Conditioner for Submarine”, Adv. Energy Convers, 2, 241-244.
Attey, G.S., 1998, “Enhanced thermoelectric refrigeration system COP through low thermal impedance liquid heat transfer system”, 17th International Conference Thermoelectrics IEEE, 519-524. https://doi.org/10.1109/ICT.1998.740431
Cai, Y., Liu, D., Yang, J.J., Wang, Y., Zhao, F.Y., 2017, “Optimization of Thermoelectric Cooling System for Application in CPU Cooler”,
Energy Procedia, 105, 1644-1650. https://doi.org/10.1109/ICT.1998.740431
Cai, Y., Liu, D., Zhao, F.Y., and Tang, J.F., 2016, “Performance Analysis and Assessment of Thermoelectric Micro Cooler for Electronic Devices”, Energy Conversion and Management,124, 203-211.
https://doi.org/10.1016/j.enconman.2016.07.011
Cengel, Y.A., 2003, Heat Transfer A Practical Approach, 2nd ed., McGraw-Hill Companies, Inc., NY.
Chen, J., Yu, J., and Ma, M., 2015, “Theoretical Study on An Integrated Two–Staged Cascaded Thermoelectric Module Operating with Dual Power Sources”, Energy Convers Manage, 98, 28-33.
https://doi.org/10.1016/j.enconman.2015.03.090
Deng, X., 1992, “Thermoelectric Refrigeration and Applied Technology”, Shanghai Jiaotong University Press.
Ghoshal, U., Ghoshal, S., McDowell, C., and Shi, L., 2002, “Enhanced TE Cooling at Cold Junction Interfaces”, Applied Physics Letter, 80(16), 3006-3008.
7 Gokcek, M., and Sahin, F., 2017, “Experimental Performance Investigation of Minichannel Water Cooled-Thermoelectric Refrigerator”, Case Studies in Thermal Engineering, 10, 54-62.
http://dx.doi.org/10.1016/j.csite.2017.03.004
Jugsujinda, S., Vora-ud, A., and Seeawan, T., 2011, “Analyzing of Thermoelectric Refrigerator Performance”, Procedia Engineering, 8, 154-159.
https://doi.org/10.1016/j.proeng.2011.03.028
Lee, H.J., Anoop, G., Kim, C., Park, J.W., Choi, J., Kim, H., Kim, Y.J., Lee, E.J., Lee, S.G., Kim, Y.M., Lee, J.H., and Jo, J.Y., 2015, “Enhanced TE Performance of PEDOT: PSS/PANI-CSA Polymer Multilayer Structures”, Energy & Environmental Science, 0(1-3), 1-7.
https://doi.org/10.1039/C5EE03063C
Lineykin, S., and Ben-Yaakov, S., 2007, “User-Friendly and Intuitive Graphical Approach to the Design of Thermoelectric Cooling Systems”,
Int. J. Refrigeration, 30, 798-804.
https://doi.org/10.1016/j.ijrefrig.2006.12.004
Lu, T., Zhou, J., Li, N., Yang, R., and Li, B., 2014, “Inhomogeneous thermal conductivity enhances thermoelectric cooling”, AIP ADVANCES, 4.124501, 1-8.
http://dx.doi.org/10.1063/1.4903547
Manikandan, S., and Kaushik, S.C., 2015, “Energy and Exergy Analysis of an Annular Thermoelectric Cooler”, Energy Convers Manage, 106, 804-814.
http://dx.doi.org/10.1016/j.enconman.2015.10.029
McNaughton, A.G., 1995, “Commercially Available Generators”, in: D.M. Rowe (Ed.), CRC Handbook of TE, 1. CRC Press. Florida. Mei, V.C., Chen, F.C., and Mathiprakasam, B., 1989, “Comparison of TE and Vapor Cycle Technologies for Groundwater Heat Pump Application”, ASME J, Solar Energy Engineering, 111, 353-360. Min, G., and Rowe, D.M., 2006, “Experimental Evaluation of Prototype Thermoelectric Domestic-Refrigerators”, Applied Energy, 83(2), 133-152.
https://doi.org/10.1016/j.apenergy.2005.01.002
Rabari, R., Mahmud, S., and Dutta, A., 2015, “Effect of Thermal Conductivity on the Performance of Thermoelectric System Based on Effective Medium Theory”, Int. J. Heat and Mass Transfer, 91, 190-204. http://dx.doi.org/10.1016/j.ijheatmasstransfer.2015.06.084
Rawat, M.K., Chattopadhyay, H., and Neogi, S., 2013, “A Review on Developments of Thermoelectric Refrigeration and Air Conditioning Systems: A Novel Potential Green Refrigeration and Air Conditioning Technology”, Int. J. Engineering Technology and Advanced Engineering, 3, 362-367.
Reddy, B.V.K., Barry, M., Li, J., Chyu, M.K., 2013, “Enhancement of Thermoelectric Device Performance through Integrated Flow Channels”, Frontiers in Heat and Mass Transfer, 4, 1-7. DOI: 10.5098/hmt.v4.2.3001.
https://doi.org/10.5098/hmt.v4.2.3001
Reddy, N.J.M., 2016, “A Low Power, Eco-Friendly Multipurpose Thermoelectric Refrigerator”, Front Energy, 10(1), 79-87.
https://doi.org/10.1007/s11708-015-0380-8
Shen, L.M., Xiao, F., Chen, H.X., and Wang, S.W., 2013, “Investigation of A Novel Thermoelectric Radiant Air-Conditioning System”, Energy and Buildings, 59, 123-132.
https://doi.org/10.1016/j.enbuild.2012.12.041
Su, Y., Lu, J., and Huang, B., 2018, “Free-standing planar thin-film thermoelectric micro refrigerators and the effects of thermal and electrical contact resistances”, Int. J. Heat and Mass Transfer, 117, 436– 446.
https://doi.org/10.1016/j.ijheatmasstransfer.2017.10.023
Tan, G., and Zhao, D., 2015, “Study of a Thermoelectric Space Cooling System Integrated with Phase Change Material”, Applied Thermal Engineering, 85, 187-198.
https://doi.org/10.1016/j.applthermaleng.2015.04.054
Totala, N.B., Desai, V.P., and Singh, R.K.N., 2014, “Study and Fabrication of Thermoelectric Air Cooling and Heating System”,
International Journal of Engineering Inventions, 4(2), 20-30.
Yang, J.J., Tan, S.J., and Wu, B.X., 1991, “Development and Effect Test of KWX-1 Portable Medical Refrigerator”, Medical Equipment, 3, 14-15.
Yu, J., and Wang, B., 2009, “Enhancing the Maximum Coefficient of Performance of Thermoelectric Cooling Modules Using Internally Cascaded Thermoelectric Couples”, Int. J. Refrigeration, 32, 32-39.