R E S E A R C H A R T I C L E
Open Access
Gene expression signatures in childhood acute
leukemias are largely unique and distinct from
those of normal tissues and other malignancies
Anna Andersson
1*, Patrik Edén
2, Tor Olofsson
3, Thoas Fioretos
1*Abstract
Background:Childhood leukemia is characterized by the presence of balanced chromosomal translocations or by other structural or numerical chromosomal changes. It is well know that leukemias with specific molecular abnormalities display profoundly different global gene expression profiles. However, it is largely unknown whether such subtype-specific leukemic signatures are unique or if they are active also in non-hematopoietic normal tissues or in other human cancer types.
Methods:Using gene set enrichment analysis, we systematically explored whether the transcriptional programs in childhood acute lymphoblastic leukemia (ALL) and myeloid leukemia (AML) were significantly similar to those in different flow-sorted subpopulations of normal hematopoietic cells (n = 8), normal non-hematopoietic tissues (n = 22) or human cancer tissues (n = 13).
Results:This study revealed that e.g., the t(12;21) [ETV6-RUNX1] subtype of ALL and the t(15;17) [PML-RARA] subtype of AML had transcriptional programs similar to those in normal Pro-B cells and promyelocytes, respectively. Moreover, the 11q23/MLLsubtype of ALL showed similarities with non-hematopoietic tissues. Strikingly however, most of the transcriptional programs in the other leukemic subtypes lacked significant similarity to ~100 gene sets derived from normal and malignant tissues.
Conclusions:This study demonstrates, for the first time, that the expression profiles of childhood leukemia are largely unique, with limited similarities to transcriptional programs active in normal hematopoietic cells, non-hematopoietic normal tissues or the most common forms of human cancer. In addition to providing important pathogenetic insights, these findings should facilitate the identification of candidate genes or transcriptional programs that can be used as unique targets in leukemia.
Background
Genome wide analyses of human cancer have shown that genetic and epigenetic changes lead to deregulated cellular gene expression patterns. The aberrant tran-scriptional states of cancer cells are likely to consist of several transcriptional programs/modules that are important in the initiation and/or progression of malig-nancies. Recent work has successfully used deregulated gene expression profiles to classify different types of cancer and, in some cases, has led to the identification of new tumor subtypes [1-5]. However, forming
biologically meaningful conclusions from the vast amount of genomic data has proven more challenging than first anticipated [6].
Childhood leukemia is the most common pediatric malignancy. It is typically characterized by balanced chromosomal translocations that form oncogenic fusion genes or by other structural or numerical chromosomal changes. For example, acute lymphoblastic leukemia (ALL) is characterized by the following specific altera-tions: t(12;21)(p13;q22) [ETV6/RUNX1], high hyperdi-ploidy (HeH, >50 chromosomes), t(1;19)(q23;p13) [TCF3/PBX1], and t(9;22)(q34;q22) [BCR/ABL1], whereas acute myeloid leukemia (AML) is characterized by t(8;21)(q22;q22) [RUNX1/RUNX1T1], t(15;17)(q22; q21) [PML/RARA], and inv(16)(p13q22) [CBFB/
* Correspondence: anna.andersson@med.lu.se; thoas.fioretos@med.lu.se
1Section of Clinical Genetics, Department of Laboratory Medicine, Lund
University Hospital, Lund, Sweden
MYH11]. Furthermore, 11q23/MLLrearrangements are present in both childhood ALL and AML. The presence of these genetic abnormalities provides important diag-nostic and progdiag-nostic information in a clinical setting [7,8]. The oncogenic properties of several fusion genes have been studied in different mouse models and their transforming capacities have been firmly established [9]. However, it is not understood how specific fusion genes alter the normal transcriptional programs that tightly regulate self-renewal and differentiation from stem cells to mature blood cells. Although global genomic studies have shown that various human leukemia subtypes dis-play profoundly different gene expression profiles [2,4,5,10-12], we still lack important information about the biological and pathogenetic impact of these deregu-lated transcriptional programs.
We have previously shown that the interpretation of aberrant transcriptional signatures in childhood acute lymphoblastic leukemia (ALL) can be improved by including normal hematopoietic subpopulations [10]. For example, we have demonstrated that relatively few of the top differentially expressed genes in the different genetic subtypes of childhood leukemia were correlated with hematopoietic lineages, i.e., myeloid-, lymphoid, or T-cell lineages. Instead, we found that most of the genes were either highly expressed in immature normal hema-topoietic cells or displayed a seemingly‘ectopic expres-sion’restricted to the leukemic cells only. In the current study, we have extended our earlier observations by sys-tematically exploring whether the transcriptional pro-grams in various genetic subtypes of childhood ALL and acute myeloid leukemia (AML) show any significant similarities to those present in an enlarged set of flow-sorted normal hematopoietic cells, a large number of normal non-hematopoietic tissues, or different types of human cancer. We report that, with few exceptions, the transcriptional programs of most childhood acute leuke-mia subtypes display limited similarities to ~100 gene sets representing transcriptional programs/modules active in normal and malignant tissues.
Results and Discussion
Gene expression profiling has been extensively used in the past to identify differentially expressed genes in childhood leukemia [2,4,5,10]. However, it remains chal-lenging to make biological meaningful conclusions from such gene lists. Typically, investigators analyze these gene lists by different gene ontology or pathway analysis tools that may identify certain gene ontology categories or pathways that are perturbed, thus facilitating biologi-cal interpretation. In the past, we have used similar tools and identified several deregulated gene ontology terms being deregulated in leukemia. For example, leu-kemias characterized by the t(1;19) TCF3/PBX1fusion
gene showed a significant enrichment of cell prolifera-tion and cell cycle genes, possibly reflecting the aggres-sive phenotype of this leukemia, which, before intenaggres-sive treatment protocols were introduced often presented with adverse clinical symptoms such as central nervous system disease and with a high risk of relapse [10,13]. In addition, we have previously shown that the inclusion of normal hematopoietic cells can improve the interpreta-tion of gene expression patterns in leukemia [10], by highlighting genes that display a shared or unique expression pattern in the various normal hematopoietic cells and the different genetic subtypes of leukemia.
In the present study, we undertook another approach in trying to understand the biological meaning of the vast number of genes that are differentially expressed in childhood leukemia. Using gene set enrichment analysis (GSEA) [14], which provides a powerful tool to ascertain whether a given gene set is significantly enriched in a list of genes ranked by their correlation with a pheno-type of interest [14,15], we systematically explored whether differentially expressed genes in the various subtypes of childhood leukemia display enrichment of genes found differentially expressed in different normal and malignant tissues. The rationale behind this approach is that gene sets that occur in more than one condition may provide pathogenetic clues for under-standing the nature of the aberrant transcriptional pro-grams present in different genetic subtypes of childhood leukemia. Moreover, by identifying genes or transcrip-tional programs displaying a confined expression only to the leukemic cells and with absent expression in normal hematopoietic cells, new candidates for targeted treat-ment may be identified. Finally, the results may give rise to new ideas for treating leukemia by identifying other tumor types showing similar types of aberrant transcrip-tional programs.
types (Figure 1) were investigated for enrichment in the gene expression profiles obtained from different genetic subtypes of childhood ALL and AML.
First, we investigated whether our newly generated gene sets derived from eight flow-sorted subpopulations of normal hematopoietic cells were enriched within the gene expression profiles of the various genetic subtypes of childhood ALL/AML. This analysis would indicate whether transcriptional programs are shared between normal hematopoietic cells and leukemic blasts. The enrichment of a particular gene set could also indirectly provide clues as to the‘cellular origin’ of a leukemia by displaying enrichment of a gene set from a particular subpopulation of normal hematopoietic cells in the gene expression profile of a specific leukemic subtype. Among the childhood ALL subtypes,ETV6/RUNX1was the only subtype where gene sets obtained from normal hematopoietic cells was enriched: namely with genes that were highly expressed in normal Pro-B cells (Figure 2 and 3; additional file 1). This is consistent with a recent study that demonstrated that the leukemia propa-gating cells in ETV6/RUNX1-positive ALL, likely are restricted to CD34+CD38-/low/CD19+cells, which display a mixture of gene expression profiles characteristic of normal Pro-B cells and hematopoietic stem cells [17]. Surprisingly, no other ALL subtype displayed upregu-lated genes that significantly overlapped with gene sets
derived from the normal hematopoietic cell subpopula-tions. This suggests that the gene expression profiles of these ALL subtypes are derived from a more immature hematopoietic subpopulation or contain genes that are ectopically expressed specifically in leukemia, as we have previously described [10]. If the latter case is true, it would suggest that the primary genetic change in leuke-mia, typically a fusion oncogene, elicits a transcriptional program that is unique to each genetic subtype of leuke-mia and hence, is not used by normal hematopoietic cells. Alternatively, and perhaps more likely, the gene expression profiles reflect a combination of several tran-scriptional programs: 1) those active in the cell targeted by the primary genetic change, and 2) those that become deregulated as a consequence of the specific genetic changes that occur during leukemogenesis. ALL subtypes with 11q23/MLLrearrangements showed an inverse correlation to the gene expression profiles of normal Pro-B cells, where genes highly expressed in the leukemia were downregulated in normal Pro-B cells, and vice versa (Figure 2 and additional file 2). The bio-logical significance of these correlations is presently unclear, but could indicate that the transcriptional pro-grams governing B-cell regulation is perturbed in this leukemia subtype. As expected, a high correlation was obtained for gene sets derived from our previous cDNA microarray analysis ofETV6/RUNX1, TCF3/PBX1, and
Figure 2Summary of the enrichments found in childhood ALL and AML when analyzed against gene sets derived from a large set of normal hematopoietic cells, normal tissues and different types of human cancers using GSEA. Only enrichments found among the upregulated genes in the various leukemia subtypes and the different gene sets are shown. A-C depict enrichments found in ALL and D-F in AML. A red colored square indicate a significant enrichment among genes being upregulated in a genetic subtype with genes contained within a gene set being upregulated in a specific tissue. A green colored square indicates a significant enrichment among genes being upregulated in a genetic subtype with genes contained within a gene set that is downregulated in a specific tissue. The number in the squares shows the normalized enrichment score, which can be used to compare the results across gene sets. Only scores for significant enrichments as determined by FDR are shown in the figure. A and D) genes contained in genes sets from normal flow sorted hematopoietic cells. Also included, as positive controls, are gene sets from previously generated gene expression data of pediatric ALL, B and E) genes contained in genes sets from a large set of different normal human tissues, and C and F) genes contained in genes sets from different human cancers.
11q23/MLL-positive ALL subtypes (Figure 2, additional file 2) [10]. Among the downregulated genes, theTCF3/
PBX1 positive subtype of ALL was the only subtype showing enrichment among the normal hematopoietic cells, namely with genes downregulated in normal pro-B cells and genes downregulated in MEP cells (additional file 2).
Among the childhood AML subtypes, we found that thePML/RARA subtype, which contains a fusion gene that is tightly associated with promyelocytic leukemia, not unexpectedly displayed upregulated genes that were highly correlated to the upregulated genes in nor-mal promyelocytes (Figure 2, additional file 3). This fusion gene, when introduced into human hematopoie-tic stem cells (HSC) rapidly induces differentiation of the HSC into promyelocytes and then blocks differen-tiation [18]. In addition, among the downregulated genes, enrichment was observed among genes being downregulated in normal pro-B cells (additional file 2). We also found that the AML subtype, M7, which is associated with a dismal prognosis[19], displayed gen-ome-wide similarities to normal MEP cells (Figure 2, additional file 4, and additional file 5). This may reflect the cellular level of transformation and/or maturation arrest of this subtype of leukemia [20]. These analyses clearly demonstrated the power of GSEA to capture important similarities between the transcriptional pro-grams of leukemic cells and those of normal hemato-poietic cell subpopulations.
Next, we investigated whether gene sets derived from a large number of normal non-hematopoietic tissues were enriched within the gene expression profiles of childhood ALL and AML. For this purpose, we down-loaded gene expression data from a large number of normal human tissues [16] and generated 52 gene sets
corresponding to 26 tissues. This analysis revealed that, among the upregulated genes, only the 11q23/MLL -positive subtype of ALL showed significant similarities with other normal tissues, where gene sets from pros-tate, adipocytes, and bronchoepithelial cells were enriched among the upregulated genes in such ALLs (Figure 2, and 4, additional file 6, additional file 7, and additional file 8). Notably, this was not evident in child-hood AML with the 11q23/MLL abnormality. When investigating the overlap between the downregulated genes, again, the gene set derived from bronchoepithelial cells were enriched among the 11q23/MLLpositive ALL (additional file 2). Also, theTCF3/PBX1positive subtype of ALL shared similarities with several normal tissues with regard to their downregulated genes (additional file 2). The remaining enrichments observed were among genes upregulated in the various genetic subtypes of childhood ALL and AML and those downregulated in several other non-hematopoietic tissues (Figure 2). Finally, we investigated whether gene sets derived from several different human malignancies were enriched within the gene expression profiles of childhood leuke-mia subtypes. In this analysis, 13 different human can-cers, totaling 75 individual tumor samples were imported from the expO database https://expo.intgen. org/geo/dataDownload.do. The 26 different gene set generated from this data set included the most common human cancers; breast, colon, prostate, and lung cancer. Interestingly, with respect to the upregulated genes, none of the gene sets derived from the different human cancer types were enriched within the gene expression profiles of the various leukemic subtypes (Figure 2). This finding indicates that the perturbed transcriptional profiles of childhood leukemia are different from those of other human cancer types.
A striking observation in the present study was that the majority of the enrichments detected in the GSEA analyses were negative correlations (Figure 2). That is, several genes that were highly expressed in the various genetic subtypes of leukemia were downregulated in normal and malignant tissues. This further supports our hypothesis that the gene expression programs that are transcriptionally active in the various subtypes of child-hood leukemia are unique to the leukemia and show limited similarity to other tissues and human cancers. Interestingly, childhood ALL and AML differed substan-tially in the number of enrichments found by GSEA; we identified 100 enrichments in ALL and only 26 in AML. This may indicate that childhood AML activate tran-scriptional modules that are more disease-specific than those activated in ALL.
We are aware of only one previous study in which a genome-wide comparison was performed between genes being differentially expressed in leukemia and in normal tissues [21]. Using‘gene per gene’comparison, Lotem et al, 2005 [21] reported that several ALL subtypes overex-pressed genes that were active in normal testis or neural tissues. In contrast, we used GSEA that ascertains whether several genes contained within a gene set are significantly enriched within the gene expression profiles of the various genetic subtypes of childhood leukemia. Although the two approaches are different, our results are partly consistent with those of Lotem et al., 2005 [21]. For example, in a‘gene per gene’comparison we also find that the ETV6/RUNX1 ALL subtype overex-press 45 genes that are highly exoverex-pressed in normal tes-tis, but with GSEA, this did not reach statistical significance.
Conclusions
Our findings suggest that childhood leukemia display altered expression profiles that are largely unique to the leukemic cells, with only limited similarities to those in other tissues or in the most common forms of human cancer. Further dissection of these perturbed transcrip-tional programs should provide additranscrip-tional important pathogenetic insights and may help promoting the development of agents that target key mediators of the aberrant transcriptional programs uniquely expressed in the various genetic subtypes of childhood leukemia.
Methods
Expression profiling
Eight flow-sorted subpopulations, obtained after informed consent from healthy adult donors through the Department of Hematology, Lund University Hospital, Sweden, were analyzed. The study was reviewed and approved by the Research Ethic Committee of Lund Uni-versity, Sweden. These eight subpopulations included: 1)
common myeloid progenitor (CMP) cells, 2) granulocyte/ macrophage progenitor (GMP) cells, 3) megakaryocyte/ erythrocyte progenitor (MEP) cells, 4) myeloid cells enriched for promyelocytes, 5) myeloid cells enriched for myelocytes, 6) pro-B cells, 7) pre-B cells, and 8) imma-ture-B cells. The immunophenotype, and gating strategy are shown in additional file 9. To obtain sufficient amount of RNA from each subpopulation, cells from one to six separate sorting experiments were pooled. Two independently pooled samples were subsequently hybri-dized onto Human Genome U133 Plus 2.0 microarrays (Affymetrix Inc, Santa Clara, CA). Data have been depos-ited in Gene Expression Omnibus (GSE19599). For detailed methods information, see additional file 10 (available on the BMC Medical Genomics website).
External data sets
Raw expression data from Ross et al., 2003 and 2004 [4,5] on childhood ALL and AML were downloaded from http://www.stjuderesearch.org. Data composition can be viewed in Supplemental Methods (additional file 10). Normal tissue and human cancer expression data were retrieved from two external data sets. The first [16] con-sisted of 79 human tissues hybridized in duplicate. Sam-ples from the same types of tissue were combined, and a mean gene expression value was calculated and used for subsequent analyses (additional file 11). The second set, consisting of human tumors, was obtained from the expO database https://expo.intgen.org/geo/dataDown-load.do. Cel-files from solid tumors of different types and origin were grouped based on the site of the primary tumor. In total, 75 cases from 13 different tumor sites (2-9 cases per site; mean 5.7 cases per site), including breast, colon, prostate, and lung, were included (additional file 12). After normalization, samples of the same type were combined and the mean expression value was used for subsequent analysis (see below).
Data normalization and gene set enrichment analysis
gene lists were generated by comparing the group of interest to the remaining samples in that data set.
To search for enrichment of specific‘transcriptional programs’(herein defined as ‘gene sets’) within the dif-ferent subtypes of childhood leukemia, we used GSEA [14,15]. GSEA is a computational method that ascertains whether a given gene set (in our case derived from the different normal and malignant tissues) is significantly enriched in a list of genes ranked by their correlation with a phenotype of interest (herein the various genetic subtypes of childhood leukemia).
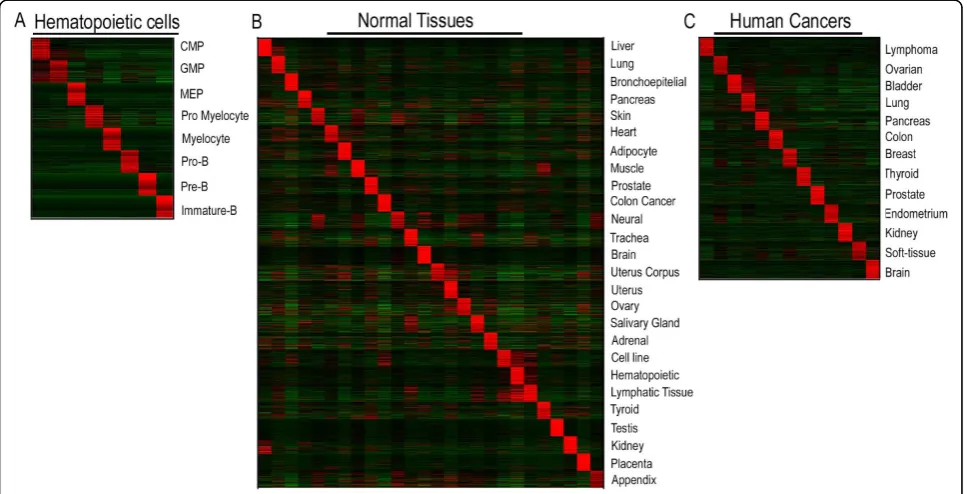
To generate the different gene sets, a list of genes that corresponded to each tissue of interest was truncated at a FDR of 1% or alternatively, for very low FDR values, the list comprised approximately 300 unique genes. From each gene list, two gene sets were generated, one for the upregulated and one for the downregulated genes. In total, 99 gene sets were produced from the normal hematopoietic cells, the normal tissues, and the different human cancer samples. The top 100 genes in each of the gene sets derived from the upregulated genes in the three data sets, are depicted in Figure 1. As a control, we included six gene sets from our previously generated lists of genes that were differentially expressed in childhood ALL with ETV6/RUNX1, TCF3/PBX1, or 11q23/MLL-rearrangements [10]. Within GSEA [14], enrichment analysis was performed using the option of collapsing probe sets in the gene expression data matrix to gene symbols. The ALL and AML data sets were not subjected to a variation filter and probes with multiple hits in the genome were removed. To produce the ranked gene lists for each genetic subtype of ALL and AML within GSEA, we usedt-statistics and 2000 pheno-type permutations to generate the normalized enrich-ment score. Only gene sets that contained more than 15 and below 500 genes were considered, resulting in the exclusion of three gene sets that included genes up- or downregulated in GMP cells (14 and 0 genes, respec-tively) and genes downregulated in CMP cells (3 genes). Correlations in GSEA are measured by a Normalized Expression Score, which is the Kolmogorov-Smirnov running sum [24,25], divided by the mean of the corre-sponding result for permuted datasets. The permutation results are also used to assign a FDR for the enrichment. A FDR of 25% (indicating that the enrichment is valid 3 out of 4 times) or below was considered significant.
Additional file 1: Core enrichment genes in pediatric ALL with
ETV6/RUNX1when compared to genes being upregulated in normal Pro-B cells. Table of the core enrichment genes, their rank and statistics from the gene set enrichment analysis.
Click here for file
[ http://www.biomedcentral.com/content/supplementary/1755-8794-3-6-S1.DOC ]
Additional file 2: A Summary of the enrichments found among the downregulated genes in childhood ALL and AML using GSEA. Figure showing the enrichment scores among the dowregulated genes in the various genetic subtypes of ALL and AML.
Click here for file
[ http://www.biomedcentral.com/content/supplementary/1755-8794-3-6-S2.DOC ]
Additional file 3: GSEA reveals similarities between genes
upregulated in pediatric APL withPML/RARAand those upregulated in normal promyelocytes. Heat maps and enrichment plots of the comparison of normal promyelocytes and APL.
Click here for file
[ http://www.biomedcentral.com/content/supplementary/1755-8794-3-6-S3.DOC ]
Additional file 4: GSEA reveals similarities between genes being upregulated in pediatric AML with AML M7 and those upregulated in normal MEP cells. Heat maps and enrichment plots of the comparison of normal MEP cells and AML M7.
Click here for file
[ http://www.biomedcentral.com/content/supplementary/1755-8794-3-6-S4.DOC ]
Additional file 5: Core enrichment genes in pediatric AML M7 when compared to genes being upregulated in normal flow sorted MEP cells. Table of the core enrichment genes, their rank and statistics from the gene set enrichment analysis.
Click here for file
[ http://www.biomedcentral.com/content/supplementary/1755-8794-3-6-S5.DOC ]
Additional file 6: Core enrichment genes in pediatric ALL with 11q23/MLLwhen compared to genes being upregulated in normal bronchoepitelial cells. Table of the core enrichment genes, their rank and statistics from the gene set enrichment analysis.
Click here for file
[ http://www.biomedcentral.com/content/supplementary/1755-8794-3-6-S6.DOC ]
Additional file 7: Core enrichment genes in pediatric ALL with 11q23/MLLwhen compared to genes being upregulated in normal adipocytes. Table of the core enrichment genes, their rank and statistics from the gene set enrichment analysis.
Click here for file
[ http://www.biomedcentral.com/content/supplementary/1755-8794-3-6-S7.DOC ]
Additional file 8: Core enrichment genes in pediatric ALL withMLL when compared to genes being upregulated in normal tissue derived from prostate. Table of the core enrichment genes, their rank and statistics from the gene set enrichment analysis.
Click here for file
[ http://www.biomedcentral.com/content/supplementary/1755-8794-3-6-S8.DOC ]
Additional file 9: Isolation strategy of the different subpopulations analyzed for gene expression. Example of the isolation strategy of the hematopoietic subpopulations.
Click here for file
[ http://www.biomedcentral.com/content/supplementary/1755-8794-3-6-S9.DOC ]
Additional file 10: Supporting Methods. Contains additional methods information.
Click here for file
[ http://www.biomedcentral.com/content/supplementary/1755-8794-3-6-S10.DOC ]
Additional file 11: The normal tissue data set by Su el al., 2005 and the annotations used for producing the gene sets. Cel files and annotations for the data set by Su et al., 2005.
Click here for file
Additional file 12: The solid tumor data set from the expO database. Description of the analyzed tumors.
Click here for file
[ http://www.biomedcentral.com/content/supplementary/1755-8794-3-6-S12.DOC ]
Acknowledgements
This study was supported by the Swedish Cancer Society, the Swedish Children’s Cancer Foundation, the Swedish Research Council, the Medical Faculty of Lund University, the Gunnar Nilsson Cancer Foundation, and the IngaBritt and Arne Lundberg Foundation.
Author details
1Section of Clinical Genetics, Department of Laboratory Medicine, Lund
University Hospital, Lund, Sweden.2Department of Complex System Division, Theoretical Physics, Lund University, Lund, Sweden.3Department of
Hematology & Transfusion Medicine, Lund University, Lund, Sweden.
Authors’contributions
AA and TF designed the research and wrote the manuscript. AA, PE, TO and TF performed the research and analyzed the data. All authors have read and approved the final manuscript.
Competing interests
The authors declare that they have no competing interests.
Received: 21 August 2009 Accepted: 8 March 2010 Published: 8 March 2010
References
1. Alizadeh AA, Eisen MB, Davis RE, Ma C, Lossos IS, Rosenwald A, Boldrick JC, Sabet H, Tran T, Yu X, Powell JI, Yang L, Marti GE, Moore T, Hudson J Jr, Lu L, Lewis DB, Tibshirani R, Sherlock G, Chan WC, Greiner TC, Weisenburger DD, Armitage JO, Warnke R, Levy R, Wilson W, Grever MR, Byrd JC, Botstein D, Brown PO, Staudt LM:Distinct types of diffuse large B-cell lymphoma identified by gene expression profiling.Nature2000,
403(6769):503-511.
2. Andersson A, Ritz C, Lindgren D, Eden P, Lassen C, Heldrup J, Olofsson T, Rade J, Fontes M, Porwit-Macdonald A, Behrendtz M, Hoglund M, Johansson B, Fioretos T:Microarray-based classification of a consecutive series of 121 childhood acute leukemias: prediction of leukemic and genetic subtype as well as of minimal residual disease status.Leukemia
2007,21(6):1198-1203.
3. Perou CM, Jeffrey SS, Rijn van de M, Rees CA, Eisen MB, Ross DT, Pergamenschikov A, Williams CF, Zhu SX, Lee JC, Lashkari D, Shalon D, Brown PO, Botstein D:Distinctive gene expression patterns in human mammary epithelial cells and breast cancers.Proc Natl Acad Sci USA1999,
96(16):9212-9217.
4. Ross ME, Mahfouz R, Onciu M, Liu HC, Zhou X, Song G, Shurtleff SA, Pounds S, Cheng C, Ma J, Ribeiro RC, Rubnitz JE, Girtman K, Williams WK, Raimondi SC, Liang DC, Shih LY, Pui CH, Downing JR:Gene expression profiling of pediatric acute myelogenous leukemia.Blood2004,
104(12):3679-3687.
5. Ross ME, Zhou X, Song G, Shurtleff SA, Girtman K, Williams WK, Liu HC, Mahfouz R, Raimondi SC, Lenny N, Patel A, Downing JR:Classification of pediatric acute lymphoblastic leukemia by gene expression profiling. Blood2003,102(8):2951-2959.
6. Ebert BL, Golub TR:Genomic approaches to hematologic malignancies. Blood2004,104(4):923-932.
7. Grimwade D:The clinical significance of cytogenetic abnormalities in acute myeloid leukaemia.Best Pract Res Clin Haematol2001,14(3):497-529. 8. Johansson B, Mertens F, Mitelman F:Clinical and biological importance of cytogenetic abnormalities in childhood and adult acute lymphoblastic leukemia.Ann Med2004,36(7):492-503.
9. Rabbitts TH:Chromosomal translocation master genes, mouse models and experimental therapeutics.Oncogene2001,20(40):5763-5777. 10. Andersson A, Olofsson T, Lindgren D, Nilsson B, Ritz C, Eden P, Lassen C,
Rade J, Fontes M, Morse H, Heldrup J, Behrendtz M, Mitelman F,
Hoglund M, Johansson B, Fioretos T:Molecular signatures in childhood acute leukemia and their correlations to expression patterns in normal hematopoietic subpopulations.Proc Natl Acad Sci USA2005,
102(52):19069-19074.
11. Bullinger L, Dohner K, Bair E, Frohling S, Schlenk RF, Tibshirani R, Dohner H, Pollack JR:Use of gene-expression profiling to identify prognostic subclasses in adult acute myeloid leukemia.N Engl J Med2004,
350(16):1605-1616.
12. Valk PJ, Verhaak RG, Beijen MA, Erpelinck CA, Barjesteh van Waalwijk van Doorn-Khosrovani S, Boer JM, Beverloo HB, Moorhouse MJ, Spek van der PJ, Lowenberg B, Delwel R:Prognostically useful gene-expression profiles in acute myeloid leukemia.N Engl J Med2004,350(16):1617-1628. 13. Crist WM, Carroll AJ, Shuster JJ, Behm FG, Whitehead M, Vietti TJ, Look AT,
Mahoney D, Ragab A, Pullen DJ,et al:Poor prognosis of children with pre-B acute lymphoblastic leukemia is associated with the t(1;19)(q23; p13): a Pediatric Oncology Group study.Blood1990,76(1):117-122. 14. Subramanian A, Tamayo P, Mootha VK, Mukherjee S, Ebert BL, Gillette MA,
Paulovich A, Pomeroy SL, Golub TR, Lander ES, Mesirov JP:Gene set enrichment analysis: a knowledge-based approach for interpreting genome-wide expression profiles.Proc Natl Acad Sci USA2005,
102(43):15545-15550.
15. Subramanian A, Kuehn H, Gould J, Tamayo P, Mesirov JP:GSEA-P: a desktop application for Gene Set Enrichment Analysis.Bioinformatics
2007,23(23):3251-3253.
16. Su AI, Wiltshire T, Batalov S, Lapp H, Ching KA, Block D, Zhang J, Soden R, Hayakawa M, Kreiman G, Cooke MP, Walker JR, Hogenesch JB:A gene atlas of the mouse and human protein-encoding transcriptomes.Proc Natl Acad Sci USA2004,101(16):6062-6067.
17. Hong D, Gupta R, Ancliff P, Atzberger A, Brown J, Soneji S, Green J, Colman S, Piacibello W, Buckle V, Tsuzuki S, Greaves M, Enver T:Initiating and cancer-propagating cells in TEL-AML1-associated childhood leukemia.Science2008,319(5861):336-339.
18. Grignani F, Valtieri M, Gabbianelli M, Gelmetti V, Botta R, Luchetti L, Masella B, Morsilli O, Pelosi E, Samoggia P, Pelicci PG, Peschle C:PML/RAR alpha fusion protein expression in normal human hematopoietic progenitors dictates myeloid commitment and the promyelocytic phenotype.Blood2000,96(4):1531-1537.
19. Rubnitz JE, Razzouk BI, Lensing S, Pounds S, Pui CH, Ribeiro RC:Prognostic factors and outcome of recurrence in childhood acute myeloid leukemia.Cancer2007,109(1):157-163.
20. Bourquin JP, Subramanian A, Langebrake C, Reinhardt D, Bernard O, Ballerini P, Baruchel A, Cave H, Dastugue N, Hasle H, Kaspers GL, Lessard M, Michaux L, Vyas P, van Wering E, Zwaan CM, Golub TR, Orkin SH:
Identification of distinct molecular phenotypes in acute
megakaryoblastic leukemia by gene expression profiling.Proc Natl Acad Sci USA2006,103(9):3339-3344.
21. Lotem J, Netanely D, Domany E, Sachs L:Human cancers overexpress genes that are specific to a variety of normal human tissues.Proc Natl Acad Sci USA2005,102(51):18556-18561.
22. Wu J, Irizarry R, Macdonald J, Gentry J:Background Adjustment Using Sequence Information. R package version 2.10.0..
23. Gentleman RC, Carey VJ, Bates DM, Bolstad B, Dettling M, Dudoit S, Ellis B, Gautier L, Ge Y, Gentry J, Hornik K, Hothorn T, Huber W, Iacus S, Irizarry R, Leisch F, Li C, Maechler M, Rossini AJ, Sawitzki G, Smith C, Smyth G, Tierney L, Yang JY, Zhang J:Bioconductor: open software development for computational biology and bioinformatics.Genome Biol2004,5(10): R80.
24. Kolmogorov A:Sulla determinazione empirica di una legge di distribuzione.Giorn Dell Inst Ital Degli Attuari1933,4:83-91.
25. Smirnov N:On the estimation of the discrepancy between empirical curves of distribution for two independent samples.Bull Moscow Univ
1939,2:3-16.
Pre-publication history
The pre-publication history for this paper can be accessed here: http://www.biomedcentral.com/1755-8794/3/6/prepub
doi:10.1186/1755-8794-3-6
Cite this article as:Anderssonet al.:Gene expression signatures in
childhood acute leukemias are largely unique and distinct from those of normal tissues and other malignancies.BMC Medical Genomics2010