R E V I E W
Open Access
Memory profiles in Down syndrome across
development: a review of memory abilities
through the lifespan
Mary Godfrey
*and Nancy Raitano Lee
Abstract
Down syndrome (DS) is associated with a variety of cognitive impairments, notably memory impairments. Due to the high prevalence rates of early-onset dementia associated with DS, it is imperative to understand the
comprehensive development of memory impairments beginning in childhood and into adulthood, as this may help researchers identify precursors of dementia at earlier stages of development and pinpoint targets for memory intervention. The current paper provides a systematic, developmentally focused review of the nature of memory difficulties in DS across the lifespan. Specifically, this review summarizes what is known about long-term, short-term, and working memory abilities (distinguishing between verbal and nonverbal modalities) in DS, compared to both mental age-matched typically developing peers and individuals with other forms of intellectual disability (ID) at three developmental stages (i.e., preschool, adolescence, and adulthood). Additionally, this review examines the degree of impairment reported relative to typically developing mental age-matched peers in the existing literature by examining effect size data across memory domains as a function of age. With few exceptions, memory abilities were impaired across the lifespan compared to mental age-matched typically developing peers. Relative to other groups with ID, research findings are mixed. Our review of the literature identified a scarcity of memory studies in early childhood, particularly for STM and WM. In adulthood, research was limited in the LTM and WM domains and very little research has compared memory abilities in older adults with DS to those with typical development. Looking to the future, longitudinal studies could provide a better understanding of the developmental trajectory of memory abilities in DS, and the possible associations between memory abilities and real-world functioning. This research could ultimately inform interventions to improve independence and overall quality of life for those with DS and their families.
Keywords:Intellectual disability, Cognition, Developmental trajectory
Background
The current paper provides a systematic, developmen-tally focused review of the nature of memory difficulties in Down syndrome (DS) across the lifespan. We aim to add to and extend prior reviews (e.g., [1]) by describing what is known about different domains of memory func-tion during different developmental periods. Addifunc-tion- Addition-ally, to begin to examine memory impairments across the lifespan, we have calculated effect size estimates from published studies of long-term (LTM), short-term (STM), and working memory (WM) in which individuals
with DS were compared to typically developing (TD) in-dividuals matched on mental age (i.e., overall cognitive level). We have plotted these by domain (LTM, STM, WM), modality of the task (verbal, nonverbal), and mean chronological age of participants to begin to examine trends in findings and to identify developmental periods during which more research is needed. Our review is or-ganized as follows: (a) we provide a brief summary of the DS cognitive phenotype to set the backdrop for interpreting memory impairments in DS; (b) we then de-scribe neuropsychological conceptualizations of memory fractionation in order to organize the memory domains
reviewed; and, finally, (c) we summarize past studies’
* Correspondence:[email protected]
Department of Psychology, Drexel University, 3141 Chestnut Street, Stratton 119, Philadelphia, PA 19104, USA
© The Author(s). 2018Open AccessThis article is distributed under the terms of the Creative Commons Attribution 4.0
findings on LTM, STM, and WM in DS from preschool to adulthood.
DS is the most common form of intellectual disability (ID) with a specific genetic etiology, occurring in one of every 691 live births [2]. The syndrome results in a grad-ually declining IQ during childhood (i.e., cognitive gains do not keep pace with chronological age) [3]. Beginning at an early age, individuals with DS have impairments in
adaptive functioning [4–6] and specific cognitive
do-mains such as expressive language, and executive func-tion that are in excess of overall cognitive impairments
(for reviews, see [7–9]).
Furthermore, impairments in LTM are a prominent as-pect of the DS cognitive phenotype and have been a par-ticular area of research interest, in part due to the high
prevalence of precocious-onset Alzheimer’s disease (AD)
associated with DS. AD causes a progressive decline in cognitive abilities and functional skills and is the most common cause of dementia in the general population (for review, see [10]). The increased rates of precocious AD in DS are thought to be due in part to overexpression of genes on chromosome 21, most notably the amyloid beta
precursor protein gene (for reviews, see [11–13]).
The neuropathology of AD is characterized by neuritic plaques and neurofibrillary tangles, which lead to death of neurons, brain atrophy, and cognitive decline [14]. Recent research on DS suggests that the amyloid beta accumula-tion first begins in the striatum, and progresses into the frontal lobes, and eventually the temporal lobe ([15, 16]; for review, see [12]). Consequently, those with DS and co-morbid AD exhibit declines in executive function abilities, memory encoding and retrieval abilities, episodic memory
and new learning abilities ([12, 17–19]). Although these
symptoms of AD in DS are similar to symptoms in TD adults, the age of onset of AD within the DS population is much younger than in the TD population. By age 45, vir-tually all adults with DS have AD neuropathology; how-ever, only 8.9% of adults with DS present with symptoms of AD at this age [20]. Nevertheless, AD symptom preva-lence in DS is significantly higher than the AD symptom prevalence in typically developing (TD) adults, which oc-curs in only 0.003% of individuals at this age [21]. More-over, by age 72, 67% of individuals with DS will meet the
criteria for AD compared to 5% of TD adults [20, 22–24].
As a result, the development of memory impairments in adults with DS has been widely studied to better under-stand the risk factors for comorbid dementia.
Although understanding memory impairments in DS in middle and older adulthood has direct implications for understanding the development of comorbid AD, it is also important to understand memory impairments in DS across development. From infancy and childhood into adulthood, memory abilities are associated with adaptive behavior, independence skills, reading abilities,
and general intelligence in DS [1, 9, 25, 26]. Thus, to provide strategic interventions, it is necessary to eluci-date the relative strengths and weaknesses of specific memory domains across development. Furthermore, es-tablishing a baseline of expected memory abilities across development could help clinicians identify impaired memory performance and subtle precursors to dementia earlier in development. Therefore, applying a develop-mental perspective to our conceptualization of the DS memory phenotype may provide crucial information ne-cessary to improve clinical care and advance our theoret-ical models of memory development.
As argued by Karmiloff-Smith [27], utilizing a develop-mental approach to the study of cognition does not sim-ply mean examining a pediatric sample, but rather it involves capturing changing abilities of a group over
time. While the traditional neuropsychological “
snap-shot” approach of comparing a clinical group to a
con-trol group at one time point has provided valuable information about the DS cognitive phenotype, the tra-jectory approach allows us to map and track age and performance [28]. Therefore, this method promotes identification of developmental memory trends across the lifespan, indicating whether memory impairments increase or decrease with age.
The current review attempts to synthesize the existing literature on LTM, STM, and WM in DS within a devel-opmental framework. However, it is important to note that the existing research literature on memory in DS does not permit the adoption of a traditional develop-mental trajectory approach to conceptualize changing memory impairments in DS across the lifespan. This is for two primary reasons. First, longitudinal studies of memory abilities are very limited for the group. Second, such an approach is best implemented when chrono-logical age-matched comparison groups are included in studies as a benchmark of deviations from developmen-tal expectations. Unfortunately, the inclusion of a chronological age-matched TD comparison group is a rarity in the literature on memory in DS. Rather, the vast majority of studies examining cognitive abilities of the DS population compare these to mental-age (MA)-matched peers because of the well-established under-standing that cognitive functioning in DS is below chronological age expectations (for review, see [29]). Furthermore, the majority of neuropsychological
assess-ments lack utility for a wide range of mental ages—that
peers but will add a developmental perspective in that we will examine the degree of impairment relative to more general cognitive abilities as a function of the
DS group’s chronological age.
The use of MA-matched peers as a comparison group is not only suboptimal for describing developmental trends relative to age expectations, it also makes com-paring results across studies challenging, as different in-vestigators may match on measures of overall cognitive ability, verbal cognitive ability, or nonverbal cognitive ability. For a group like DS with pronounced impair-ments in some aspects of language functioning (for a re-view, see [30]), matching on verbal MA may result in a pattern of findings in which nonverbal memory impair-ments look smaller than they would if groups were matched on nonverbal cognitive ability. In this latter sce-nario, that is matching on nonverbal cognitive abilities, impairments on verbal memory tasks may appear larger or be exaggerated due to the nonverbal cognitive match-ing strategy. Thus, in order to be clear about the nature of the existing findings in the literature, our review, in-cluding summary tables and figures, which will be de-scribed later, includes details about the matching strategy employed. We hope that this will aid the reader in interpreting the existing findings and thus trends in memory abilities relative to overall cognitive abilities across development in DS. Prior to describing this litera-ture, we will provide a brief overview of neuropsycho-logical conceptualizations of memory fractionation to provide a framework to organize the memory domains included in the current review, as well as a justification for the choice of memory domains reviewed.
Neuropsychological conceptualizations of memory
Current conceptualizations of retrospective memory, the process of recalling previously learned information, div-ide this construct into two forms: implicit and explicit memory [31]. Implicit memory involves retrieving infor-mation, without conscious awareness, to perform an
ac-tion. It is thought to rely upon the basal ganglia [32–34]
and broader cortico-striatal networks (see [31, 35] for re-views). This review will not examine implicit memory, due to the limited number of studies examining this construct in DS. Furthermore, existing studies suggest that implicit memory tends to be MA appropriate in DS. For example, Vicari and colleagues ([36, 37]) reported comparable performance on implicit memory tasks between those with DS and typically developed MA-matched children. Moreover, they reported stronger im-plicit memory performance in DS compared to ID peers (e.g., Williams syndrome). Consistent with these find-ings, Bussy and colleagues [38] reported that those with DS could implicitly learn a sequence of movements at
levels comparable to MA-matched TD peers. Thus, the limited research available indicates that while implicit memory is not equivalent to chronological age expecta-tions in adolescents and adults with DS, it is not im-paired beyond mental age expectancies in DS. Because past research with children with DS consistently has found impairments in explicit memory that exceed glo-bal learning difficulties (i.e., performance below MA ex-pectations) [36, 37], we will focus our review on explicit memory systems.
Explicit memory consists of actively retrieving memories and being cognizant of the prior learning process. Explicit memory can be categorized as either semantic memory (i.e., general knowledge, facts, and vocabulary) or episodic (i.e., biographical, personal events, contextual memories) [39]. Furthermore, memory models categorize the con-struct by time length and quantity of information to be recalled. With regard to time length, models have trad-itionally distinguished memory as either upheld for a mat-ter of seconds (i.e., STM) or stored and retrieved at a lamat-ter point in time (i.e., LTM) [40, 41]). These distinctions have
roots in James’ early descriptions of primary (STM) and
secondary (LTM) memory ([42]). Another factor that has been used to distinguish STM and LTM is the amount of information to be recalled [43]. More specifically, STM is believed to have a limited capacity, that is, the
to-be-recalled information must fall within an individual’s
im-mediate memory span [43, 44]. Tasks that exceed an
indi-vidual’s immediate memory span are referred to as
supraspan memory tasks and are often categorized under the LTM umbrella. For the purposes of the current paper,
we will refer to tasks that requireimmediaterecall of
sub-spanstimuli asSTMtasks and those that require the recall
ofsupraspanstimulior impose a delayprior to the testing
of recall asLTMtasks.
abilities of individuals with DS, we will examine WM distinctly from STM.
Lastly, it should be noted that while we have organized our review of memory in DS utilizing these three mem-ory domains, theories of memmem-ory and its fractionation are ever evolving, with some researchers arguing that the content of memory is more important to consider than the timing of stimuli presentation and recall (e.g., [48]). Given that the vast majority of studies examining memory in DS utilize LTM, STM, and WM to describe tasks demands, the current review adopts these terms. However, we will briefly touch upon alternative memory frameworks and their implications for the future of DS
memory research in the“Discussion”section.
We will now review what is known about LTM, STM, and WM abilities in DS over the lifespan. Our review of these memory domains will also distinguish between im-pairments in verbal and nonverbal modalities (i.e., visual or spatial abilities), as memory abilities do appear to dif-fer based on the modality of the to-be-recalled stimuli ([49]; for review, see [47]). Additionally, memory studies will be organized into three developmental periods:
pre-school (≤5 years old), school-age and adolescence (6 to
17 years old), and adulthood (≥18 years).
Literature review and analytic methods
The current literature was garnered through a system-atic search of online databases. Specifically, keyword
combinations included “Down Syndrome” or “Trisomy
21” and “memory,” “short-term memory,” “long-term
memory,” and“working memory”. This search produced
1534 unique articles via the online databases PubMed, PsycInfo, and Web of Science. (A total of 2446 articles were identified with 912 redundancies.)
The first author completed the initial search of the lit-erature. This was followed by a second review of ab-stracts by the second author. Studies were selected that either (a) compared a participant group with DS to a control group (either typically developing individuals or individuals with intellectual disabilities) or (b) examined older adults with DS and compared performance at dif-ferent ages. To be included in the current review, the study was required to include at least one memory as-sessment (i.e., LTM, STM, or WM). This resulted in a selection of 106 studies which have informed our review of LTM, STM, and WM in DS.
Next, we chose a subset of the 106 studies to gather effect size data to examine the average magnitude of the impairment within each memory domain and modality relative to mental age expectations. The following cri-teria were imposed to identify tasks from these 106 stud-ies for which effect sizes would be calculated for the current review: (1) the study included a typically devel-oping, mental age-matched comparison group, (2)
means and standard deviations were available so that ef-fect sizes could be calculated or efef-fect sizes were re-ported, and (3) the study provided adequate description of task demands to determine if it should be included in the LTM, STM, or WM sections. Adequate description for LTM tasks included a description of a delay (minutes to days) between memory encoding and retrieval or a description of recall after an extended presentation of stimuli (i.e., includes repeated recall of supraspan item lists in which learning was evaluated over multiple tri-als). For STM tasks, a description of immediate retrieval of subspan items after encoding was required. Lastly, WM tasks were included if the tasks required immediate retrieval of information and manipulation of the to-be-remembered material. It is important to note that the key distinction between STM and WM studies was the dual task nature of the WM studies, i.e., one not only needs to recall but also must manipulate the material. If a task was described in a study as being a WM task but it did not have a discernible manipulation/dual task component, we included it in the STM table and STM effect size calculations.
When choosing the outcome measure to report on for effect size calculations, if a study presented two outcome variables for one task, we chose the outcome variable that summarized the overall performance best, and con-sistently chose the same outcome variable for the same task across studies (if possible). Additionally, if the study reported on errors, resulting in a positive effect size indi-cating worse performance, the sign was reversed (i.e., negative effect size) to maintain consistency and more easily reflect the impaired performance in which
nega-tive Cohen’sd values reflect poorer performance by the
DS group relative to the MA group.
for studies employing story memory tasks, given the added syntactic processing demands of such tasks.
Decision to include a study in the domain in which it was placed was established by consensus between the first and second authors. For transparency about the de-mands of the tasks that fell into the different
domains—LTM, STM, and WM—and for effect size
cal-culations, we have provided detailed task descriptions in a supplementary table (Additional file 1: Table S1). Using the established criteria, 26 of the 106 studies contributed data for effect size calculation; from these studies, 71 ef-fect sizes were calculated. Of these 71 efef-fect sizes, 38 (53%) were derived from studies with an overall MA-matched TD group, 9 (13%) were MA-matched on nonverbal MA, and 24 (34%) were matched on verbal MA (as mea-sured in nearly all cases by a receptive vocabulary task). We then plotted effect size estimates as a function of mean chronological age of the DS group for the LTM, STM, and WM studies reviewed in order to summarize existing data visually. These figures include DS and TD comparisons only (i.e., not DS and ID comparisons). Some studies used multiple tasks, and thus, the tasks are
plotted separately (i.e., a study’s findings can be found in
multiple figures if tasks tapped different memory do-mains; also, if multiple measures of the same memory domain were included, these are plotted separately in the same figure).
Long-term memory
LTM refers to the process of storing information that can be retrieved for use in minutes, hours, or years later. It involves three stages: encoding (i.e., extracting distinct factors to form a memory), storage (i.e., maintenance of memories), and retrieval (i.e., obtaining information from storage), and is thought to call upon a complex network of neural structures, including the hippocam-pus, the perirhinal cortex, and the parahippocampal cor-tex [51]. LTM is often assessed using tasks in which an individual is introduced to a novel set of stimuli and then asked to recall that information over several trials and/or following a delay (e.g., 20 to 30 min). Examples of standardized verbal and visual LTM tasks include the California Verbal Learning Test (CVLT) and the Rey Complex Figure Test (RCFT), respectively [52, 53]. The CVLT is a list-learning task in which participants must recall supraspan lists of words that are repeated over several trials and following a delay. The RCFT involves recalling the configuration of a complex figure both im-mediately and following a delay. These two types of tasks tend to be used with school-age and older participants with DS to evaluate LTM. Examples of tasks used with children prior to the school-age years (before the age of 5) tend to involve delayed imitation (e.g., learning a three-step action sequence and recalling after a delay)
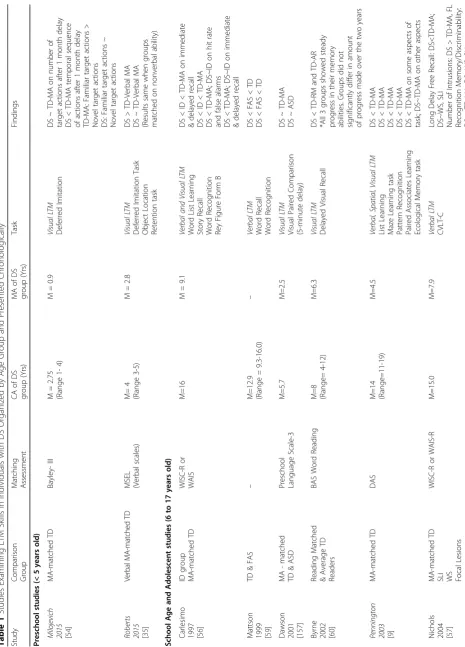
and object location memory (e.g., recalling the location of a toy after a delay). LTM abilities across the lifespan in DS are described in the following sections. In addition, Table 1 summarizes the existing research litera-ture in greater detail.
Preschool studies (≤5 years old)
No studies of which we are aware examine verbal LTM abilities in preschool children with DS; consequently, our knowledge of LTM in the verbal modality does not begin until school age. In contrast, there are a few stud-ies that have examined nonverbal LTM abilitstud-ies in the preschool age, but findings are mixed. Roberts and Rich-mond (2015) found preschool-age children with DS per-formed comparably to their MA-matched peers on object location recall and deferred imitation tasks after a 24-h delay [35]. Consequently, these researchers con-cluded that LTM impairments (in excess of MA) did not begin until after the early childhood years in DS. In con-trast, Milojevich and Lukowski (2016) reported impaired performance on recall of sequenced information by preschool-age children with DS compared to MA-matched peers after a 1-month delay. Therefore, the re-searchers contended that LTM impairments (in excess of MA) are present in preschool children with DS [54]. Thus, the limited data from preschool suggest that al-though children with DS may have MA expected non-verbal LTM performance after a shorter delay (24-h), their performance appears worse than MA expectations after a month-long delay. Clearly, more research is needed to clarify LTM abilities in the early developmen-tal years of DS. Such research could help clinicians iden-tify target ages to provide memory interventions, perhaps prior to the onset of significant deviations from mental or even chronological age expectations.
School age and adolescent studies (6 to 17 years old) Within LTM research, there has been a consistent find-ing of significant verbal LTM impairments among ado-lescents with DS. With the exception of one study [55], DS groups perform significantly worse than MA-matched TD peers on list-learning tasks with a delay [9, 56, 57]. Additionally, Nichols [57] found adolescents with DS had significantly more intrusive responses and impaired discrimination abilities on list recall compared to MA-matched controls.
In comparison to children with ID, several studies have reported that teens with DS performed significantly worse on verbal LTM tasks [56, 58, 59]. However, when compared to children with Williams syndrome (WS), teens with DS have been reported to have equivalent performance on verbal list-learning long-delay recalls
(e.g., CVLT-Children’s Version) [57] and better
research indicates adolescents with DS perform below MA-matched typically developing controls on verbal LTM assessments, additional research is needed to clar-ify whether this deficit is comparable or less significant than that found in other ID groups.
Similar to their verbal LTM abilities, most studies report that adolescents with DS demonstrate impaired perform-ance on nonverbal LTM tasks in comparison to TD chil-dren matched on MA (e.g., [9, 56, 60], but see [61, 62]). Specifically, teens with DS exhibit impaired performance on visual associative memory tasks, pattern recognition, and spatial LTM tasks (e.g., maze location and spatial loca-tion recall tasks; [9]) compared with MA-matched children. However, teens with DS largely have similar or stronger performance when compared to groups with mixed ID or WS on visual LTM tasks [55, 56]. In addition, adolescents with DS have demonstrated significantly greater perform-ance than children with WS on spatial LTM tasks [25]. Thus, there appears to be consistent evidence that adoles-cents with DS perform comparably or better than other ID groups, yet worse than MA-matched TD comparison groups on nonverbal LTM tasks in the majority of research studies.
Adult and older adult studies (18 years and older) Adults with DS continue to perform below MA expecta-tions on LTM tasks. The very limited data available sug-gest that on verbal LTM tasks, adults with DS perform worse than MA-matched typically developing controls [36]. Similarly, several studies that have compared adults with DS to ID groups have reported lower performance
[63–65], which includes research that has shown that
adults with DS have significantly longer response laten-cies on verbal memory tasks [64] and lower levels of im-provement across repeated testing [65] relative to other ID groups. Furthermore, unlike other ID groups, per-formance on word list learning tasks is inversely related to age in adults with DS [63, 66]. Additionally, younger adults with DS show improvement with repeated testing of verbal LTM list-learning tasks (e.g., selective remind-ing task), while older adults actually exhibit a small de-crease in performance across testing [65].
Research has also shown that adults with DS perform significantly worse than MA-matched TD controls on
nonverbal LTM tasks [36, 67–69]. Research comparing
nonverbal LTM in those with DS to other ID groups re-veals mixed findings, with some studies reporting similar performance on some tasks ([70, 71]) and greater im-pairment on others [69, 70]. Research within the DS population has demonstrated that nonverbal LTM mem-ory begins to decline in young adulthood [72, 73]. In particular, performance on tasks with higher cognitive load (i.e., increased number of stimuli) significantly de-clines with age in adulthood [74, 75].
The majority of adult research comparing LTM abil-ities (both verbal and nonverbal) of DS groups to TD groups focuses on individuals with an average age in the 30s. Many studies examining memory abilities of older adults do exist. However, these studies typically compare adults with DS at different age points, rather than com-paring to mental age-matched TD participants. Conse-quently, the field lacks research examining older adults with DS compared to those with typical development.
LTM across development in DS
To summarize the existing literature in DS across
devel-opment visually, we calculated effect sizes using Cohen’sd
[76] (i.e., DS group mean–MA-matched TD control group
mean/pooled standard deviation) for published studies that fit our inclusion/exclusion criteria (delineated in the
“Literature review and analytic method” section). These
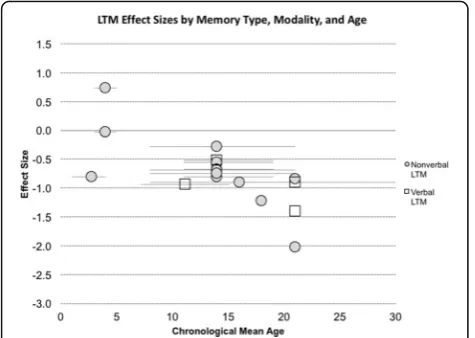
studies are in italics print in Table 1. We have summarized the effect sizes of findings from existing LTM studies of DS as a function of the mean chronological age of the DS group and task modality in Fig. 1. In addition, in this fig-ure, we have noted the method by which the DS group was matched to the typically developing group (verbal, nonverbal, or overall MA) and included details about the assessment tool used to match DS and TD participants in Table 1. Additional file 1: Table S1 provides greater details about the tasks included in Fig. 1.
First, collapsing across studies ignoring age, we find the mean effect size for the LTM domain is medium to
large (d=−.73 overall). The effect size for verbal LTM
(d=−0.94) is large, while the effect size for nonverbal
LTM is medium (d=−.68). Thus, it is clear that LTM
abilities deviate from mental age expectations in DS. Moreover, impairments are evident (in most studies) from an early age and persist across development. There is a suggestion in the data of greater nonverbal LTM im-pairments relative to mental age expectations later in de-velopment. However, given the differences in the tasks used across development, different mental age matching strategies, and the lack of longitudinal research, this ob-servation is made very tentatively.
Short-term memory
STM refers to a limited capacity, immediate memory system in which small amounts of information can be actively upheld and preserved for a matter of seconds. With regard to its neural correlates, STM encoding and retrieval involve a network of regions, including the frontal lobes, inferior portions of the parietal lobe, hippocampus, and superior portions of the temporal
lobe [77–80]. However, neuroimaging data suggest that
Table 1 Studies Examining LTM Skills in Individuals with DS Organized by Age Group and Presented Chronologically Study Comparison Group Matching Assessm ent CA of DS group (Yrs) MA of DS group (Yrs) Task Finding s Presch ool studies (< 5 years old ) Milo jevich 201 5 [ 54 ] MA-matched TD Bayley -III M = 2.75 (Range 1-4) M = 0.9 Visu al LTM Defe rred Imit ation DS ~ TD-MA on num ber of target actions afte r 1 month de lay DS < TD-MA temp oral seque nce of actions afte r 1 mont h delay TD-MA: Famil iar target actions > Novel targ et action s DS: Fam iliar targ et actions ~ Novel targ et action s Robe rts 201 5 [ 35 ] V er b al M A -m at ch ed TD MSEL (Verbal sc ales) M= 4 (Range 3-5) M = 2.8 Visu al LTM Defe rred Imit ation Task Obje ct Loca tion Rete ntion task DS > TD-Ve rbal MA DS ~ TD-Ve rbal MA (Results sam e whe n groups match ed on nonv erbal abi lity) Schoo l Age and Adole scent stud ies (6 to 17 yea rs old) Carl esimo
1997 [56
] ID group MA-matched TD WISC-R or WAIS M=16 M = 9.1 Verb al and Visual LTM Word List Lea rning Story Recall Word Recogn ition Rey Figure Form B DS < ID < TD-MA on imme diate & delayed recal l DS < ID < TD-MA DS < TD-MA; D S~ID on hit rate and false alarm s DS < TD-MA; D S~ID on im medi ate & delayed recal l Matt son
1999 [59
] TD & FAS – M=12. 9 (Range = 9.3-1 6.0) – Verb al LTM Word Recall Word Recogn ition DS < FAS < TD DS < FAS < TD Daws on
2001 [157
] MA -matched TD & ASD Prescho ol Language Scale-3 M=5.7 M=2 .5 Visu al LTM Visua l Pai red Comparison (5-m inute de lay) DS ~ TD-MA DS ~ ASD Byrn e
2002 [60
] Readin g Matc hed & Average TD Readers BAS Word Readi ng M=8 (Range= 4-12) M=6 .3 Visu al LTM Del ayed Visua l Re call DS < TD-RM and TD-A R *All 3 groups showed steady progress in their me mory abilities. Grou ps did not significan tly differ in amou nt of progr ess mad e over the two years Penning ton 200 3 [ 9 ] MA-matched TD DAS M=14 (Range= 11-1 9) M=4 .5 Verb al, Sp atial, Visual LTM Lis t Learn ing Maze Lea rning task Patt ern Re cognit ion Pai red Associates Learn ing Ecolog ical Mem ory task DS < TD-MA DS < TD-MA DS < TD-MA DS < TD-MA DS < TD-MA on som e asp ects of task; D S~TD-MA o n other aspec ts Ni chols
2004 [57
]
MA-matched
TD
SLI WS Focal
Table 1 Studies Examining LTM Skills in Individuals with DS Organized by Age Group and Presented Chronologically (Continued) Study Comparison Group Matching Assessm ent CA of DS group (Yrs) MA of DS group (Yrs) Task Finding s Bir d
2004 [158
] NVMA -matched TD SB M=16. 4 (Range= 12 -20) M=5 .4 Verb al LTM Im mediate & Del ayed Story Reca ll (wit h embedd ed nov el, nons ense words) DS<TD-NVMA on imme diate not de layed verbat im story rec all (which inc luded nonsens e words ) Vi cari 200 5 [ 62 ] MA-matched TD SB M=16 (Range= 8-30 ) M=5 .3 Visu al and Sp atial LTM Visua l-Ob ject Learning Visua l-Spatial Learning DS < TD-MA DS ~ TD-MA
Jarrold, 2007 [55
] WS group TD Not match ed M=13 (Range= 10-1 6) M=5 .3 Verb al and Visual LTM Peo ple Te st – verbal recall Shap es Test – vis ual recall DS ~ TD DS < TD; DS~W S Vi su-Petr a 200 7 [ 120 ] MA-matched TD SB M=14 (Range= 8-21 ) M=5 .75 Visu al & Spat ial LTM Del ayed Matc h to Sampl e Pai red Associates Learn ing Nu mber of Stages Co mpleted Sp atial Recog nition Mem ory DS < TD-MA DS < TD-MA DS < TD-MA Ed gin
2010 [25
] IQ-matched WS group WASI M=17. 8 – Verb al and Visual LTM NEPS Y List Lea rning CAN TAB Pai red Associ ates Nu mber of Stages Co mpleted DS > WS DS > WS Hei mann
2016 [61
] TD, Langu age-matched ASD – M=5.2 5 (SD=1. 03) M=2 .63 (SD= .72) Visu al LTM Defe rred Imit ation DS ~ TD DS > ASD Adul t and Older adult studies (18 yea rs and older) Dalt on
1974 [159
] Young and Old ID group – Young M= 20.9 Interm ediate M=4 1.7 Old M= 50.8 (Range =19-58) – Visu al LTM Del ayed Matc hing to Sampl e Young DS < Young & Old ID; Young DS = Interme diate DS Interme diate DS < Old ID; Interme diate DS = Young ID Old DS < all other DS and ID groups Varnhage n
1987 [64
] IQ-matched ID group SB M=22. 70 (Range= 19-2 5) M=4 .78 Verb al LTM Lex ical Ac cess – a measu re of lexic al LTM access de rived from verb al measu res DS < ~ ID (p =.06)
Ellis 1989 [160
] TD group (matche d roughly on CA) – M=26. 8 (Range= 14-5 1) – Visu al LTM Pict ure Re call Pict ure Lo cation Recall DS < TD col lege students DS < TD col lege students Deve nny
1992 [161
Table 1 Studies Examining LTM Skills in Individuals with DS Organized by Age Group and Presented Chronologically (Continued) Study Comparison Group Matching Assessm ent CA of DS group (Yrs) MA of DS group (Yrs) Task Finding s Bru gge
1994 [63
] CA-mat ched ID group – M=31 (Range= 22-5 1) – Verb al LTM CVL T DS<ID on variou s scores CVLT Short Delay Sav ings score predictive o f group. DS performance inversely related to age
Simon 1995 [70
] IQ-matched ID & CA-mat ched TD – M=30 – Verb al and Visual LTM Word Recall Faci al Recog nition Pict ure Re call DS < TD-C A; DS~ID DS ~ ID; DS<T D-CA DS < ID & TD-CA Deve nny
1996 [65
] Young DS (CA 30-39) Middle-Aged DS (CA 40-49) Old DS (CA 50+) ID group wit h similar IQ & Age Sub test s of WIS C -R were u sed to esti mate IQ Young DS M=37 Middle-Aged DS M=4 5 Older DS M=5 5 -Verb al LTM Sele ctive Reminding Test (SRT) – word recall Par ticipants were tested at 6 time points across 5 yea rs DS: Les s im provement than ID on rep eated testing Young DS ~ Improve ment on SRT acr oss time point s Middle-Aged and O lder DS ~ Decrease in SRT acr oss time point s *Note: This st udy focus ed on a more mi ldly im pacted sub group of adult s with DS Dul aney
1996 [71
] CA-matc hed TD; ID – M=33. 6 (SD=6. 8) – Visu al & Spat ial LTM Pict ure Re cogn ition Sp atial Loca tion Reca ll of pict ures DS < TD-C A; DS ~ ID DS < TD-C A; DS ~ ID Vi cari 200 0 [ 36 ] MA-matched TD SB M= 21 M=6 .5 Verb al and Visual LTM Word Recall Pict ure Re cogn ition Sp atial Sequ ence Lea rning DS <TD-M A on wo rd recal l; DS > TD-MA on false alarms DS < TD-MA on pict ure recogni tion; DS > TD-MA on false alarm s DS > TD-MA on num ber of trials to learn se quence *high er numbe r of trials indi cates worse performance Krinsky-McHa le
2005 [162
] IQ Matc hed WS ID M=44. 36 (SD =5.56) Verb al LTM Sele ctive Reminding Task For bot h DS and WS, num ber of words recal led de creas ed with age; not obse rved in ID group Davis 201 4 [ 67 ] MA-matched TD and ID Leiter-R evised Brief Form & KBIT-2 M~18 M=5 .0 Spat ial LTM Rou te Learning Reca ll DS< TD-M A & ID Pu rser
2015 [69
] WS group TD group (similar me ntal age) – M=18 (Range= 10-3 9) – Visu al Spat ial LTM Rou te Learning Task – Errors DS > TD & WS (erro rs) Lave nex
2015 [68
Table 1 Studies Examining LTM Skills in Individuals with DS Organized by Age Group and Presented Chronologically (Continued) Study Comparison Group Matching Assessm ent CA of DS group (Yrs) MA of DS group (Yrs) Task Finding s With in DS Group Comp arison s of Old er Adults Haxb y
1989 [163
] 35+ DS (4 with de menti a) Under 35 DS – Unde r 35 M=2 6 35+ non-deme nted M=48 35+ de mented M=57 Un der 35 M= 6.1 35+ non-de mented M=4 .3 35+ demente d M=2 .5 Visu al LTM Hid den Objec t Mem ory Recog nition for Designs 35+ Non-d ement ed DS < Unde r 35 D S; d e mented DS not compared All 35+ DS (dem ented & non-de mented) < Under 35 DS Alexan der
1997 [66
] Young DS (CA 22-38) Old DS wit hout demen tia (CA 41-61) – Young DS M=30.1 Old DS M=47.4 You ng DS M=5 .7 Old DS M=4 .7 Visu al LTM Hid den Objec t Mem ory (10-second delay) Hid den Objec t Mem ory (2-m inute de lay) Old DS < You ng DS Old DS < You ng DS Cray ton
1998 [72
] Young DS (CA Under 40) Middle-Aged DS (CA 40-4 9) Older DS (CA 50+) –– M =4.8 (for whole group o n BPVS) Visu al and Sp atial LTM Patt ern Re cognit ion Sp atial Recog nition Del ayed Ass ociative learn ing Young DS ~ Middle-Aged DS ~ Older DS Middle Age d DS < Young DS Older DS < You ng D S Ho n
1998 [73
] Young DS (CA 30-44) Old DS (CA 45-65) -10 with AD – Overall M=42.6 – Verb al and Visual LTM Riv ermead -Name Lea rning Riv ermead -Face Learn ing Riv ermead -Route Lea rning Riv ermead-Story Re call Old DS < You ng DS Old DS < You ng DS Old DS < You ng DS Old DS < You ng DS Dalt on
1999 [164
] Young DS (C A 17 -39) Old DS (C A 40 -58) –– – Visu al LTM Matc hing to Sampl e (25 se cond de lay) Old DS < You ng DS Krin sky-McHale
2002 [18]
DS with de mentia (DS+DAT ) DS witho ut Deme ntia (DS) DS+DA T Fema les M=5 2.23 Males M-45 .32 DS Fema les M=4 2.06 Males M=4 4.36 – Verb al LTM Sele ctive Reminding Test (wo rd list recal l) DS+DAT greater de cline in performance ov er 3 years relative to DS Older DS+DAT & DS greater decline in performance over 3 years than You nger DS & DS+ DAT Deve nny
2002 [165
cortex while rehearsal is thought to involve the left
premotor cortex, Broca’s area, and supplementary
motor cortex (for a review, see [81]). In contrast, visual storage is thought to rely upon the right anterior occipital cortex, while rehearsal is thought to involve the right posterior parietal and premotor cortex (for a review, see [81]).
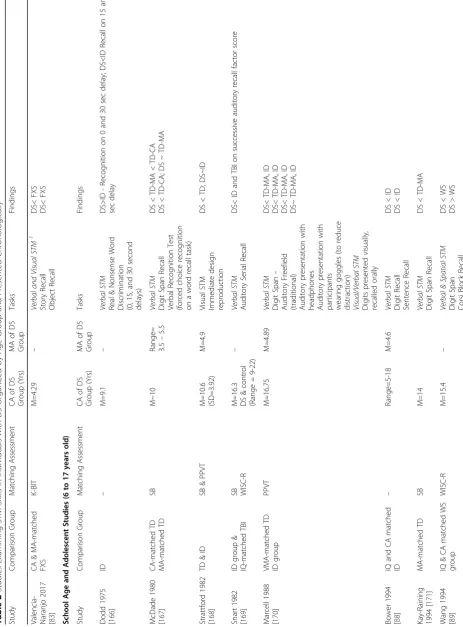
To assess STM, visual or verbal span tasks are typically administered, such as Corsi Span or Digit Span, respect-ively, in which individuals must recall a sequence of blocks (visual) or digits (verbal) verbatim [82]. Other ex-amples of STM tasks include immediate subspan word list recall (verbal), pattern recall (visual), and picture location recall (visual). We summarize the existing literature by age group in the sections that follow. In addition, we pro-vide details about studies of STM in DS in Table 2, and age-effect size relations are displayed in Fig. 2.
Preschool studies (3 to 5 years old)
Very limited research exists that examines STM abilities in very young children with DS. Existing research sug-gests impairment relative to youth with FXS [83]. How-ever, it is clear that more STM research is needed during this developmental period. With that, we turn to studies during the school-age and adolescent period.
School age and adolescent studies (6 to 17 years old) During childhood and adolescence, the vast majority of research suggests that individuals with DS perform worse than MA-matched peers on verbal STM tasks such as digit span and immediate word list recall (e.g., [9, 49, 84]). Additionally, research suggests children and adolescents with DS make smaller gains on verbal STM tasks across development in comparison to MA-matched TD children, and this deficit becomes worse
with age [85–87].
The majority of research comparing DS to ID groups has found adolescents with DS show greater verbal STM impairments than other ID groups, as well as children with speech language impairments, and children with
focal brain lesions (e.g., [84, 88–90]). However, research
findings are mixed, with several researchers reporting comparable verbal STM skills to those with other forms of ID (e.g., [58, 91]).
In comparison to their verbal STM abilities, adoles-cents with DS have relatively stronger nonverbal STM skills [92]. However, findings regarding whether these skills are below mental age expectations when compared to typically developing youth and youth with other forms of ID are variable. In comparison to TD youth, most stud-ies suggest comparable or poorer performance on
nonver-bal STM tasks (e.g., [93–95]). In comparison to other ID
groups, most studies report comparable or stronger per-formance (e.g., [25, 58, 96, 97]). Therefore, while research
has demonstrated nonverbal STM skills are a relative strength compared with verbal STM abilities within DS, findings are mixed with regard to whether these skills dif-fer from those observed in TD or ID peers matched on mental age during this time period.
Adult and older adult studies (18 years and older) As individuals with DS age, research has shown STM abilities remain impaired. Compared to MA-matched controls, including both verbal-matched and nonverbal-matched controls, young adults with DS are significantly impaired on verbal STM tasks such as digit and word
re-call tasks [98–100]. Additionally, DS groups perform
worse in comparison to MA-matched TD controls on tests requiring recall of a missing item (item memory) or an entire list (serial memory) [101].
Research comparing adults with DS to those with other forms of ID on verbal STM tasks is mixed. While the majority of studies demonstrate greater impairments relative to other ID groups (e.g., [102, 103]), several studies report similar levels of impairment ([64, 104]), and a recent study that compared adults with DS to adults with Cornelia de Lange syndrome revealed stron-ger performance in the DS group [105].
Although research has suggested that nonverbal STM abilities are relatively stronger than verbal STM skills in DS [106], few studies have compared nonverbal STM in DS to MA-matched controls or other ID groups in adulthood. The limited data suggest that adults with DS perform comparably to TD comparison subjects with similar mental ages (e.g., [107, 108], but see [36]), and other adults with ID (e.g., [65, 109]), suggesting that nonverbal STM impairments are relatively in line with mental age during adulthood.
STM across development in DS
We have summarized the effect size data from past studies in Fig. 2, which depicts STM effect sizes relative to
MA-matched comparison subjects using Cohen’s dorganized
by age and task modality. (See Table 2 and Additional file 1: Table S1 for greater details about the studies and tasks
in-cluded in Fig. 2.) The average Cohen’s dvalue collapsed
across verbal and nonverbal STM studies was−0.91. This
large effect was driven by studies of verbal STM for which
the effect size was large (−1.40), suggesting significant
im-pairments in excess of overall cognitive limitations. In
contrast, the small effect size for nonverbal STM of−0.32
suggests that nonverbal abilities only slightly deviate from mental age expectations.
nonverbal STM, effect size data are limited to a very re-stricted age range, with the preponderance of studies be-tween the ages of 11 and 14. These data suggest nonverbal STM performance is somewhat weaker than MA-matched peers, although this is based primarily on inconsistent findings across studies with adolescents.
Working memory
WM, or“working with memory”[110], refers to the
abil-ity to maintain and manipulate information for a brief period of time. Similar to STM, WM involves temporary storage of limited amounts of information, but it also re-quires maintenance and attention while simultaneously processing information, avoiding distraction, and/or en-gaging in cognitive shifting [111, 112]. As reviewed by Wager and colleagues [113], WM activates a wide net-work of neural regions, including numerous frontal and parietal regions. These regions appear to differ based on the nature of the tasks. For example, in tasks requiring updating and sequencing information, the dorsolateral prefrontal cortex and the superior frontal sulcus are in-volved, while manipulation tasks require the ventral and anterior prefrontal cortex.
Assessments of WM are often similar to STM, with additional components requiring increased attention and/or manipulation of the to-be-remembered stimuli. Verbal WM tasks include digit span backward, backward word span recall, and selective word recall (e.g., hearing multiple lists of words and recalling the first word from each list after the presentation of all of the lists). Non-verbal WM tasks include spatial span backward or tasks that require recall of the first step in a series of steps.
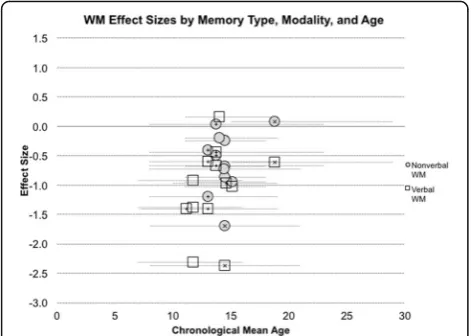
Overall, research on WM abilities in DS remains lim-ited across the lifespan. Very few studies have examined these abilities in early childhood or in adulthood. How-ever, the majority of research studies report that adoles-cents and young adults with DS perform below MA expectations on both verbal and nonverbal WM tasks. Existing studies are summarized in detail in Table 3 and age-effect size relations are illustrated in Fig. 3.
Preschool studies (3 to 5 years old)
No studies of which we are aware have examined WM abilities using direct cognitive assessment in young chil-dren with DS. This is likely due to the complexity of such tasks and difficulties adapting WM tasks to be under-standable to very young children. Thus, we turn our atten-tion to studies of school-age children and adolescents.
School age and adolescent studies (6 to 17 years old) Similar to performance on verbal STM tasks, children and adolescents with DS are significantly impaired on verbal WM tasks. With few exceptions (e.g., [9]), youth with DS perform significantly worse on verbal WM tasks
compared to MA-matched children and this deficit
in-creases as the task difficulty inin-creases (e.g., [92, 114–
116]). Furthermore, even when matching children on vo-cabulary abilities or reading comprehension abilities, children with DS consistently perform worse than TD children on verbal WM tasks [117]. In contrast to the consistent findings relative to MA-matched peers, the limited studies available have provided conflicting results when comparing performance of groups with DS to other ID groups [25, 90, 118].
Analogous to verbal WM findings, many studies suggest that children and adolescents with DS have significant non-verbal WM impairments compared with MA-matched
peers [90, 92, 115–117, 119]. However, findings are mixed
with several studies noting similar performance to MA-matched TD participants [9, 119, 120]. In comparison to other ID groups, findings are also mixed; some studies (e.g., [25]) found children with DS have comparable nonverbal WM abilities, while others have reported greater impair-ments compared to other ID groups [90, 118, 121]. There-fore, further research is needed to determine if nonverbal WM is a deficit beyond MA expectations and if this deficit is unique to DS.
Adult and older adult studies in DS
Research regarding WM abilities in adults with DS is very limited. The available data indicate that adults with DS perform worse than MA-matched TD individuals on verbal WM tasks [108, 122], yet do not significantly dif-fer from other ID groups [123]. With regard to nonver-bal WM abilities in adults with DS relative to TD comparison groups, only one study has examined this and reported comparable performance [108]. In com-parison to other ID groups, the very limited data sug-gests comparable performance as well [105, 123]. However, research examining aging in DS (without a TD comparison group) suggests declining executive function abilities beginning in middle adulthood and that these abilities are one of the first cognitive skills to deteriorate
in the early stages of dementia [124–126]. Because WM
is thought to be a form of executive functioning, studies that examine WM from adolescence into young and middle adulthood may help to identify precursors to de-mentia in those individuals with DS who will go on to develop it.
WM across development in DS
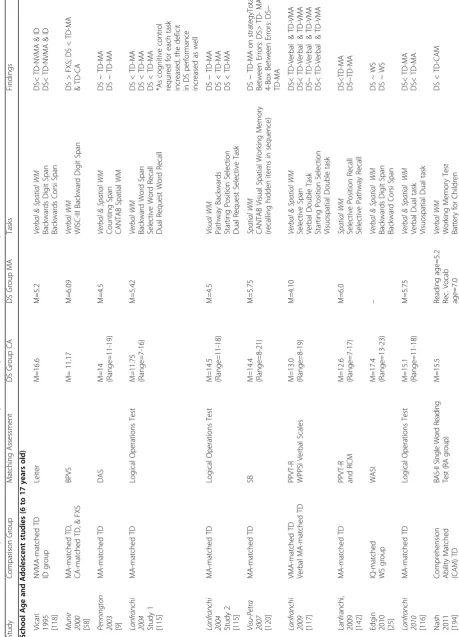
The effect size findings of past studies are summarized in Fig. 3. (See Table 3 and Additional file 1: Table S1 for greater details about the studies and tasks included in Fig. 3). As can be seen, the majority of WM studies have been conducted with adolescents. Thus, our ability to de-scribe WM abilities across the lifespan in DS is quite
Table
2
Studies
Examining
STM
Skills
in
Individuals
with
DS
Organized
by
Age
Group
and
Presented
Chronologically
Study
Comparison
Group
Matc
hing
Ass
essment
CA
of
DS
Grou
p
(Yrs)
MA
of
DS
Group
Tasks
Fin
dings
Valenc
ia-Naran
jo
20
17
[
83
]
CA
&
MA
-matched
FXS
K-BI
T
M=4
.29
–
Verbal
and
Visual
STM
1
Story
Reca
ll
Object
Re
call
DS<
FXS
DS<
FXS
Schoo
l
Age
and
Adole
scent
S
tudies
(6
to
1
7
yea
rs
old)
Study
Comparison
Group
Matc
hing
Ass
essment
CA
of
DS
Grou
p
(Yrs)
MA
of
DS
Group
Tasks
Fin
dings
Dodd
1975
[
166
]
ID
–
M=9
.1
–
Verbal
STM
Real
&
Nons
ens
e
Word
Discrimi
nation
(0,
15,
and
30
second
delays)
DS>ID
-Recogn
ition
on
0
and
30
sec
de
lay;
DS<ID
Recall
on
15
and
30
se
c
delay
McDad
e
1980
[
167
]
CA-mat
ched
TD
MA-matched
TD
SB
M~1
0
Rang
e=
3.5
–
5.5
Verbal
STM
Digit
Span
Re
call
Verbal
Recog
nition
Test
(forced
choi
ce
rec
ognition
on
a
wo
rd
recal
l
task
)
DS
<
TD-MA
<
TD-CA
DS
<
TD-CA;
D
S
~
TD-MA
Strattfo
rd
1982
[
168
]
TD
&
ID
SB
&
PPVT
M=1
0.6
(SD=
3.92)
M=4.9
Visual
STM
Immedi
ate
design
reproduction
DS
<
TD;
DS~ID
Snart
1982
[
169
]
ID
group
&
IQ-matched
TB
I
SB WISC
-R
M=1
6.3
DS
&
control
(Ran
ge
=
9-22
)
–
Verbal
STM
Auditory
Serial
Recall
DS<
ID
and
TB
I
o
n
successive
aud
itory
recall
factor
score
Marcell
1988
[
170
]
VMA-mat
ched
TD
ID
group
PPVT
M=1
6.75
M=4.8
9
Verbal
STM
Digit
Span
–
Auditory
Freefiel
d
(tradition
al)
Auditory
presen
tation
wit
h
headpho
nes
Auditory
presen
tation
wit
h
participan
ts
wearing
go
ggles
(to
reduce
distraction) Visual/Verbal
STM
Digits
presen
ted
vis
ually,
recalled
orall
y
DS<
TD-MA,
ID
DS<
TD-MA,
ID
DS<
TD-MA,
ID
DS~
TD-MA,
ID
Bower
1994
[
88
]
IQ
and
CA
mat
ched
ID
–
Rang
e=5
-18
M=4.6
Verbal
STM
Digit
Reca
ll
Sentenc
e
Reca
ll
DS
<
ID
DS
<
ID
Kay-Rai
ning
1994
[
17
1
]
MA-matched
TD
SB
M=1
4
Verbal
STM
Digit
Span
Re
call
DS
<
TD-MA
Wang
19
94
[
89
]
IQ
&
CA
match
ed
WS
group
WISC
-R
M=1
5.4
–
Verbal
&
Spat
ial
STM
Digit
Span
Corsi
Block
Reca
ll
DS
<
WS
DS
>
Table 2 Studies Examining STM Skills in Individuals with DS Organized by Age Group and Presented Chronologically (Continued) Study Comparison Group Matc hing Ass essment CA of DS Grou p (Yrs) MA of DS Group Tasks Fin dings Belac chi 20 14 [ 108 ] NVMA and SES matched TD RCM M=1 8.8 (Ran ge=15 -29) MA~5.5 Verbal & Visu al STM Word Reca ll Spatial-simultaneou s Reca ll DS< TD-NV MA DS ~ TD-NV MA Stavrou ssi 2016 [ 10 4 ] CA & VMA ID group PPVT -R M=3 3.92 (Ran ge=26 -38) – Verbal STM Digit Span Re call DS ~ ID Reid 20 17 [ 105 ] Corne lia de Lange Syndrom e group (CdLS) – M= 24.38 (SD= 5.82) M=6.2 9 (BPVS ) Verbal & Visu al STM Digit Span Corsi Span DS > CdLS DS > CdLS With in DS Group Comp arison s of Old er Adults Study Comparison Group Matc hing Ass essment CA of DS Grou p (Yrs) MA of DS Group Tasks Fin dings Haxb y 1989 [ 163 ] Under 35 DS 35+ DS (4 with de mentia) – Un der 35 M=2 6 (Ran ge=19 -34) 35+ non-de mented M=4 8 (Ran ge=37 -54) 35+ demen ted M=5 7 (Range = 47-6 4) Unde r 35 M= 6.1 35+ non-deme nted
M=4.3 35+ deme
collapsed across verbal and nonverbal WM studies is − 0.81, suggesting a large effect. The mean effect sizes for ver-bal WM and nonverver-bal WM considered individually are
medium to large (verbal WM Cohen’sd=−1.0; nonverbal
WM Cohen’sd=−0.58). Thus, there is a suggestion that
WM impairments are significantly greater than global cog-nitive impairments in DS in adolescence, but more research is needed earlier and later in development.
Discussion
In this review, we summarized the literature on memory impairments in DS from a developmental perspective by grouping studies into three developmental periods: pre-school, school-age and adolescence, and adulthood. We presented findings on LTM, STM, and WM (distinguish-ing between the verbal and nonverbal modalities) and examined the degree of impairment (measured using
Cohen’s d) relative to mental age-matched TD controls
across studies in each domain. In addition, we summa-rized the results of studies in which DS performance was compared to that of another ID group to evaluate the degree to which the reported impairment appeared to be specifically associated with DS or rather a more general correlate of intellectual disability. These findings are summarized in the sections that follow.
With only a few exceptions [35, 55, 61, 62], our review of LTM abilities suggests impairment across development in excess of overall cognitive impairment. As it is difficult to study verbal LTM in young children, the existing litera-ture on DS identifies impairment in excess of overall cog-nitive abilities (i.e., below mental age) by adolescence and continuing into adulthood. Turning to nonverbal LTM, there is evidence for impairments in excess of global learning difficulties beginning during the preschool period (e.g., [36, 54, 69], but see [35]) and continuing through the school-age years and into adulthood (see Table 1 and Fig. 1). Additionally, a review of findings across develop-ment suggests that LTM impairdevelop-ments may be somewhat greater later in life. However, this observation is very ten-tative, as the appropriate research studies have not been conducted to truly describe changes in LTM across the lifespan. Thus, further research should examine the rela-tion between age and nonverbal LTM impairment through longitudinal investigations that track the same participants over the course of development and, importantly, com-pare performance not only to mental age expectations but also to chronological age expectations. This latter com-parison will provide a true evaluation of trajectory
differ-ences between individuals with DS and typically
developing peers, thus providing a better estimate of how LTM skills in DS deviate from age expectations over time.
Our review provided support for the presence of a sig-nificant verbal STM impairment compared to
MA-matched typically developing groups. This impairment was evident from the school-age years and persisted into adulthood. In contrast, research findings on nonverbal STM abilities (particularly during the school age/adoles-cent period) are mixed. Yet, it is important to note that our review of effect sizes for nonverbal STM suggests a
small effect (−.32) relative to TD controls matched
on mental age overall. This effect is substantially
smaller than that seen for verbal STM (−1.4), suggesting
that STM is not universally below mental age expec-tations in DS. Rather, impairments are much more pronounced when verbal STM is considered (see Table 2 and Fig. 2).
Research on WM abilities in DS across the lifespan is extremely limited. This is in part due to the fact that the majority of research examining limited capacity memory systems used traditional STM tests, rather than WM tests (i.e., tasks that require short-term retention and manipulation of the to-be-remembered material). None-theless, the preponderance of studies report that verbal WM abilities are below MA expectations from adoles-cence into adulthood. Studies evaluating nonverbal WM present varying results relative to mental age-matched TD groups. Unfortunately, we are limited in what we can say about WM (verbal and nonverbal) abilities in adulthood, as studies are sparse. Due to the scar-city of WM research across different developmental periods and the potential impact it could have for clinical care and interventions in DS, future research is needed to provide a better understanding of WM abilities across the lifespan in this population.
Table 3 Studies Examining WM Skills in Individuals with DS Organized by Age Group and Presented Chronologically Study Co mparison Group Match ing Asses sment D S Group CA DS Group MA Task s Fi ndings Schoo l Age and Adole scent stud ies (6 to 17 yea rs old)
Vicari 1995 [118
] NV MA-matched TD ID group Leiter M=1 6.6 M=5.2 Verb al & Spat ial WM Back wards Digit Sp an Back wards Corsi Span D S< TD-N VMA & ID D S< TD-N VMA & ID Mun ir 200 0 [ 58 ] MA -ma tched TD, CA-m atche d TD, & FXS BPVS M= 11.17 M=6.09 Verb al WM WI SC-III Backward Digit Span D S > FXS; DS < TD-M A & TD-C A Penning ton 200 3 [ 9 ] MA -ma tched TD DAS M=1 4 (Ran ge=11 -19) M=4.5 Verb al & Spat ial WM Count ing Sp an CAN TAB Sp atial WM D S ~ TD-MA D S ~ TD-MA Lanf ranchi 200 4 Stud y 1 [ 115 ] MA -ma tched TD Logical O perations Test M=1 1.75 (Ran ge=7-1 6) M=5.42 Verb al WM Back ward Word Sp an Sele ctive Word Reca ll Dual Re quest Word Reca ll D S < TD-MA D S < TD-MA D S < TD-MA *As cognit ive cont rol req uired for each task inc reased, the deficit in DS pe rformanc e inc reased as well Lanf ranchi 200 4 Stud y 2 [ 115 ] MA -ma tched TD Logical O perations Test M=1 4.5 (Ran ge=11 -18) M=4.5 Visu al WM Path way Backwards Start ing Positi on Selec tion Dual Re quest Selec tive Task D S ~ TD-MA D S < TD-MA D S < TD-MA Vi su-Petr a 200 7 [ 120 ] MA -ma tched TD SB M=1 4.4 (Ran ge=8-2 1) M=5.75 Spat ial WM CAN TAB Vis ual Spatial Working Mem ory (rec alling hidd en items in seque nce) D S ~ TD-MA on strat egyTot al Be tween Error s: DS> TD-MA 4-B ox Between Error s: DS~ TD-M A Lanf ranchi 200 9 [ 117 ] VM A-matche d TD Ve rbal MA-matched TD PPVT-R WPPSI Verbal Scal es M=1 3.0 (Ran ge=8-1 9) M=4.10 Verb al & Spat ial WM Sele ctive Span Verbal Double Task Start ing Positi on Selec tion Visuos patial D ouble task D S< TD-V erbal & TD-VM A D S< TD-V erbal & TD-VM A D S~ TD-V erbal & TD-VM A D S< TD-V erbal & TD-VM A Lanf ranc hi,
2009 [142
] MA -ma tched TD PPVT-R and RCM M=1 2.6 (Ran ge=7-1 7) M=6.0 Spat ial WM Sele ctive Position Re call Sele ctive Pathway Reca ll D S<TD-MA D S~TD-MA Ed gin
2010 [25
] IQ-m atche d WS group WASI M=1 7.4 (Ran ge=13 -23) – Verb al & Spat ial WM Back wards Digit Sp an Back ward Corsi Sp an DS ~ W S DS ~ W S Lanf ranchi 201 0 [ 116 ] MA -ma tched TD Logical O perations Test M=1 5.1 (Ran ge=11 -18) M=5.75 Verb al & Spat ial WM Verbal Dual task Visuos patial D ual task D S< TD-MA D S< TD-MA Nas h
2011 [194
Table 3 Studies Examining WM Skills in Individuals with DS Organized by Age Group and Presented Chronologically (Continued) Study Co mparison Group Match ing Asses sment D S Group CA DS Group MA Task s Fi ndings Neale Analysis of Readi ng Ability II (C AM group) Lanf ranchi 201 2 [ 119 ] VM A-matche d TD PPVT-R evise d M=1 3.7 (Ran ge=8-2 3) M=5.25 Verb al & Spat ial WM Sele ctive Word Rec all Verb al Dua l task Verb al/Visuospati al Task Sele ctive Pathwa ys Rec all Visuos patial D ual Task Visuos patial /Verbal Task D S < TD-VM A D S < TD-VM A D S < TD-VM A D S ~ TD-VM A D S < TD-VM A D S < TD-VM A Bo rella 201 3 [ 114 ] VM A-matc hed TD PPVT-Revis ed M=1 4.6 (Ran ge=10 -19) M=5.58 Verb al W M Verbal Dual Task D S < TD-VM A Cos tanzo 201 3 [ 90 ] WS group & NV MA-matched TD Leiter-R evised (for all but 1 particip ant who rece ived SB) M= 14.5 (Ran ge=8-2 1) M=6.2 Verb al & Spat ial WM Back ward Digit Span Back ward Corsi Sp an D S< TD-N VMA: DS<W S D S< TD-N VMA; DS~W S Carne y
2013 [92
] TD particip ants with sim ilar MA SB Abbreviated Batt ery M=1 3.6 (Ran ge=10 – 18) M=6.0 Verb al & Spat ial WM Lis tening Sp an Odd One O ut -determini ng od d figur e out of 3 figur es, then rec alling figu re po sition DS < TD DS < TD Trez ise
2014 [121
] CA and NVMA-m atche d ASD +ID and Non specific ID Wec hsler Nonverbal Scal e of Abi lity: Spatial Span MA sco re M=1 4.84 (Ran ge=10 -18) M=8.19 Verb al & Visual WM Word Repeti tion Recog nition Line D rawing Recog nition D S < ID; DS~AS D+ID D S < ID; DS~AS D+ID Adul t and Older adul t studies (18 yea rs and older) Nu mmine n
2001 [123
] NV IQ-m atche d ID group RCM M=4 1.8 (Ran ge=38 -48) M=5.03 Verb al & Spat ial WM Digi t Span Back ward Visuos patial Te st (rec all of pattern s) D S~ID D S~ID Roc h
2012 [122
Table
3
Studies
Examining
WM
Skills
in
Individuals
with
DS
Organized
by
Age
Group
and
Presented
Chronologically
(Continued)
Study
Co
mparison
Group
Match
ing
Asses
sment
D
S
Group
CA
DS
Group
MA
Task
s
Fi
ndings
Reid 2017 [105
]
Co
rnelia
de
Lan
ge
Sny
drome
group
(CdLS)
–
M=
24.38
(SD=5.82)
M=6.29 (BPVS)
Verb
al
&
Visual
WM
Digi
ts
Sp
an
Backwards
Corsi
Bac
kwards
D
S~CdLS
D
S~CdLS
Ke
y:
Co
mpa
rison
G
rou
ps
:
CA
ch
ro
no
lo
gi
cal
-ag
e,
DS
Do
wn
Sy
ndr
o
me
,
ID
In
tel
lectua
l
Disab
ility,
MA
me
nt
al
-ag
e
,
NVM
A
No
nv
er
b
al
m
e
n
ta
l-ag
e,
TD
typica
lly-dev
el
opi
ng,
VMA
Vo
cabulary
(recept
ive)
m
ental-age
,
WS
Wil
lia
m
’
sS
yn
d
ro
m
e
Tests:
BAS
British
Ability
Scales,
DAS
Differential
Ability
Scales,
Leiter
Leiter
Performance
Intelligence
Scales,
PPVT-R
Peabody
Picture
Vocabulary
Test-Revised,
RCM
Raven
’
s
Coloured
Matrices,
SB
Stanford
Binet
Intelligence
Scale,
WASI
Wechsler
Abbreviated
Scale
of
Intelligence,
WPPSI
Wechsler
Preschool
and
Primary
Scale
of
Intelligence
Note
:
Italicized
authors
’
names
indicate
studies
included
in
effect
size
Thus, based on our review of the literature, there ap-pears to be a lack of conclusive evidence regarding whether STM, LTM, and WM impairments in DS differ in degree from those in the other ID groups. Of all of the domains and modalities reviewed, there is the great-est evidence that verbal STM impairments are weaker than in other ID groups. However, given that findings are mixed, strong conclusions about the specificity of this deficit to DS cannot be made. Such mixed findings across LTM, STM, and WM suggest that impairments in memory may characterize ID more generally. However, given the limited number of studies for certain domains, particularly LTM and WM (especially in adulthood), it appears that future research is needed to answer this question. One area that could benefit from greater re-search in the future is the study of WM in adulthood (both comparing DS to ID and TD groups). Such re-search may inform studies examining the development of AD in adults with DS, given that research suggests that executive function (which includes working memory as a subdomain) impairments are among the first to
emerge in those with DS who develop AD [124–126].
Having summarized the existing behavioral literature on memory impairments in DS, we now turn to a brief review of the neural correlates of memory and how these can be conceptualized within the context of
the DS neural phenotype. Given the profound
impairments in explicit memory systems observed in individuals with DS, the medial temporal lobes and the hippocampal formation in particular have been the focus of several neuroimaging investigations in DS. Consistent with conclusions drawn from behav-ioral memory studies, imaging studies have docu-mented reduced volume in the hippocampi and connectivity disturbances in the limbic system of
in-dividuals with DS across the lifespan [128–131].
Turning to STM and WM, studies of these skills in those with typical development and those with ac-quired lesions have identified the central roles of the parietal and frontal lobes for the completion of such tasks [132, 133]. Consistent with these findings,
neu-roimaging investigations have revealed that in
addition to reduced whole-brain volume, children and adults with DS have reduced frontal gray matter volume and parietal white matter volume, as well as lower levels of activation in the parietal lobes
com-pared to TD peers [128, 134–136]. Moreover, youth
with DS have increased cortical thickness in the frontal and parietal lobes, suggesting possibly less
“mature” cortex in these brain regions [137].
Further-more, because STM and WM processes require inter-action between cortical regions and the hippocampus
([77–80]), behavioral data suggest impairment in
Fig. 1LTM effect sizes from past studies, divided by presentation modality. Effect sizes calculated using Cohen’sd((DS group mean–control group mean)/pooled standard deviation) for studies that reported effect size data. An effect size of zero indicates equivalent performance between the DS and control group. A total of 16 effect sizes were calculated for LTM. All control groups were typically developing children matched on overall mental age abilities. Lower scores indicate worse impairment. Although a greater number of LTM studies exist, the data provided in additional studies precluded the calculation of effect sizes or did not meet our criteria for inclusion. Descriptions of studies included in this figure can be found in Table 1 and Additional file 1: Table S1 (for detailed task descriptions)