www.geosci-model-dev.net/7/3153/2014/ doi:10.5194/gmd-7-3153-2014
© Author(s) 2014. CC Attribution 3.0 License.
ORACLE (v1.0): module to simulate the organic aerosol
composition and evolution in the atmosphere
A. P. Tsimpidi1, V. A. Karydis1, A. Pozzer1, S. N. Pandis2,3, and J. Lelieveld1,4 1Max Planck Institute for Chemistry, Mainz, Germany
2Department of Chemical Engineering, University of Patras, Patras, Greece
3Department of Chemical Engineering, Carnegie Mellon University, Pittsburgh, PA, USA 4Energy, Environment and Water Research Center, Cyprus Institute, Nicosia, Cyprus Correspondence to: A. P. Tsimpidi ([email protected])
Received: 13 July 2014 – Published in Geosci. Model Dev. Discuss.: 12 August 2014 Revised: 31 October 2014 – Accepted: 23 November 2014 – Published: 21 December 2014
Abstract. A computationally efficient module to describe or-ganic aerosol (OA) partitioning and chemical aging has been developed and implemented into the EMAC atmospheric chemistry–climate model. The model simulates the forma-tion of secondary organic aerosol (SOA) from semivolatile (SVOCs), intermediate-volatility (IVOCs), and volatile or-ganic compounds (VOCs). It distinguishes SVOCs from biomass burning and all other combustion sources using two surrogate species for each source category with an ef-fective saturation concentration at 298 K of C∗=0.1 and 10 µg m−3. Two additional surrogate species withC∗=103 and 105µg m−3are used for the IVOCs emitted by the above source categories. Gas-phase photochemical reactions that change the volatility of the organics are taken into account. The oxidation products (SOA-sv, SOA-iv, and SOA-v) of each group of precursors (SVOCs, IVOCs, and VOCs) are simulated separately to keep track of their origin. ORACLE efficiently describes the OA composition and evolution in the atmosphere and can be used to (i) estimate the relative con-tributions of SOA and primary organic aerosol (POA) to to-tal OA, (ii) determine how SOA concentrations are affected by biogenic and anthropogenic emissions, and (iii) evaluate the effects of photochemical aging and long-range transport on the OA budget. We estimate that the global average near-surface OA concentration is 1.5 µg m−3and consists of 7 % POA from fuel combustion, 11 % POA from biomass burn-ing, 2 % SOA-sv from fuel combustion, 3 % SOA-sv from biomass burning, 15 % SOA-iv from fuel combustion, 28 % SOA-iv from biomass burning, 19 % biogenic SOA-v, and
15 % anthropogenic SOA-v. The modeled tropospheric bur-den of OA components is 0.23 Tg POA, 0.16 Tg SOA-sv, 1.41 Tg SOA-iv, and 1.2 Tg SOA-v.
1 Introduction
Atmospheric aerosols adversely affect air quality and human health, and play an important role in climate change. De-pending on the physicochemical properties, aerosols affect the energy budget of the Earth’s atmosphere by scattering and absorbing solar radiation (direct effect) and influencing the reflective properties of clouds, their lifetime, and precipi-tation formation (indirect effects). Organic aerosol (OA) is an important constituent of atmospheric particulates and varies with geographic region, accounting for 20 to 90 % of the sub-micron particulate mass (Zhang et al., 2007). However, the understanding of OA sources, atmospheric processing, and removal is limited. Given that anthropogenic carbonaceous emissions from developing and emerging economies are ex-pected to dramatically increase in the future (IPCC, 2013), a better understanding of the chemical evolution of OA is es-sential to reduce the aerosol-related uncertainties in global climate simulations and improve air quality and climate as-sessments.
pre-cursors). The relative contribution of POA and SOA to the overall OA budget remains controversial. Recent studies show that OA is dominated by SOA not only in tropical re-gions but also in urban environments (Zhang et al., 2005). The formation of SOA is often underestimated in atmo-spheric chemistry–climate models (CCMs) and chemistry-transport models (CTMs) (Heald et al., 2005). Robinson et al. (2007) attributed this “unexplained” SOA to the evap-oration of POA, oxidation of the resulting vapors in the gas phase and subsequent recondensation, SOA formation from intermediate-volatility organic compounds (IVOCs), and chemical aging of the first-generation products of the volatile organic compounds (VOCs) that are not taken into account by models. Laboratory and field studies have con-firmed that the photooxidation of fossil fuel combustion and biomass burning emissions can lead to the formation of sub-stantial SOA mass that cannot be explained by the traditional treatment of SOA in CTMs and CCMs (Kroll and Seinfeld, 2008; Jimenez et al., 2009; Grieshop et al., 2009; Hennigan et al., 2011; Miracolo et al., 2011; May et al., 2012).
CCMs have traditionally treated POA and SOA as non-volatile and nonreactive particles that are emitted directly into the atmosphere (Kanakidou et al., 2005). Most models convert “hydrophobic” OA to “hydrophilic” OA using an as-sumed aging rate constant to account for the chemical con-version of fresh OA to more water-soluble compounds and its mixing with other soluble aerosol components without any mechanistic detail. In order to describe the OA volatil-ity changes that accompany this chemical conversion, Don-ahue et al. (2006) developed the volatility basis set (VBS) framework. This framework describes the OA absorptive par-titioning, where OA is assumed to be semivolatile and pho-tochemically reactive and is distributed in logarithmically spaced volatility bins. With this approach, the intermediate and semivolatile primary emissions and the SOA formation and its chemical aging can be simulated in a common frame-work that is well suited for regional and global modeling (Murphy and Pandis, 2009; Tsimpidi et al., 2010; Jathar et al., 2011).
Several recent regional-scale modeling studies have ac-counted for the semivolatile nature and chemical aging of organic compounds demonstrating improvements in repro-ducing the organic aerosol budget and its chemical resolu-tion (Murphy and Pandis, 2009; Tsimpidi et al., 2010, 2011; Hodzic et al., 2010; Fountoukis et al., 2011, 2014; Shrivas-tava et al., 2011; Bergström et al., 2012; Athanasopoulou et al., 2013; Zhang et al., 2013). However, such efforts on a global scale are limited. Farina et al. (2010) implemented the VBS in the Goddard Institute for Space Studies Gen-eral Circulation Model II’ (GISS II’) to describe the forma-tion of SOA from VOCs, while assuming that POA emis-sions were nonvolatile and nonreactive and not account-ing for IVOC emissions. Pye and Seinfeld (2010) estimated the global OA production from emissions of semivolatile organic compounds (SVOCs) and IVOCs using the global
CTM GEOS-Chem. However, this study simulated only the first generation of reactions neglecting the subsequent chem-ical aging. In contrast to other studies, their implementa-tion of semivolatile POA led to decreases in modeled total surface-level OA concentrations due to the partial evapora-tion of POA upon emission. Jathar et al. (2011) modified the model of Farina et al. (2010) to account explicitly for the semivolatile and reactive POA and predicted a global dom-inance of SOA, which brought the POA/SOA fractions into better agreement with measurements. Jo et al. (2013) em-ployed the VBS framework in the GEOS-Chem global CTM to study the effect of photochemical aging on global SOA. They found that the model results were in better agreement with all observations relative to the simulations without ag-ing and to those of the traditional two-product approach. All of the above studies showed improved representation of POA and/or SOA in the corresponding global CTMs and brought the model predictions closer to field measurements. How-ever, the number of studies that have employed the recent OA findings is rather limited, and in some cases these stud-ies lack one or more potentially important processes (e.g., the aging reactions, the semivolatile character of POA).
This study aims to improve the description of organic aerosols in large-scale models, making use of the VBS ap-proach and recent developments based on laboratory and field measurements. A new computationally efficient mod-ule for the description of organic aerosol composition and evolution in the atmosphere (ORACLE) has been devel-oped and implemented in the ECHAM/MESSy Atmospheric Chemistry (EMAC) model (Jöckel et al., 2006) to simulate POA and SOA formation and growth. ORACLE uses a novel lumping method that allows the use of a small number of species, minimizing the computational cost. At the same time it provides valuable information about the OA sources and physicochemical evolution during its atmospheric lifetime. The ORACLE user has full control of the complexity of the OA scheme and is able to adjust the number of species and re-actions, depending on the application and the desired chemi-cal resolution (number of compounds and volatility bins), as well as the physicochemical properties of OA components (aging reaction constants, emission factors, etc.). The appli-cation of this advanced OA module can help identify gaps in our understanding of the OA formation and composition, improve the predictive capability of OA, and help in identify-ing the major uncertainties that should be addressed in future experimental and modeling studies.
2 Global model description 2.1 EMAC model
cli-mate simulation system that includes submodels describing lower- and middle-atmospheric processes and their interac-tion with oceans, land, and human influences. EMAC com-bines the Modular Earth Submodel System (MESSy; Jöckel et al., 2005) and the fifth generation of the European Cen-tre Hamburg general circulation model (ECHAM5; Röckner et al., 2006). ECHAM5 simulates the atmospheric flow with the prognostic variables vorticity, divergence, temperature, total moisture and the logarithm of the surface pressure, and is integrated in the base model layer of MESSy. The inter-face structure of MESSy allows the use of different modules for atmospheric chemistry, transport, and diagnostic tools. EMAC has been extensively described and evaluated against ground-based and satellite observations, and can be run with a range of spatial resolutions (Jöckel et al., 2006; Pozzer et al., 2012; de Meij et al., 2012). In this study, the applied spec-tral resolution is T42L31, corresponding to a horizontal grid resolution of approximately 2.8◦×2.8◦and 31 vertical layers
extending to 25 km. EMAC is applied for 6 years, covering the period 2004–2009, and the first year is used as spin-up.
The EMAC model simulates gas-phase species online through the Module Efficiently Calculating the Chemistry of the Atmosphere submodel (MECCA; Sander et al., 2011). MECCA calculates online the concentration of the major ox-idants (OH, H2O2, NO3, and O3)by using a chemical scheme based on the MIM mechanism (Pöschl et al., 2000), includ-ing 218 gas-phase reactions, 69 photolysis reactions, and 12 heterogeneous reactions of 129 gases in total. Inorganic aerosol microphysics and gas–particle partitioning are calcu-lated by the Global Modal-aerosol eXtension aerosol module (GMXe; Pringle et al., 2010). This submodel is computation-ally efficient and is suitable for medium to long-term simula-tions with global and regional models.
The aerosol microphysics are described using seven in-teracting lognormal modes (four hydrophilic and three hy-drophobic modes). The four hydrophilic modes cover the full aerosol size spectrum (nucleation, Aitken, accumulation, and coarse modes). Each size range has fixed size boundaries and a variable mean radius. The three hydrophobic modes have the same size range as the hydrophilic modes apart from the nucleation mode. The aerosol composition within each mode is uniform with size (internally mixed), though the compo-sition can vary between modes (externally mixed). The re-moval of gas and aerosol species through dry deposition is calculated within the DRYDEP submodel (Kerkweg et al., 2006a) based on the big-leaf approach. The sedimentation of aerosols is calculated within the SEDI submodel (Kerkweg et al., 2006a) using a first-order approach. The formation of sul-fate through the aqueous-phase oxidation of SO2is treated by the SCAV submodel (Tost et al., 2006), which calculates the aqueous-phase redox reactions based on the prognostically predicted pH of clouds. SCAV also simulates cloud scaveng-ing and rainout of gas and aerosol species. The optical prop-erties of aerosols (optical thickness, single-scattering albedo, asymmetry factor) are calculated within the AEROPT
sub-model (Lauer et al., 2007) based on pre-calculated look-up tables from Mie theory. The CLOUD submodel (Jöckel et al., 2006) is used to calculate the cloud cover as well as cloud mi-crophysics including precipitation. The detailed two-moment liquid and ice-cloud microphysical scheme of Lohmann et al. (2007), which enables a physically based treatment of aerosol–cloud interactions, is used to compute cloud micro-physical processes.
3 ORACLE description 3.1 Module overview
The ORACLE module (i) uses logarithmically spaced sat-uration concentration bins to describe the OA components based on their volatility (Sect. 3.3), (ii) simulates the con-tribution of SVOCs and IVOCs from fuel combustion and biomass burning emissions and anthropogenic and biogenic VOCs to the formation of SOA (Sect. 3.4), (iii) monitors the gas-phase photochemical reactions of SOA precursors (Sect. 3.5), (iv) assumes bulk equilibrium between the gas and particulate phases (Sect. 3.6), and (v) distributes the OA in size modes (Sect. 3.6). A schematic overview of the OR-ACLE module and how it is implemented in EMAC is pro-vided in Fig. 1.
3.2 OA terminology
The ORACLE module describes the chemical life cycle of a large number of different species involved in the formation of total atmospheric OA (i.e., 48 species are used in the current configuration) in order to cover and track the distribution of these species in multiple simultaneously occurring phases, their participation in a large number of possible formation pathways (i.e., multigenerational oxidation), their volatility distribution, and their sources. The complexity of this sys-tem demands a syssys-tematic classification of the organic com-pounds that will be in line with ongoing field and labora-tory studies and model development. Following the Murphy et al. (2014) naming convention for classifying OA compo-nents, the ORACLE classification system has the following syntax:
[source root name] − [initial volatility],
39 1148
1149
1152
1153
Figure 1: Diagram showing ORACLE as part of the EMAC chemistry-climate model. ECHAM5 General Circulation model
Messy Interface
AEROPT
Aerosol optical properties
CLOUD
Cloud micro-physics
CONVECT
Convection of tracers
DDEP
Dry dep.
MECCA
Gas phase chemistry
SCAV
Scaveng. Sediment. SEDI
GMXe
Inorganic aerosol module
OFFEMIS /ONEMIS
Emissions
ORACLE
Organic aerosol module
Inclusion of anthropogenic VOC emissions based on
RCP4.5
1. Formation of aSOA-v and bSOA-v from the oxidation of aVOCs and bVOCs, respectively 2. Aging reactions of
aSOA-v and bSOA-v 3. Formation of SOA-sv
and SOA-iv from the oxidation of SVOC and IVOC emissions, respectively 4. Aging reactions of
SOA-sv and SOA-iv Namelist File
1. Includes the variables that control the desired chemical resolution of OA (number of volatility bins, number of size modes, saturation concentrations, molecular weights, etc.)
2. Includes the desired emission factors for the distribution of POA emissions into SVOC and IVOC volatility bins
Interface Layer
1. Reads the namelist variables for operating the ORACLE module. 2. Defines the new tracers for organic compounds.
3. Performs the coupling with OFFEMIS/ONEMIS modules 4. Performs the coupling with MECCA
5. Calls the core layer of the ORACLE module
Core Layer
1. Calculates the bulk equilibrium gas and aerosol concentrations 2. Distributes the change in the bulk aerosol concentration into size modes
Figure 1. Diagram showing ORACLE as part of the EMAC chemistry–climate model.
organic component is primary (“P”), coming from primary emissions, or secondary (“S”), formed from the oxidation of gas-phase species; the second is always the letter “O”, denot-ing organic; and the third identifies the phase of the species (“A” for aerosol and “G” for gas). The exact names of all the organic compounds simulated by ORACLE are listed in Table 2.
3.3 Volatility basis set theory
The ORACLE module adopts the volatility basis set ap-proach proposed by Donahue et al. (2006). It subdivides the thousands of organic compounds into groups (surrogate species) with logarithmically spaced effective saturation con-centrations. This framework abandons the traditional distinc-tion between POA and SOA and allows the EMAC model to efficiently treat both semivolatile primary emissions and SOA production and then simulate the chemical evolution of these species under a unified framework. The exact volatility
Table 1. Organic component name classifications in the ORACLE module.
Term
Description Source root name
Modifiers
a Mass from anthropogenic sources (i.e., aSOA)
a Mass from biogenic sources (i.e., bSOA)
f Mass from fossil and biofuel combustion (i.e., fPOA )
Bb Mass from biomass burning processes (i.e., bbPOA)
Base terms
POA Primary organic aerosol. This is emitted in the particle phase and has not undergone chemical reaction.
POG Primary organic gas that has not undergone chemical reaction.
SOA Secondary organic aerosol formed from the oxidation of gas-phase organic species.
SOG Secondary organic gas. The gas-phase mass produced by at least one chemical reaction in the atmosphere. Initial volatility
Suffix
-sv Product of the oxidation of SVOCs
-i Product of the oxidation of IVOCs
-v Product of the oxidation of VOCs
lower than 10−3) would be useful for the study of new par-ticle formation, which is outside the scope of the current work and is not included in the current version of ORA-CLE. A similar approach is followed for SOA formed from VOCs. Following the approach of Lane et al. (2008) it is as-sumed that the oxidation of the anthropogenic and biogenic VOC species (aVOC and bVOC, respectively) results in four products for each precursor distributed in four volatility bins with effective saturation concentrations at 298 K equal to 1, 10, 102, and 103µg m−3 at 298 K. This range is typically constrained by available smog-chamber data (Stanier et al., 2008). A wider range can also be used and tested through the ORACLE interface. The different aerosol types and chemical processes modeled in the proposed framework are illustrated in Fig. 2.
3.4 Emission inventory of OA precursors VOC emissions
The emissions of isoprene and monoterpenes are calculated online by EMAC with the ONLEM submodel (Kerkweg et al., 2006b) and depend on ecosystem type, temperature, and solar radiation. The AIRSEA submodel estimates the oceanic isoprene emissions from chlorophyll concentrations (Pozzer et al., 2006). In this application, isoprene and monoterpene global emissions are 477 and 62.4 Tg yr−1, respectively. The emissions of the aVOCs that are considered SOA precur-sors are derived from the CMIP5 RCP4.5 emission inven-tory (Clarke et al., 2007). These compounds were not consid-ered by the original gas-phase chemistry submodel MECCA. Therefore, six lumped aVOC species have been added to
MECCA to assess the aSOA formation in ORACLE. These lumped species are grouped similarly to the Statewide Air Pollution Research Center SAPRC99 chemical mechanism (Carter, 2000) into two alkane species, two olefins, and two aromatics. The aVOCs that are considered SOA precursors and their annual global emissions are listed in Table 3. IVOC and SVOC emissions
The EMAC model considers the contribution of fuel combus-tion and biomass burning to POA emissions, while primary marine organic emissions are not included in this application. The AEROCOM database is used for the aerosol emissions from fossil and biofuel combustion based on the year 2000 (Dentener et al., 2006). The biomass burning contribution is based on the Global Fire Emissions Database (GFED ver-sion 3.1), which is monthly resolved and covers the period 1997–2009 (van der Werf et al., 2010). These emission data sets treat POA as nonreactive and nonvolatile. However, the POA concentration upon emission is highly sensitive to am-bient conditions, including dilution and temperature (Hilde-mann et al., 1989; Lipsky and Robinson, 2006). ORACLE accounts for the volatility of POA emissions by distribut-ing the traditional nonvolatile emissions into emissions of SVOCs and IVOCs. SVOCs have saturation concentrations between 0.01 and 100 µg m−3and exist in both the gas and particulate phases under typical ambient conditions. IVOCs have saturation concentrations between 103and 106µg m−3 and exist in the gas phase (Pandis et al., 2013).
40 Figure 2: Schematic of the VBS resolution and the formation procedure of SOA from SVOC,
1180
IVOC and VOC emissions implemented in ORACLE. Red indicates that the organic compound
1181
is in the vapor phase and blue in the particulate phase. The circles correspond to primary organic
1182
material that can be emitted either in the gas or in the aerosol phase. The triangles indicate the
1183
formation of SOA from SVOCs by fuel combustion and biomass burning sources, while the
1184
squares show SOA from IVOCs by fuel combustion and biomass burning sources, and the
1185
diamonds the formation of SOA from anthropogenic and biogenic VOC sources. The
1186
partitioning processes, the aging reactions of the organic compounds, and the names of the
1187
species used to track all compounds are also shown.
1188
*For this application it is assumed that SOA formed by biogenic VOCs does not participate in aging reactions (Lane 1189
et al., 2008; Tsimpidi et al., 2010). 1190
1191
Figure 2. Schematic of the VBS resolution and the formation procedure of SOA from SVOC, IVOC, and VOC emissions. Red indicates that the compound is in the vapor phase and blue in the particulate phase. The circles correspond to primary organic material that can be emitted either in the gas or in the aerosol phase. The triangles indicate the formation of SOA from SVOCs by fuel combustion and biomass burning sources, while the squares show SOA from IVOCs by fuel combustion and biomass burning sources, and the diamonds the formation of SOA from anthropogenic and biogenic VOC sources. The partitioning processes, the aging reactions, and the names of the species used to track all compounds are also shown.∗For this application it is assumed that SOA formed by biogenic VOCs does not participate in aging reactions (Lane et al., 2008; Tsimpidi et al., 2010).
Table 2. Description of ORACLE organic compounds in gas and aerosol phases.
Gas-phase compounds Particle-phase compounds Description
fPOG fPOA Primary organic compounds from fuel combustion
bbPOG bbPOA Primary organic compounds from biomass burning
fSOG-sv fSOA-sv Secondary organic compounds from the oxidation of fuel combustion SVOCs
bbSOG-sv bbSOA-sv Secondary organic compounds from the oxidation of biomass burning SVOCs
fSOG-iv fSOA-iv Secondary organic compounds from the oxidation of fuel combustion IVOCs
bbSOG-iv bbSOA-iv Secondary organic compounds from the oxidation of biomass burning IVOCs
aSOG-v aSOA-v Secondary organic compounds from the oxidation of anthropogenic VOCs
bSOG-v bSOA-v Secondary organic compounds from the oxidation of biogenic VOCs
using two surrogate species for each emission category with effective saturation concentration at 298 K of C∗=0.1 and 10 µg m−3 to cover the volatility range of SVOCs (0.01 to 100 µg m−3). For the IVOCs, two additional surrogate species withC∗=103and 105µg m−3are used for each of the above two source categories to cover the corresponding volatility range (103 to 106µg m−3). The emission factors used for the distribution of traditional POA emissions into SVOCs and IVOCs are based on the work of Tsimpidi et al. (2010). These emission factors also account for the ad-ditional IVOC emissions that were not included in the origi-nal emission inventory used by EMAC. Traditioorigi-nal emission inventories account only for a small fraction of the IVOCs since they are based on samples using quartz and/or Teflon filters collected at aerosol concentrations up to 104µg m−3 (Shrivastava et al., 2008; Robinson et al., 2010). The amount
Table 3. Global annual emissions of the lumped anthropogenic VOC species introduced in the ORACLE module.
VOC lumped species RCP4.5 species Emission rates
(Tg yr−1)
ARO1 Benzene, toluene 18.3
ARO2 Trimethyl benzenes, xylene, other aromatics 13.9
ALK4 Pentanes 15.1
ALK5 Hexanes, other higher alkenes 21.2
OLE1 Propene 7.4
OLE2 Other alkenes 8.2
Table 4. Emission factors of the primary organic compounds from fuel combustion and biomass burning sources for each volatility bin used in ORACLE. The total global annual emission rates are also shown. The SVOC/IVOC emission rates are estimated by multiplying the emission factors of each bin by the nonvolatile emissions rates.
Volatility distribution Non Volatile
POA
emission rates Tg yr−1
SVOC emission rates Tg yr−1
IVOC emission rates Tg yr−1
C∗(µg m−3)at 298 K 10−1 101 103 105
Fuel combustion OA fPOA1 fPOA2 fPOG3 fPOG4 12.3 6.2 24.6
Biomass burning OA bPOA1 bbPOA2 bbPOG3 bbPOG4 24.8 12.4 49.6
Emission factors 0.18 0.32 0.5 1.5
3.5 Photochemical reactions Photooxidation of VOCs
The photochemical oxidation of VOCs that are considered as SOA precursors has been implemented into MECCA. The updated mechanism considers the oxidation of alkenes, aro-matics and isoprene by OH, and the oxidation of olefins and monoterpenes by O3, O, OH, and NO3. The oxida-tion products from anthropogenic (alkenes, aromatics, and olefins) and biogenic (monoterpenes and isoprene) VOCs are lumped into two groups: (1) secondary organic aerosols from the oxidation of anthropogenic VOCs (aSOA-v), and (2) secondary organic aerosols from the oxidation of bio-genic VOCs (bSOA-v). These groups are further distributed into volatility bins with logarithmically spaced effective satu-ration concentsatu-rations (Fig. 2). The photooxidation of aVOCs and bVOCs is described by the following reactions:
aVOC+Oxidants→ n X
i=1
aiaSOG−vi, (R1)
aSOG−vi↔aSOA−vi, (R2) bVOC+Oxidants→
n X
i=1
aibSOG−vi, (R3)
bSOG−vi↔bSOA−vi, (R4) whereaiis the aerosol yield,iis the corresponding volatility bin, andnis the total number of volatility bins. In this appli-cation, four volatility bins are considered and the
correspond-Table 5. Secondary organic aerosol mass yield∗parameters.
C∗in µg m−3at 298 K
VOC lumped species 1 10 102 103
ARO1 0.003 0.165 0.300 0.435
ARO2 0.002 0.195 0.300 0.435
ALK4 0.000 0.038 0.000 0.000
ALK5 0.000 0.150 0.000 0.000
OLE1 0.001 0.005 0.038 0.150
OLE2 0.003 0.026 0.083 0.270
ISOP 0.009 0.030 0.015 0.000
TERP 0.107 0.092 0.359 0.600
∗The SOA yields are based on an assumed particle density of 1.5 g cm−3.
ing aerosol yields are those used by Tsimpidi et al. (2010) based on laboratory results from smog-chamber experiments under high-NOxconditions for aVOCs and low-NOx condi-tions for bVOCs (Table 5). This is based on the assumption that urban areas, where most of aVOCs are emitted (∼90 %), are characterized by high-NOx conditions (Tsimpidi et al., 2008; Karl et al., 2009) and forested regions by low-NOx conditions (Pugh et al., 2010; Browne et al., 2013).
Chemical aging reactions
Table 6. Statistical evaluation of monthly averaged modeled OA against IMPROVE, EMEP, and East Asia observations during 2005–2009.
Network Number of Mean observed Mean modeled MAGE MB NME NMB RMSE
stations (µg m−3) (µg m−3) (µg m−3) (µg m−3) (%) (%) (µg m−3)
IMPROVE 193a 1.93 3.02 1.71 1.09 89 57 2.6
EMEP 10b 1.81 2.20 1.21 0.39 67 22 2.09
East Asia 18c 11.02 7.09 4.76 −3.93 43 −36 5.53
a10 202 measurements.b301 measurements.c74 measurements.
OH (Donahue et al., 2013). Smog-chamber results indicate a net average decrease in volatility (and increase in SOA production) of aSOA-v after multigenerational aging (Hilde-brandt et al., 2009). In this application, the volatilities of aSOA-v reacting with OH are reduced by a factor of 10 (Fig. 2) with a rate constant of 1×10⁻¹¹cm3molecule−1s−1 (Tsimpidi et al., 2010) and a 7.5 % increase in mass to account for one added oxygen, assuming a C15 precursor. aSOA-v can participate in up to three generations of oxi-dation, reaching a final organic matter/organic carbon ra-tio (OM/OC) up to 2.2 (assuming an initial OM/OC of 1.8), which is within the limits (OM/OC:1.8–2.4) of the ob-served OM/OC of the oxygenated organic aerosols (Aiken et al., 2008). Existing evidence suggests that the aging of bSOA-v does not result in an important change in its mass concentration (Ng et al., 2006; Donahue et al., 2012). Mur-phy et al. (2012) attributed this to a balancing of fragmen-tation and functionalization effects during the photochemi-cal aging of bSOA-v. Therefore, it is assumed here that the chemical aging of bSOA-v does not result in a net increase of the corresponding SOA concentration. The chemical aging of aSOA-v is described by the following reaction:
aSOG−vi+OH→1.075aSOG−vi−1, (R5) aSOG−vi−1↔aSOA−vi−1. (R6)
The volatilities of SVOCs and IVOCs are reduced by a factor of 100 (Fig. 2) as a result of the OH reaction with a rate constant of 2×10⁻¹¹cm3molecule−1s−1 (Pye and Seinfeld, 2010) and a 15 % increase in mass to account for two added oxygens, assuming a C15 precursor. This repre-sents a more aggressive addition of oxygen and reduction in volatility compared to aSOA-v. In the present application, SVOCs and IVOCs can participate in up to three generations of oxidation, reaching a final OM/OC up to 1.8 (assuming an initial OM/OC of 1.2), which is consistent with the ob-served OM/OC (OM/OC:1.8–2.4) of the oxygenated or-ganic aerosols (Aiken et al., 2008). The oxidation products of SVOCs and IVOCs are called SOA from the oxidation of fuel combustion and biomass burning SVOCs (fSOA-sv and bbSOA-sv, respectively) and SOA from the oxidation of fuel combustion and biomass burning IVOCs (fSOA-iv and bbSOA-iv, respectively). The photooxidation of SVOCs and
IVOCs is described by the following reactions:
fSVOCi+OH→1.15fSOG−svi−1, (R7) fSOG−svi−1↔fSOA−svi−1, (R8) fIVOCi+OH→1.15fSOG−ivi−1, (R9) fSOG−ivi−1↔fSOA−ivi−1, (R10) bbSVOCi+OH→1.15bbSOG−svi−1, (R11) bbSOG−svi−1↔bbSOA−svi−1, (R12) bbIVOCi+OH→1.15bbSOG−ivi−1, (R13) bbSOG−ivi−1↔bbSOA−ivi−1. (R14) The products of Reactions (R7)–(R14) can be further oxi-dized by OH-forming species with lower saturation concen-tration until they reach the lowest volatility bin (i.e., the ox-idation of fSOA-svi will produce the fSOA-svi−1). Overall, all OA surrogate species are assumed to have a constant hy-groscopicity parameter kappa of 0.14 that remains constant during their atmospheric aging.
3.6 Gas–aerosol partitioning
ORACLE calculates the partitioning of organic compounds between the gas and particle phases by assuming bulk equi-librium and that all organic compounds form a pseudo-ideal solution. The gas–aerosol partitioning is performed in two steps as follows.
Bulk equilibrium
ORACLE calculates the bulk equilibrium gas and aerosol concentrations following the approach of the SOAM II model of Strader et al. (1999). Considering partitioning ofnorganic compounds and assuming pseudo-ideal solution, a set ofn
nonlinear equations is obtained:
ca,i=ct,i−xici∗fori=1, n xi=
ca,i/Mi n P
j=1 ca,j/Mj
,
is the molecular weight of producti. The molecular weights of all POA, SOA-sv, and SOA-iv components are assumed to be 250 g mol−1, while the molecular weights of bSOA-v and aSOA-v are 180 and 150 g mol−1, respectively (Tsimpidi et al., 2010). The temperature dependence of saturation concen-trations is described by the Clausius–Clapeyron equation:
c∗i =c∗i,0T0
T exp
1H
R
1
T0 − 1
T
,
wherec∗i andc∗i,0are the saturation concentrations at temper-atureT andT0, respectively;Ris the gas constant; and1H is the enthalpy of vaporization. In this application an effec-tive1H of 30 kJ mol−1is used for all aSOA-v and bSOA-v species based on data forα-pinene (Pathak et al., 2007), and a1H of 106, 94, 82, and 70 kJ mol−1is used for the 10−1, 101, 103, 105µg m−3volatility bins, respectively, for all or-ganic compounds from fuel combustion and biomass burning sources based on data for large saturated species commonly found in primary emissions (Donahue et al., 2006). ORA-CLE solves this equation set, which yields the bulk aerosol composition at equilibrium.
Aerosol size distribution
The aerosol size distribution is determined by distributing the change in aerosol mass after the bulk equilibrium into each size mode using a weighting factor (Pandis et al., 1993). As-suming pseudo-ideal solution, the fraction,fi,k, of total flux of speciesi between gas and aerosol phases that condenses onto or evaporates from an aerosol modekis given by
fi,k=
Nkdk ci−xi,kc∗i
/ (βk+1) m
P
l=1
Nldl ci−xi,lc∗i/ (βl+1) ,
whereNk anddkare the number and mean diameter of par-ticles in the modek, respectively;mis the total number of aerosol modes; βk=2λ/αdk;αis the aerosol accommoda-tion coefficient; andλis the mean free path of air molecules (Pandis et al., 1993). The above equation is solved iteratively at each time step and determines the OA composition of each mode. Overall, the user is allowed to use up to three hy-drophilic modes (Aitken, accumulation, coarse) for the size distribution of all OA surrogate species. In the current ap-plication, only the accumulation mode is used to limit the computational cost of the module.
4 Model results
4.1 Total OA concentrations
The model calculated global average surface OA concentra-tion is 1.5 µg m−3(Fig. 3). High OA concentrations are mod-eled over regions affected by biomass burning and biogenic VOC emissions: the tropical forests and savannas of South
41 1192
1193
1194
1195
1196
1197
1198
1199
1200
1201
Figure 3: Modeled average surface concentration of total OA (μg m-3) during the years
2005-1202
2009.
1203
1204
Figure 3. Modeled average surface concentration of total OA (µg m−3)during the years 2005–2009.
America (Amazon Basin), Africa (Congo Basin), and South-east Asia. These areas are characterized by a pronounced an-nual cycle due to the influence of two distinct seasons, the wet and dry periods. The dry season is characterized by in-tense wildfires and OA consists mainly of biomass burning OA. The wet season is characterized by low biomass burn-ing emissions; therefore, OA consists mainly of biogenic SOA. Considerable OA concentrations are also calculated over the industrialized regions of the Northern Hemisphere (i.e., China, Europe, and the eastern USA), where strong fossil-fuel- and biofuel-combustion-related sources are lo-cated. The model simulates a continental background OA concentration of 1–2 µg m−3, which is mainly formed by the condensation of oxidized low-volatility organic gases. These gases are formed from the photochemical aging of VOCs, IVOCs, and SVOCs which have been emitted in the gas phase and have been efficiently transported remote from their sources. The effects of trade wind transport of bbOA off the subtropical west coasts of Africa and America are discernible in Fig. 3. In these regions, the OA concentration is increased by long-range transport of continental air masses to adjacent ocean areas.
4.2 Model performance evaluation
Figure 4. Scatterplot comparing model predictions of total OA concentration (in µg m−3)with observations from the (a) IMPROVE network in the United States. (b) EMEP network in Europe and East Asian sites from 2005 to 2009. Each point represents a monthly average value. Also shown are the 1:1, 2:1, and 1:2 lines.
normalized mean bias (NMB), normalized mean error (NME), and the root-mean-square error (RMSE) were also calculated (Table 6) to assess the model performance:
MAGE= 1 N
N X
i=1
|Pi−Oi| MB= 1
N N X
i=1
(Pi−Oi)
NME= N P
i=1
|Pi−Oi|
N P
i=1 Oi
NMB= N P
i=1
(Pi−Oi)
N P
i=1 Oi
RMSE= "
1
N N X
i=1
(Pi−Oi)2 #12
,
wherePi is the modeled OA mass,Oi is the observed value of OA at the same monthly averaged time, andN is the total number of data points used for the comparison. NME (in %) and MAGE (in µg m−3)provide an assessment of the over-all discrepancy between model predictions and observations, while NMB (in %) and MB (in µg m−3)are indicative of sys-tematic errors. RMSE (in µg m−3)incorporates both the vari-ance of the prediction and its bias. Both NME and MAGE in-herently include the corresponding bias, which is the reason why their magnitude is equal or larger than NMB and MB, respectively. For an unbiased calculation, NME and MAGE express the variance. When NME and NMB or MAGE and MB, respectively, are close to each other in magnitude, the discrepancy is explained as a systematic bias rather than scatter. When the magnitude of NME/MAGE is larger than NMB/MB, part of the discrepancy between predictions and observations is explained as scatter.
The model, despite its coarse resolution, captures the monthly average concentrations of OA relatively well over the USA, Europe, and Asia (Table 6). This is rather encour-aging given the expected uncertainties in the emission
in-ventory and in a number of parameters used by the model such as the emission fractions for POA from fuel combustion and biomass burning, the reaction rates and aerosol yields that accompany the formation of SOA from SVOCs, IVOCs, VOCs, etc. In addition, the fact that the formation of SOA from aqueous-phase reactions and heterogeneous reactions, including processes like oligomerization, has not been ac-counted for, adds to the model bias. However, despite these limitations, the modeled total OA concentrations are gener-ally in reasonable agreement with the measurements. More precisely, over the USA, the model overestimates the OA with a NMB of 57 %. The high NME (89 %) indicates that part of the discrepancy between model results and obser-vations is explained as scatter, which is visible in Fig. 4a. Over Europe, the model overestimates OA with a NMB of 22 %. The measurements of OA at the station of Ispra, Italy, are systematically high (up to 22 µg m−3) and have been excluded from the statistical analysis. The model performs worst over East Asia (RMSE=5.5) and underestimates OA concentrations with a NMB of−36 % since it cannot capture the high values measured over Beijing and Shijiazhuang (up to 32 µg m−3), possibly due to its limited spatial resolution.
agrees reasonably well with the observations since the cal-culated OA concentrations during January and February of 2006 range between 2 and 12.5 µg m−3, mainly due to high biomass burning emissions over the area. During the wet season of the same year (July and August 2006), Capes et al. (2009) carried out aircraft measurements over subtropical West Africa in the frame of the AMMA project. This period is characterized by low biomass burning emissions; there-fore, OA consists according to EMAC mainly of biogenic SOA. The observed median concentration is 1.1 µg m−3 while EMAC calculates an average value of 2.7 µg m−3. In the northwestern Amazon Basin, Chen et al. (2009) reported OA concentrations of 0.6 and 0.9 µg m−3 on average dur-ing the wet season of 2008 (February and March) as part of the AMAZE-08 experiment. The corresponding average OA concentration by EMAC is 2.7 µg m−3. During the dry season (September 2012), Brito et al. (2014) reported an av-erage OA concentration of 13.7 µg m−3 in the southwest-ern Amazon Basin during the SAMBBA field experiment. Since this value is mostly affected by biomass burning emis-sions (which vary significantly interannually) and the EMAC model applied emissions during the years 2005–2009, a di-rect comparison between observations and measurements is not possible. However, EMAC captures the increased con-centrations during the dry seasons since OA varies between 9.8 and 30 µg m−3over the same area during the months of September. Finally, Schwartz et al. (2010) and Takahama et al. (2011) performed measurements of OA over the boreal forest of British Columbia, Canada, during May–June 2008 and March–September 2009, respectively. The reported val-ues were 1.3 µg m−3(May–June 2008), 0.6 µg m−3(March– April 2009), and 4.1 µg m−3 (May–September 2009). The OA concentrations calculated by EMAC fit well with this range of observations with values of 1.4, 0.9, and 4.5 µg m−3, respectively.
4.3 Primary organic aerosol
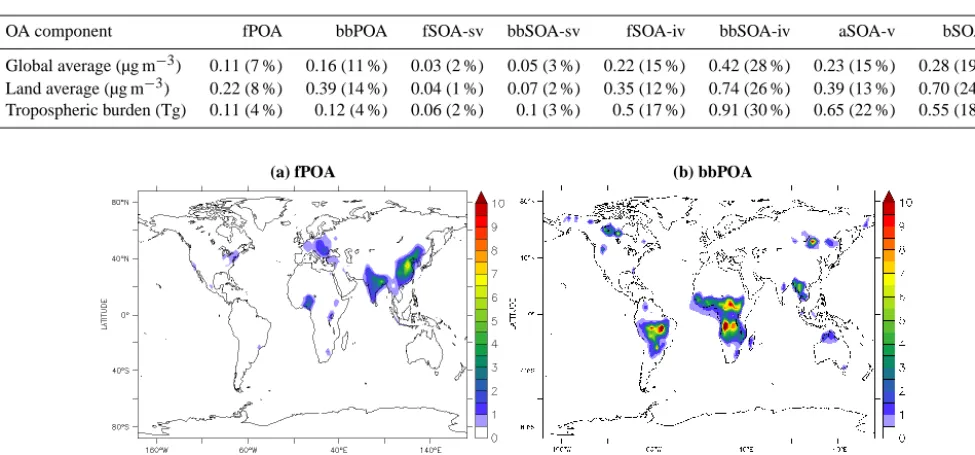
POA is the fraction of the organic emissions that is emitted and contained in the aerosol phase and has not undergone chemical reactions. POA in the present application is divided into fPOA and bbPOA depending on its source as described in Sect. 3.3. fPOA and bbPOA have high concentrations close to their sources; further downwind the concentrations rapidly decrease due to dilution and evaporation (Fig. 5).
fPOA
The global and land average surface concentrations of fPOA are 0.11 and 0.22 µg m−3, respectively (Table 7, Fig. 5a). Fossil fuels and biofuels are used in the industrial, residen-tial, and transport sectors; therefore the fPOA concentration peaks over densely populated and highly industrialized ar-eas. In fact, the highest fPOA concentration is calculated over eastern China (up to 8 µg m−3over Beijing), India and
Bangladesh (1–4 µg m−3). In Europe the highest concentra-tion is found over eastern European countries (1–2 µg m−3 over Poland and Romania), central Europe (0.5–1 µg m−3 over the greater Paris and Rhine–Ruhr areas), and in the vicinity of Moscow (0.5–1 µg m−3). Over Africa, fPOA con-centrations peak over the western part of the continent (1– 3 µg m−3over Nigeria), while it is also high over the greater areas of Addis Ababa, Kampala, and Johannesburg (0.5– 1.5 µg m−3). Over North America, the highest fPOA lev-els are modeled around Los Angeles (0.5–1 µg m−3), the northeastern USA (0.5–1.5 µg m−3), and the Mexico City metropolitan area (0.5–1 µg m−3), while over South America fPOA is high over the greater area of Rio de Janeiro (0.5– 1 µg m−3).
bbPOA
The global and land average surface concentrations of bbPOA are 0.12 and 0.39 µg m−3, respectively (Table 7, Fig. 5b). The bbPOA levels are affected by emissions from forest, woodland, peatland, and savanna fires as well as agri-cultural waste burning. Therefore, high concentrations are modeled over the tropical rainforest and savannas in the Amazon and Congo basins (5–10 µg m−3), Southeast Asia (3–6 µg m−3), and the boreal forests of Alaska, Canada, and Russia. During the dry season, bbPOA concentrations in-crease significantly (e.g., 10–50 µg m−3during January over the Congo Basin), while during the wet season they are much lower (e.g., 0.5–3 µg m−3during July over the Congo Basin). 4.4 Secondary organic aerosol from SVOCs
SVOCs are emitted in both the aerosol and gas phase and can be transferred from phase to phase due to cooling and dilution as the air masses travel from their sources. SVOCs in the gas phase can be oxidized and possibly re-condense to the aerosol phase, forming secondary organic aerosols (SOA-sv). In ORACLE SOA-sv is subdivided into fSOA-sv and bbSOA-sv depending on its source as described in Sect. 3.5. fSOA-sv and bbSOA-sv concentrations are high according to our simulation downwind of polluted urban areas and megac-ities and the major rainforests (Fig. 6). However, as most of the SVOCs are in the aerosol phase after emissions (as POA) and remain there without undergoing chemical reactions dur-ing their atmospheric lifetime, fSOA-sv and bbSOA-sv con-centrations are significantly lower compared to the corre-sponding fPOA and bbPOA concentrations (Figs. 5 and 6). fSOA-sv
Table 7. Global and land average surface concentration and tropospheric burden of organic aerosol components. The fractional contribution of each component to total OA is listed in parentheses.
OA component fPOA bbPOA fSOA-sv bbSOA-sv fSOA-iv bbSOA-iv aSOA-v bSOA-v
Global average (µg m−3) 0.11 (7 %) 0.16 (11 %) 0.03 (2 %) 0.05 (3 %) 0.22 (15 %) 0.42 (28 %) 0.23 (15 %) 0.28 (19 %)
Land average (µg m−3) 0.22 (8 %) 0.39 (14 %) 0.04 (1 %) 0.07 (2 %) 0.35 (12 %) 0.74 (26 %) 0.39 (13 %) 0.70 (24 %)
Tropospheric burden (Tg) 0.11 (4 %) 0.12 (4 %) 0.06 (2 %) 0.1 (3 %) 0.5 (17 %) 0.91 (30 %) 0.65 (22 %) 0.55 (18 %)
43 1221
1222
1223
1224
1225
1226
1227
1228
Figure 5: Modeled average surface concentrations (in μg m-3) of (a) POA from fuel combustion
1229
(fPOA) and (b) POA from biomass burning emissions (bbPOA) during the years 2005-2009.
1230
1231
(a) fPOA (b) bbPOA
Figure 5. Modeled average surface concentrations (in µg m−3) of (a) POA from fuel combustion (fPOA) and (b) POA from biomass burning emissions (bbPOA) during the years 2005–2009.
Bangladesh (0.3–0.7 µg m−3), and in the greater Beijing area and Nigeria (0.1–0.5 µg m−3).
bbSOA-sv
The global and land average surface concentrations of bbSOA-sv are 0.05 and 0.07 µg m−3, respectively (Table 7, Fig. 6b). bbSOA-sv has higher concentrations in the South-ern Hemisphere, where the main rainforests of the world are located (Amazon, Congo Basin, part of SE Asia) and the meteorological conditions favor the partition of SVOC emis-sions into the gas phase, where they are subject to oxidation. The highest bbSOA-sv concentrations (up to 1 µg m−3)are calculated over the west coast of central Africa, affected by the biomass burning emissions from the Congo Basin rain-forest. These emissions are the source of the relatively high bbSOA-sv concentrations (0.3–0.7 µg m−3) that are calcu-lated over the southern Atlantic Ocean. The concentration of bbSOA-sv over the Amazon Basin is up to 0.7 µg m−3. The atmosphere over the Pacific and Indian oceans is also affected by biomass burning emissions from the Amazon rainforest and the rainforests of Southeast Asia, respec-tively (bbSOA-sv concentration is 0.1–0.3 µg m−3). Over the boreal forests, bbSOA-sv reaches low levels (less than 0.1 µg m−3)as most of the biomass burning SVOCs are emit-ted directly into the aerosol phase, forming bbPOA.
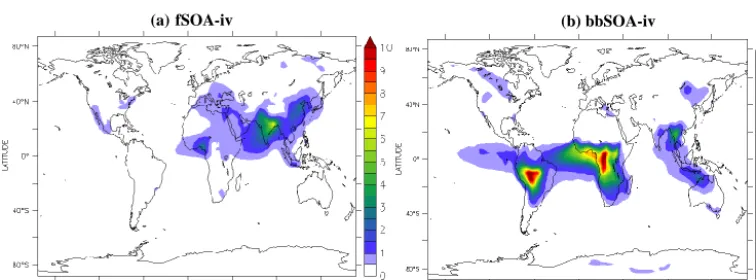
4.5 Secondary organic aerosol from IVOCs
IVOCs are emitted in the gas phase, where they react with OH, becoming less volatile and more chemically processed, and condense to the aerosol phase to produce secondary or-ganic aerosol (SOA-iv). SOA-iv is subdivided into fSOA-iv and bbSOA-fSOA-iv depending on the source as described in Sect. 3.5. In the current application, IVOC emissions are assumed to be 4 times higher than those of SVOC (Ta-ble 4). Therefore, IVOCs are a significant source of SOA and the iv concentration by far exceeds that of SOA-sv and POA (Figs. 5–7). Furthermore, the effective long-range transport of IVOCs results in the formation of signifi-cant SOA-iv amounts remote from the sources (Fig. 7). This is consistent with several field campaigns over megacities which have shown that the concentration of primary combus-tion organic particles decreases with distance from the urban source areas due to evaporation and deposition, remaining at low levels in surrounding areas, while secondary oxygenated and photochemically processed organics remain in high con-centrations in suburban and rural sites (Aiken et al., 2009; Hildebrandt et al., 2010; Morgan et al., 2010).
fSOA-iv
44
1233 1234 1235 1236 1237 1238 1239
Figure 6: Modeled average surface concentrations (in μg m-3) of (a) SOA-sv from the oxidation of SVOCs from fuel combustion (fSOA-sv) and (b) SOA-sv from the oxidation SVOCs from 1242
biomass burning emissions (bbSOA-sv) during the years 2005-2009. 1243
1244
(a)fSOA-sv (b) bbSOA-sv
Figure 6. Modeled average surface concentrations (in µg m−3) of (a) SOA-sv from the oxidation of SVOCs from fuel combustion (fSOA-sv) and (b) SOA-sv from the oxidation SVOCs from biomass burning emissions (bbSOA-sv) during the years 2005–2009.
45
1245
1246
1247
1248
1249
1250
1251
1252
1253
Figure 7: Modeled average surface concentrations (in μg m-3) of (a) SOA-iv from the oxidation
1254
of IVOCs from fuel combustion (fSOA-iv) and (b) SOA-iv from the oxidation of IVOCs from
1255
biomass burning emissions (bbSOA-iv) during the years 2005-2009.
1256
1257
(a)fSOA-iv (b) bbSOA-iv
Figure 7. Modeled average surface concentrations (in µg m−3) of (a) SOA-iv from the oxidation of IVOCs from fuel combustion (fSOA-iv) and (b) SOA-iv from the oxidation IVOCs from biomass burning emissions (bbSOA-iv) during the years 2005–2009.
Bangladesh and 8 µg m−3over the greater Beijing area, re-spectively). This difference indicates that fSOA-iv is more regionally distributed compared to fPOA, due to the ef-fects of long-range transport of IVOC emissions on fSOA-iv formation. The model calculates a continental background of around 0.5 µg m−3 for fSOA-iv. The highest fSOA-iv concentrations are modeled over India and Bangladesh (3– 7 µg m−3), eastern China (1–4 µg m−3), and western Africa (1–4 µg m−3). The Balkan Peninsula and eastern Mediter-ranean are strongly influenced by long-range transport of IVOC emissions from eastern Europe (the fSOA-iv concen-tration is 0.5–1 µg m−3). fSOA-iv concentrations are also significant over the Arabian Peninsula (around 1 µg m−3), and western and southern Africa (0.5–1 µg m−3). Over North America fSOA-iv concentrations are relatively high over a large area covering the eastern USA, the Californian Penin-sula and northern Mexico (0.5–1 µg m−3), while over South America high fSOA-iv concentrations occur mostly over Rio de Janeiro (0.5–1 µg m−3). Long-range transport is also im-portant for the modeled fSOA-iv concentrations over the oceans. This is mostly evident over the Arabian Sea, where the fSOA-iv concentration is 1–2 µg m−3, mainly due to
long-range transport of fSOA-iv from India. The Atlantic Ocean atmosphere is influenced by IVOC emissions from western Africa and the fSOA-iv concentration over this re-gion is estimated at 0.5–1 µg m−3. Over the Pacific Ocean fSOA-iv is sensitive to long-range transport from the Los An-geles and Mexico City areas and from Beijing and other big cities in eastern China, resulting in significant concentrations off the west coast of California (up to 0.5–1 µg m−3)and the Pacific Rim (up to 0.5–1.5 µg m−3).
bbSOA-iv
46 Figure 8: Modeled average surface concentrations (in μg m-3) of (a) SOA-v from the oxidation 1267
of biogenic VOC emissions (bSOA-v) and (b) SOA-v from the oxidation of anthropogenic VOC 1268
emissions (aSOA-v) during the years 2005-2009. 1269
1270
(a)bSOA-v (b) aSOA-v
Figure 8. Modeled average surface concentrations (in µg m−3) of (a) SOA-v from the oxidation of biogenic VOC emissions (bSOA-v) and (b) SOA-v from the oxidation of anthropogenic VOC emissions (aSOA-v) during the years 2005–2009.
Southeast Asia (up to 1–5 µg m−3)and the boreal forests of Alaska, Canada, and Russia (0.5–1.5 µg m−3). The subtrop-ical west coasts of Africa, South America, and Indonesia are strongly influenced by long-range transport of bbSOA-iv. The strongest transport effect is expected over the Atlantic Ocean, where biomass burning IVOC emissions can travel thousands of kilometers from the sources (e.g., the Congo Basin rainforest), resulting in significant bbSOA-iv concen-trations (2–6 µg m−3).
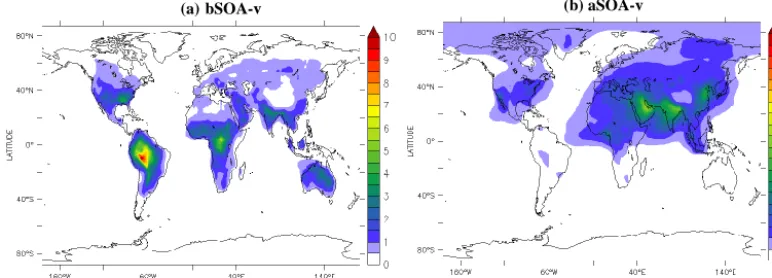
4.6 Secondary organic aerosol from VOCs
SOA-v is formed from the oxidation of biogenic and an-thropogenic VOCs. Global VOC emissions are dominated by biogenic compounds from vegetated areas (Kanakidou et al., 2005). However, anthropogenic VOCs, emitted in urban ar-eas, can also contribute significantly to SOA formation, es-pecially considering the aging reactions of aSOA-v.
bSOA-v
The global and land average surface concentrations of bSOA-v are 0.28 µg m−3(Fig. 8a). EMAC calculates highest bSOA-v concentrations obSOA-ver the Amazon rainforest (5–10 µg m−3), mostly due to the oxidation of isoprene. Over the Congo Basin rainforest, where isoprene emissions are similar to monoterpene emissions, the bSOA-v average surface con-centration is 3–6 µg m−3. bSOA-v concentrations are also relatively high over Southeast Asia (2–4 µg m−3), the south-eastern USA and Australia (2–5 µg m−3), and Europe (0.5– 1.5 µg m−3).
aSOA-v
The global and land average surface concentrations of aSOA-v are 0.23 µg m−3 (Fig. 8b). Photochemical aging adds sig-nificantly to aSOA-v since only 10 % of the modeled aSOA-v is formed from the first photooxidation step of aSOA-v. The remaining 90 % is formed through the continued oxidation of
aSOA-v. The aggressive aging of aSOA-v results in a wider distribution of aSOA-v than bSOA-v and in a significant con-tribution of v to the total SOA-v (45 %). The aSOA-v is modeled to haaSOA-ve a continental background of around 0.5 µg m−3and relatively high concentrations in the vicinity of urban areas. The highest concentrations occur over India, Bangladesh, and the Persian Gulf (2–3 µg m−3). Over India, aromatics dominate the aVOC emissions (57 %), followed by alkanes (29 %) and olefins (14 %). Over the Persian Gulf re-gion, alkenes are the dominant aVOC (65 %), followed by aromatics (33 %) and olefins (2 %). However, these numbers do not proportionally reflect the VOC contributions to the aSOA-v formation since different types of aVOC have differ-ent aerosol yields. Over Europe, the highest aSOA-v concen-trations occur over the Mediterranean Basin (0.5–1 µg m−3) due to the long-range transport of aSOA-v from central Eu-ropean emissions. Over the USA, aSOA-v concentrations are relatively high over California and the eastern USA (around 1 µg m−3).
4.7 Chemical composition of OA
47 1272
1273
1274
1275
1276
1277
1278
1279
1280
Figure 9: Modeled average zonal concentrations (in μg m-3) of (a) POA (sum of fPOA and
1281
bbPOA) and (b) SOA (sum of fSOA-sv, bbSOA-sv, fSOA-iv, bbSOA-iv, aSOA-v, and bSOA-v)
1282
during the years 2005-2009.
1283
1284
1285
(b) SOA (a)POA
Figure 9. Modeled average zonal concentrations (in µg m−3) of (a) POA (sum of fPOA and bbPOA) and (b) SOA (sum of fSOA-sv, bbSOA-sv, fSOA-iv, bbSOA-iv, aSOA-v, and bSOA-v) during the years 2005–2009.
Even if this fraction may be overestimated due to the aggres-sive aging of IVOCs and aVOCs applied in this study, it cor-roborates the findings of recent studies that highlight the po-tentially large impact of anthropogenic OA, especially SOA, on the global aerosol load (Spracklen et al., 2011; Carslaw et al., 2013; Lee et al., 2013).
At higher altitudes the production of SOA is enhanced since organic gases can be efficiently transported vertically and oxidized, forming lower volatility SOA (Fig. 9). In addi-tion, the produced SOA at higher altitudes has a relatively long lifetime since it is less subjected to wet and dry de-position. This results in a higher fraction of SOA in total OA in the free troposphere than at the surface (92 % com-pared to 82 % at the surface). Furthermore, in contrast to the surface OA composition, the fraction of aSOA-v in the free troposphere is calculated to be higher than bSOA-v since the latter is not allowed to participate in additional photo-chemical reactions (Table 7). The modeled tropospheric bur-den of POA is 0.23 Tg, the sum of SOA-sv and SOA-iv is 1.57 Tg, and SOA-v is 1.2 Tg. Pye and Seinfeld (2010) esti-mated 0.03 Tg of POA, 0.90 Tg of SOA-sv and SOA-iv, and 0.71 Tg of SOA-v, while Jathar et al. (2011) found 0.09 Tg of POA, 1.25 Tg of SOA-sv and SOA-iv, and 1.02 Tg of SOA-v. Farina et al. (2010) and Jo et al. (2013) did not account for SOA-sv and SOA-iv and calculated 1.1 and 0.8 Tg of POA, respectively, and 0.98 and 1.16 Tg of SOA-v, respectively.
5 Conclusions
A new module describing the organic composition of aerosols and the evolution in the atmosphere has been de-veloped and implemented into the global EMAC model. ORACLE treats fossil-fuel-, biofuel-, and biomass-burning-related aerosol emissions as semivolatile and chemically re-active, and also accounts for the emissions and oxidation of IVOCs as an additionally important source of OA. Further-more, it considers the formation of SOA from the oxidation of anthropogenic and biogenic VOC precursors. The model
employs the volatility basis set theory to simulate the emis-sions, chemical reactions, and phase partitioning of all OA components.
The comparison of the model results with measured am-bient OA mass concentrations illustrates that, by treating fuel combustion and biomass burning aerosol emissions as semivolatile and reactive, and accounting for emissions and oxidation of IVOCs and traditional VOCs, the model real-istically represents the sources, chemistry, and properties of OA, and reproduces the measured concentrations of OA over urban and forested areas. In contrast to previous CCMs that treat POA as nonvolatile and nonreactive, the ORACLE mod-ule calculates that most of the OA is SOA (82 %). Further-more, approximately one-third of OA is estimated to origi-nate from anthropogenic sources. Such high anthropogenic OA fractions challenge the results of the traditional CCMs and add to the most recent findings that suggest a strong con-tribution of anthropogenic sources to global OA concentra-tions.
allowed to participate in aging reactions, which considerably increases the modeled aSOA-v concentration.
The ORACLE module subdivides OA into several com-pounds, allowing the quantification of primary versus sec-ondary as well as biogenic versus anthropogenic contribu-tions to OA concentracontribu-tions. Such fundamental information can shed light on long-term changes in OA abundance, and hence project the effects of OA on future air quality and cli-mate. ORACLE is well suited for studying the climatic im-pact of OA as it captures the dynamic aging of OA and its at-mospheric evolution by becoming increasingly oxidized, less volatile, and more hygroscopic. Future applications will also include the effects on cloud condensation nuclei and indirect aerosol effects on climate. Furthermore, the detailed compo-sition of OA, computed by ORACLE, can be used to directly compare model predictions with the latest aerosol mass spec-trometer (AMS) factor analysis data, which is planned as a next application.
Overall, ORACLE is a flexible module that efficiently de-scribes the organic aerosol composition and chemical evolu-tion in the atmosphere. Sensitivity studies of the influence of several parameters (such as reaction constants, aerosol yields, and SVOC and IVOC emission fractions) on the model calculations will be conducted in a planned future study and used, along with AMS factor analysis data taken around the world, to optimize the model configuration to fur-ther improve the estimates of OA concentrations and investi-gate their role in air quality and climate.
Code availability
The complete ORACLE code can be obtained upon re-quest by emailing the first author. To use ORACLE as part of EMAC, please first apply for an ECHAM5 and a MESSy license. The GCM ECHAM5 was devel-oped at the Max Planck Institute for Meteorology in Hamburg (see http://www.mpimet.mpg.de/en/wissenschaft/ modelle/echam/echam5.html). The Modular Earth Submodel System (MESSy) is continuously further developed and ap-plied by a consortium of institutions, initiated by the Max Planck Institute for Chemistry. The usage of MESSy and ac-cess to the source code is licensed to all affiliates of institu-tions that are members of the MESSy Consortium. Institu-tions can become a member of the MESSy Consortium by signing the MESSy Memorandum of Understanding. More information can be found on the MESSy Consortium web-site (http://www.messy-interface.org).
Acknowledgements. The research leading to these results
has received funding from the European Research Council through the European Union’s Seventh Framework Programme (FP7/2007-2013)/ERC grant agreement no. 226144. V. A. Karydis acknowledges support from a FP7 Marie Curie Career Integration Grant (project reference 618349).
The service charges for this open access publication have been covered by the Max Planck Society.
Edited by: G. Mann
References
Aiken, A. C., Decarlo, P. F., Kroll, J. H., Worsnop, D. R., Huff-man, J. A., Docherty, K. S., Ulbrich, I. M., Mohr, C., Kimmel, J. R., Sueper, D., Sun, Y., Zhang, Q., Trimborn, A., Northway, M., Ziemann, P. J., Canagaratna, M. R., Onasch, T. B., Alfarra, M. R., Prevot, A. S. H., Dommen, J., Duplissy, J., Metzger, A., Baltensperger, U., and Jimenez, J. L.: O/C and OM/OC ra-tios of primary, secondary, and ambient organic aerosols with high-resolution time-of-flight aerosol mass spectrometry, Envi-ronmen. Sci. Technol., 42, 4478–4485, 2008.
Aiken, A. C., Salcedo, D., Cubison, M. J., Huffman, J. A., DeCarlo, P. F., Ulbrich, I. M., Docherty, K. S., Sueper, D., Kimmel, J. R., Worsnop, D. R., Trimborn, A., Northway, M., Stone, E. A., Schauer, J. J., Volkamer, R. M., Fortner, E., de Foy, B., Wang, J., Laskin, A., Shutthanandan, V., Zheng, J., Zhang, R., Gaffney, J., Marley, N. A., Paredes-Miranda, G., Arnott, W. P., Molina, L. T., Sosa, G., and Jimenez, J. L.: Mexico City aerosol analysis during MILAGRO using high resolution aerosol mass spectrom-etry at the urban supersite (T0) – Part 1: Fine particle composi-tion and organic source apporcomposi-tionment, Atmos. Chem. Phys., 9, 6633–6653, doi:10.5194/acp-9-6633-2009, 2009.
Athanasopoulou, E., Vogel, H., Vogel, B., Tsimpidi, A. P., Pandis, S. N., Knote, C., and Fountoukis, C.: Modeling the meteoro-logical and chemical effects of secondary organic aerosols dur-ing an EUCAARI campaign, Atmos. Chem. Phys., 13, 625–645, doi:10.5194/acp-13-625-2013, 2013.
Bergström, R., Denier van der Gon, H. A. C., Prévôt, A. S. H., Yttri, K. E., and Simpson, D.: Modelling of organic aerosols over Eu-rope (2002–2007) using a volatility basis set (VBS) framework: application of different assumptions regarding the formation of secondary organic aerosol, Atmos. Chem. Phys., 12, 8499–8527, doi:10.5194/acp-12-8499-2012, 2012.
Brito, J., Rizzo, L. V., Morgan, W. T., Coe, H., Johnson, B., Hay-wood, J., Longo, K., Freitas, S., Andreae, M. O., and Artaxo, P.: Ground-based aerosol characterization during the South Amer-ican Biomass Burning Analysis (SAMBBA) field experiment, Atmos. Chem. Phys., 14, 12069–12083, doi:10.5194/acp-14-12069-2014, 2014.
Browne, E. C., Min, K.-E., Wooldridge, P. J., Apel, E., Blake, D. R., Brune, W. H., Cantrell, C. A., Cubison, M. J., Diskin, G. S., Jimenez, J. L., Weinheimer, A. J., Wennberg, P. O., Wisthaler, A., and Cohen, R. C.: Observations of total RONO2over the boreal forest: NOxsinks and HNO3sources, Atmos. Chem. Phys., 13, 4543–4562, doi:10.5194/acp-13-4543-2013, 2013.
Capes, G., Johnson, B., McFiggans, G., Williams, P. I., Haywood, J., and Coe, H.: Aging of biomass burning aerosols over West Africa: Aircraft measurements of chemical composition, mi-crophysical properties, and emission ratios, J. Geophys. Res.-Atmos., 113, D00C15, doi:10.1029/2008jd009845, 2008. Capes, G., Murphy, J. G., Reeves, C. E., McQuaid, J. B.,
H.: Secondary organic aerosol from biogenic VOCs over West Africa during AMMA, Atmos. Chem. Phys., 9, 3841–3850, doi:10.5194/acp-9-3841-2009, 2009.
Carslaw, K. S., Lee, L. A., Reddington, C. L., Mann, G. W., and Pringle, K. J.: The magnitude and sources of uncertainty in global aerosol, Faraday Discuss., 165, 495–512, 2013.
Carter, W. P. L.: Documentation of the SAPRC-99 chemical mech-anism for VOC reactivity assessment, Report to the California air resources board, available at: http://www.cert.ucr.edu/~carter/ absts.htm#saprc99 (last access: 7 August 2014), 2000.
Chen, Q., Farmer, D. K., Schneider, J., Zorn, S. R., Heald, C. L., Karl, T. G., Guenther, A., Allan, J. D., Robinson, N., Coe, H., Kimmel, J. R., Pauliquevis, T., Borrmann, S., Poeschl, U., An-dreae, M. O., Artaxo, P., Jimenez, J. L., and Martin, S. T.: Mass spectral characterization of submicron biogenic organic parti-cles in the Amazon Basin, Geophys. Res. Lett., 36, L20806, doi:10.1029/2009gl039880, 2009.
Clarke, L., Edmonds, J., Jacoby, H., Pitcher, H., Reilly, J., and Richels, R.: Scenarios of greenhouse gas emissions and atmo-spheric concentrations (Part A) and review of integrated scenario development and application (Part B), A report by the US climate change science program and the subcommittee on global change research, 2007.
de Meij, A., Pozzer, A., Pringle, K. J., Tost, H., and Lelieveld, J.: EMAC model evaluation and analysis of atmospheric aerosol properties and distribution with a focus on the Mediterranean re-gion, Atmos. Res., 114, 38–69, 2012.
Dentener, F., Kinne, S., Bond, T., Boucher, O., Cofala, J., Generoso, S., Ginoux, P., Gong, S., Hoelzemann, J. J., Ito, A., Marelli, L., Penner, J. E., Putaud, J.-P., Textor, C., Schulz, M., van der Werf, G. R., and Wilson, J.: Emissions of primary aerosol and precur-sor gases in the years 2000 and 1750 prescribed data-sets for Ae-roCom, Atmos. Chem. Phys., 6, 4321–4344, doi:10.5194/acp-6-4321-2006, 2006.
Donahue, N. M., Robinson, A. L., Stanier, C. O., and Pandis, S. N.: Coupled partitioning, dilution, and chemical aging of semivolatile organics, Environ. Sci. Technol., 40, 2635–2643, 2006.
Donahue, N. M., Henry, K. M., Mentel, T. F., Kiendler-Scharr, A., Spindler, C., Bohn, B., Brauers, T., Dorn, H. P., Fuchs, H., Till-mann, R., Wahner, A., Saathoff, H., NauTill-mann, K.-H., Moehler, O., Leisner, T., Mueller, L., Reinnig, M.-C., Hoffmann, T., Salo, K., Hallquist, M., Frosch, M., Bilde, M., Tritscher, T., Barmet, P., Praplan, A. P., DeCarlo, P. F., Dommen, J., Prevot, A. S. H., and Baltensperger, U.: Aging of biogenic secondary organic aerosol via gas-phase OH radical reactions, Proc. Natl. Aca. Sci. USA, 109, 13503–13508, doi:10.1073/pnas.1115186109, 2012. Donahue, N. M., Chuang, W., Epstein, S. A., Kroll, J. H., Worsnop,
D. R., Robinson, A. L., Adams, P. J., and Pandis, S. N.: Why do organic aerosols exist? Understanding aerosol lifetimes using the two-dimensional volatility basis set, Environ. Chem., 10, 151– 157, 2013.
Farina, S. C., Adams, P. J., and Pandis, S. N.: Modeling global secondary organic aerosol formation and processing with the volatility basis set: Implications for anthropogenic sec-ondary organic aerosol, J. Geophys. Res.-Atmos., 115, D09202, doi:10.1029/2009jd013046, 2010.
Fountoukis, C., Racherla, P. N., Denier van der Gon, H. A. C., Polymeneas, P., Charalampidis, P. E., Pilinis, C., Wiedensohler,
A., Dall’Osto, M., O’Dowd, C., and Pandis, S. N.: Evaluation of a three-dimensional chemical transport model (PMCAMx) in the European domain during the EUCAARI May 2008 cam-paign, Atmos. Chem. Phys., 11, 10331–10347, doi:10.5194/acp-11-10331-2011, 2011.
Fountoukis, C., Megaritis, A. G., Skyllakou, K., Charalampidis, P. E., Pilinis, C., Denier van der Gon, H. A. C., Crippa, M., Canonaco, F., Mohr, C., Prévôt, A. S. H., Allan, J. D., Poulain, L., Petäjä, T., Tiitta, P., Carbone, S., Kiendler-Scharr, A., Nemitz, E., O’Dowd, C., Swietlicki, E., and Pandis, S. N.: Organic aerosol concentration and composition over Europe: insights from com-parison of regional model predictions with aerosol mass spec-trometer factor analysis, Atmos. Chem. Phys., 14, 9061–9076, doi:10.5194/acp-14-9061-2014, 2014.
Grieshop, A. P., Logue, J. M., Donahue, N. M., and Robinson, A. L.: Laboratory investigation of photochemical oxidation of or-ganic aerosol from wood fires 1: measurement and simulation of organic aerosol evolution, Atmos. Chem. Phys., 9, 1263–1277, doi:10.5194/acp-9-1263-2009, 2009.
Heald, C. L., Jacob, D. J., Park, R. J., Russell, L. M., Huebert, B. J., Seinfeld, J. H., Liao, H., and Weber, R. J.: A large organic aerosol source in the free troposphere missing from current models, Geo-phys. Res. Lett., 32, L18809, doi:10.1029/2005gl023831, 2005. Hennigan, C. J., Miracolo, M. A., Engelhart, G. J., May, A. A.,
Presto, A. A., Lee, T., Sullivan, A. P., McMeeking, G. R., Coe, H., Wold, C. E., Hao, W.-M., Gilman, J. B., Kuster, W. C., de Gouw, J., Schichtel, B. A., Collett Jr., J. L., Kreidenweis, S. M., and Robinson, A. L.: Chemical and physical transformations of organic aerosol from the photo-oxidation of open biomass burning emissions in an environmental chamber, Atmos. Chem. Phys., 11, 7669–7686, doi:10.5194/acp-11-7669-2011, 2011. Hildebrandt, L., Donahue, N. M., and Pandis, S. N.: High
forma-tion of secondary organic aerosol from the photo-oxidaforma-tion of toluene, Atmos. Chem. Phys., 9, 2973–2986, doi:10.5194/acp-9-2973-2009, 2009.
Hildebrandt, L., Engelhart, G. J., Mohr, C., Kostenidou, E., Lanz, V. A., Bougiatioti, A., DeCarlo, P. F., Prevot, A. S. H., Bal-tensperger, U., Mihalopoulos, N., Donahue, N. M., and Pan-dis, S. N.: Aged organic aerosol in the Eastern Mediterranean: the Finokalia Aerosol Measurement Experiment – 2008, Atmos. Chem. Phys., 10, 4167–4186, doi:10.5194/acp-10-4167-2010, 2010.
Hildemann, L. M., Cass, G. R., and Markowski, G. R.: A dilution stack sampler for collection of organic aerosol emissions-Desigh, characterization and filed-tests, Aerosol Sci. Technol., 10, 193– 204, 1989.
Hodzic, A., Jimenez, J. L., Madronich, S., Canagaratna, M. R., De-Carlo, P. F., Kleinman, L., and Fast, J.: Modeling organic aerosols in a megacity: potential contribution of semi-volatile and inter-mediate volatility primary organic compounds to secondary or-ganic aerosol formation, Atmos. Chem. Phys., 10, 5491–5514, doi:10.5194/acp-10-5491-2010, 2010.