Anstey et al.BMC Neurology 2010, 10:62
http://www.biomedcentral.com/1471-2377/10/62
Open Access
R E S E A R C H A R T I C L E
© 2010 Anstey et al; licensee BioMed Central Ltd. This is an Open Access article distributed under the terms of the Creative Commons Attribution License (http://creativecommons.org/licenses/by/2.0), which permits unrestricted use, distribution, and reproduction in any medium, provided the original work is properly cited.
Research article
Estimates of probable dementia prevalence from
population-based surveys compared with
dementia prevalence estimates based on
meta-analyses
Kaarin J Anstey*
1, Richard A Burns
1, Carole L Birrell
2, David Steel
2, Kim M Kiely
1and Mary A Luszcz
3Abstract
Background: National data on dementia prevalence are not always available, yet it may be possible to obtain estimates from large surveys that include dementia screening instruments. In Australia, many of the dementia prevalence estimates are based on European data collected between 15 and 50 years ago. We derived population-based estimates of probable dementia and possible cognitive impairment in Australian studies using the Mini-Mental State Examination (MMSE), and compared these to estimates of dementia prevalence from meta-analyses of European studies.
Methods: Data sources included a pooled dataset of Australian longitudinal studies (DYNOPTA), and two Australian Bureau of Statistics National Surveys of Mental Health and Wellbeing. National rates of probable dementia (MMSE < 24) and possible cognitive impairment (24-26) were estimated using combined sample weights.
Results: Estimates of probable dementia were higher in surveys than in meta-analyses for ages 65-84, but were similar at ages 85 and older. Surveys used weights to account for sample bias, but no adjustments were made in meta-analyses. Results from DYNOPTA and meta-analyses had a very similar pattern of increase with age. Contrary to trends from some meta-analyses, rates of probable dementia were not higher among women in the Australian surveys. Lower education was associated with higher prevalence of probable dementia. Data from investigator-led longitudinal studies designed to assess cognitive decline appeared more reliable than government health surveys.
Conclusions: This study shows that estimates of probable dementia based on MMSE in studies where cognitive decline and dementia are a focus, are a useful adjunct to clinical studies of dementia prevalence. Such information and may be used to inform projections of dementia prevalence and the concomitant burden of disease.
Background
In 2005 it was estimated that the number of people with dementia in Australia reached 200,000 [1]. Recent projec-tions indicate that if there is no risk reduction at the pop-ulation level, the number of people with dementia in Australia will exceed 730,000 by 2050 [2]. In Australia, dementia will cause the largest burden of disease for women and 5th largest for men by 2016 [3]. These Aus-tralian figures were derived using a similar methodology to European studies that project future population
char-acteristics by age and sex [4] and took into account preva-lence estimates from four meta-analyses of mostly European studies [5-8]. Consequently, estimates of dementia prevalence in Australia are typically based on non-Australian studies and it is necessary to compare those estimates derived from European and North Amer-ica studies with large scale Australian studies.
Many of the dementia prevalence studies included in the source meta-analyses [5-8] were published 15 to 50 years ago, with the actual data often having been col-lected years prior to publication. For example, one meta-analysis is based on articles published between 1945 and 1985 [8], another analysed articles published between * Correspondence: kaarin.anstey@anu.edu.au
1 Centre for Mental Health Research, Australian National University, Canberra,
ACT, Australia
Anstey et al.BMC Neurology 2010, 10:62
http://www.biomedcentral.com/1471-2377/10/62
Page 2 of 12
1981 and 1991 (mean publication year 1988) [6] and a third covered publications between 1987 and 1994. Not all studies contributing to these meta-analyses were pop-ulation-based studies as some of the samples were drawn from medical practitioner lists [6]. Diagnostic criteria for dementia have changed since these studies were con-ducted and the methodology of meta-analyses has also become more rigorous with the publication of guidelines [9,10] and the development of the Cochrane Collabora-tion.
Whilst acknowledging that meta-analyses are the pre-ferred method for aggregating data on dementia preva-lence [1,2], their limitations prompt closer scrutiny of complementary sources of data. This is particularly important because prevalence estimates are used for ser-vice planning, and estimates of health care costs and bur-den of disease. When projected up to the population, small differences in prevalence rates have large implica-tions for estimating health care costs. For example, 1% increase in dementia for the year 2003 in Australia would have cost approximately AUD $217 million [11].
The aim of the present study was to compare preva-lence of probable dementia and cognitive impairment using MMSE cut-offs [12] with dementia prevalence esti-mates[1,2] generated by application of techniques used in meta-analyses of European studies. The MMSE, was cho-sen because it is the most widely used screening instru-ment for deinstru-mentia. Furthermore, the MMSE is used almost universally in clinics [13], is recommended as a dementia screen by the U.S. Preventive Services Task Force [14], has been translated into many languages, and has psychometric properties that have been well docu-mented in many contexts [15].
The current methodology was adopted not only because existing projections have relied on estimates that are at least 15 years old and largely based on meta-analy-ses of European data, but also because there is no national study of dementia prevalence in Australia that uses clinical diagnoses. This is in part due to the cost of acquiring dementia diagnoses and the logistical difficulty of conducting a national prevalence study over such a large land mass, in comparison to geographically smaller countries. Data come from two sources: Australian Bureau of Statistics (ABS) Surveys and a pooled, harmo-nized, dataset from DYNOPTA [16]. The latter includes three independent regional studies that have reported dementia prevalence in Australia, but none of these stud-ies individually is large enough on which to base national estimates. These include the Sydney Older Persons' study (SOPS) that used a clinical diagnosis [17,18], the Can-berra Longitudinal Study (CLS) that used an algorithm based on data collected by a trained interviewer [19], and the PATH Through Life Study (PATH) [20] that includes a clinical assessment but which to date has identified very
few cases because the sample is too young. These three studies all included the Mini-Mental State Examination as did a fourth study contributing to DYNOPTA, the Australian Longitudinal Study of Ageing (ALSA). While the latter did not include a clinical assessment of demen-tia, it included a cognitive assessment, and cognitive decline and impairment has been a focus of the investiga-tors. The ABS surveys recently have incorporated the MMSE, providing an additional source of data to evaluate for the estimation of probable dementia prevalence.
Methods Data sources
Anstey et al.BMC Neurology 2010, 10:62
http://www.biomedcentral.com/1471-2377/10/62
Page 3 of 12
evaluate the clinical cutoffs for the MMSE used in DYNOPTA in addition to the data provided by SOPS.
The second type of population-based data was the ABS National Surveys of Mental Health which were con-ducted in 1997 and 2007. The 1997 National Survey of Mental Health and Wellbeing of Adults (97 NSMH) was a stratified, multistage area sample of private dwellings framed by 1991 census collection districts. The sample included 10641 participants aged over 18, of whom 1788 were aged 65 or older and completed the MMSE [21]. A second survey conducted in 2007 (07 NSMH), was also framed by a stratified, multistage area sample of private dwellings that excluded remote areas. It included 8800 participants aged between 16 and 85 [22], of whom 1905 were aged 65 and over and completed the MMSE [23]. Table 1 shows the sample characteristics of the datasets.
Data preparation and variable description
MMSE item and total scores were imputed for DYNOPTA, 97 NSMH and 07 NSMH. For the DYNOPTA dataset, MMSE items from contributing studies were harmonized to provide equivalent scoring. Multiple imputation, using the MICE module in STATA v.10, computed total MMSE scores from available item
level data, age, sex, and education with a cohort variable that reflected the contributing study from which a partic-ipant was included. Five imputed datasets were computed from which total imputed scores were averaged to create an MMSE total score for the DYNOPTA data file. Due to study differences in coding of non-response, a conserva-tive approach was taken whereby all missing data was imputed, regardless of nature of non-response. Based on validation work of the imputation undertaken by the authors (not reported here), cases with more than 50% missing data (n = 105) on the MMSE were excluded. A further 437 (10.97%) had missing item level data on the MMSE which was imputed. For the NHMS datafiles the rates of missing data at item level were much lower for both the 97 (n = 61; 3.4%) and '07 (n = 88; 4.6%) datasets. The NSMH was imputed using the same method as that described for DYNOPTA. Categories based on MMSE scores were also created and divided according to proba-ble dementia (MMSE<24), possiproba-ble cognitive impairment (MMSE = 24 to 26) and no cognitive impairment (MMSE >26).
The cutoff of 23/24 for probable dementia is widely rec-ommended and has been validated in studies of the sensi-tivity and specificity of the MMSE [24-27]. The range
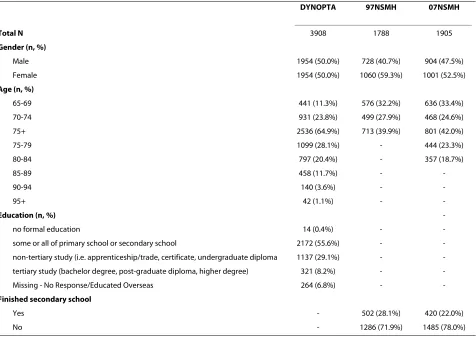
Table 1: Sample characteristics of DYNOPTA, the 97 NSMH and 07 NSMH
DYNOPTA 97NSMH 07NSMH
Total N 3908 1788 1905
Gender (n, %)
Male 1954 (50.0%) 728 (40.7%) 904 (47.5%)
Female 1954 (50.0%) 1060 (59.3%) 1001 (52.5%)
Age (n, %)
65-69 441 (11.3%) 576 (32.2%) 636 (33.4%)
70-74 931 (23.8%) 499 (27.9%) 468 (24.6%)
75+ 2536 (64.9%) 713 (39.9%) 801 (42.0%)
75-79 1099 (28.1%) - 444 (23.3%)
80-84 797 (20.4%) - 357 (18.7%)
85-89 458 (11.7%) -
-90-94 140 (3.6%) -
-95+ 42 (1.1%) -
-Education (n, %)
-no formal education 14 (0.4%) -
-some or all of primary school or secondary school 2172 (55.6%) -
-non-tertiary study (i.e. apprenticeship/trade, certificate, undergraduate diploma 1137 (29.1%) -
-tertiary study (bachelor degree, post-graduate diploma, higher degree) 321 (8.2%) -
-Missing - No Response/Educated Overseas 264 (6.8%) -
-Finished secondary school
Yes - 502 (28.1%) 420 (22.0%)
Anstey et al.BMC Neurology 2010, 10:62
http://www.biomedcentral.com/1471-2377/10/62
Page 4 of 12
from 24 to 26 has less empirical support for defining pos-sible cognitive impairment than the cut-off of < 24 does for defining probable dementia. It was based on the only Australian epidemiological data on MMSE ranges in mild cognitive disorders from the PATH Through Life Study [20]. This study provided clinical diagnoses of mild cog-nitive disorders that were used to validate the MMSE score.
Demographic variables
Demographic variables included in the analyses were age-group, sex and education. The 97NMHS only recorded a categorical age value for participants aged over 75, so the data for this age-group is aggregated. The education vari-able for DYNOPTA included four levels (No formal edu-cation, some or all primary or secondary school, post-secondary, and tertiary study). The education variable for the 97 NSMH was a binary variable indicating whether the respondent had finished secondary school. A compat-ible binary variable was created from the 07 NSMH item asking the highest year of school completed.
Study weights and Statistical analyses
To produce estimates from a sample survey weights are usually calculated to account for differences in probabili-ties of selection and to ensure consistency with popula-tion benchmarks. Weights are provided for NSMH participants at both time waves. For the DYNOPTA pop-ulation, weights were already available for ALSA but CLS, PATH and SOPS did not have study weights available. For each of these studies weights were developed to adjust the sample in each study to the specific population from which it was drawn and account for the probability of selection of each individual. These weights were then benchmarked to the Estimated Resident Population (ERP) for the relevant year, sex, age-group and geographi-cal area. For ALSA, the 1992 ERP for Adelaide was used; for CLS, the 1991 ERP for ACT was used; for PATH, the 2001 ERP for ACT was used; and for SOPS, the 1991 ERP for the two relevant groupings of Local Government Areas (LGA) in Sydney were used. To enable analysis using the pooled data set, which consists of the data from the four studies, final combined weights were calculated. The final weights combined the study specific weights according to their contributing sample sizes to the pooled data set. These combined weights were then bench-marked by age-group and sex to the 1991 Australian ERP and then used in the estimation. Although the PATH study was conducted in 2001, it only contributed to the 65-69 year age-group. The estimated standard errors for the prevalence estimates take into account the use of weights and the complex survey design for each study and also the number of multiple imputations used in the analysis. Using the combined weights in the estimation
procedure adjusts for the unequal probabilities of selec-tion in the studies and allows for the contribuselec-tion of the individual study to the pooled data set. For the mean esti-mates reported in Table 2, the weighted estiesti-mates were very similar to the unweighted estimates. For the estima-tion of the proporestima-tions in Table 3, the weights had more impact on the proportions when the sample size within the age-group by sex cell is small, such as in the over 90 age-groups for males.
Comparisons between datasets were conducted using tests of proportions. Logistic regression was used to eval-uate gender by age interactions in prevalence of probable dementia. The sensitivity and specificity of the newly cre-ated MMSE probable dementia diagnosis in DYNOPTA was validated by comparing it with data available on clin-ical diagnoses for the SOPS [17] and CLS [19] studies that contributed to the DYNOPTA pooled dataset. Sample weights were used in analyses of DYNOPTA, the 97 NSMH and the 07 NSMH.
Results
Description of samples
The sample characteristics of the DYNOPTA, 97 NSMH and 07 NSMH are shown in Table 1. DYNOPTA has equal proportions of males and females, while the 97 NSMH (χ2 = 61.447; df = 1; p < .001) and 07 NSMH (χ2 =
4,738; df = 1; p < .05) have higher proportion of females. The 97 NSMH lacks information on age by year for adults aged over 75 years which limits comparison with other data.
The information on education for each study was dif-ferent and hence could not be harmonized. In DYNOPTA, whilst nearly half the sample completed some or all schooling, 37.3% reported post-secondary training, including 8.2% who undertook some tertiary studies. In the 97 NSMH and 07 NSMH only 28% and 21% reported finishing their secondary schooling respec-tively.
Sensitivity and specificity of the MMSE in DYNOPTA
Anstey
et al
.
B
M
C Neur
ol
og
y
2
010
,
10
:6
2
htt
p
:/
/ww
w
.biom
e
dcentr
al.
com/147
1-23
77/1
0
/62
Pa
g
e
5 o
f 12
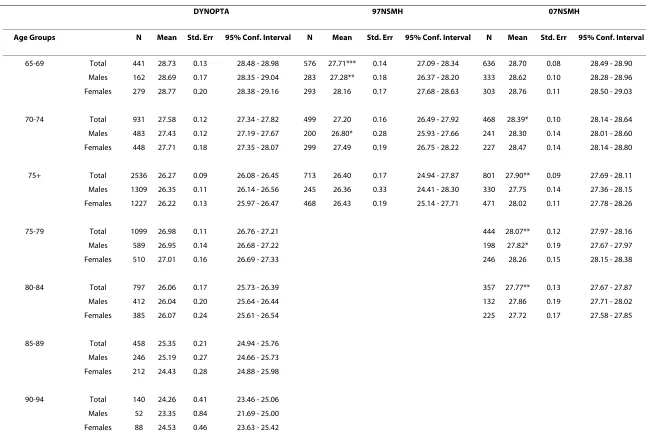
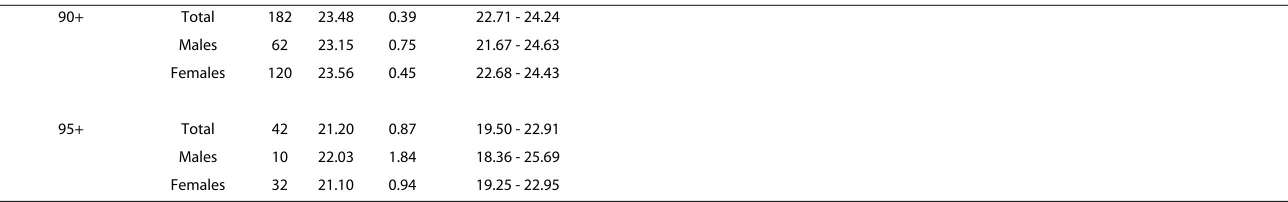
Table 2: Mean (standard error) of MMSE scores for the DYNOPTA baseline population and NSMH (aged 65+) as a whole, by gender and by age cohort
DYNOPTA 97NSMH 07NSMH
Age Groups N Mean Std. Err 95% Conf. Interval N Mean Std. Err 95% Conf. Interval N Mean Std. Err 95% Conf. Interval
65-69 Total 441 28.73 0.13 28.48 - 28.98 576 27.71*** 0.14 27.09 - 28.34 636 28.70 0.08 28.49 - 28.90 Males 162 28.69 0.17 28.35 - 29.04 283 27.28** 0.18 26.37 - 28.20 333 28.62 0.10 28.28 - 28.96 Females 279 28.77 0.20 28.38 - 29.16 293 28.16 0.17 27.68 - 28.63 303 28.76 0.11 28.50 - 29.03
70-74 Total 931 27.58 0.12 27.34 - 27.82 499 27.20 0.16 26.49 - 27.92 468 28.39* 0.10 28.14 - 28.64 Males 483 27.43 0.12 27.19 - 27.67 200 26.80* 0.28 25.93 - 27.66 241 28.30 0.14 28.01 - 28.60 Females 448 27.71 0.18 27.35 - 28.07 299 27.49 0.19 26.75 - 28.22 227 28.47 0.14 28.14 - 28.80
75+ Total 2536 26.27 0.09 26.08 - 26.45 713 26.40 0.17 24.94 - 27.87 801 27.90** 0.09 27.69 - 28.11 Males 1309 26.35 0.11 26.14 - 26.56 245 26.36 0.33 24.41 - 28.30 330 27.75 0.14 27.36 - 28.15 Females 1227 26.22 0.13 25.97 - 26.47 468 26.43 0.19 25.14 - 27.71 471 28.02 0.11 27.78 - 28.26
75-79 Total 1099 26.98 0.11 26.76 - 27.21 444 28.07** 0.12 27.97 - 28.16
Males 589 26.95 0.14 26.68 - 27.22 198 27.82* 0.19 27.67 - 27.97
Females 510 27.01 0.16 26.69 - 27.33 246 28.26 0.15 28.15 - 28.38
80-84 Total 797 26.06 0.17 25.73 - 26.39 357 27.77** 0.13 27.67 - 27.87
Males 412 26.04 0.20 25.64 - 26.44 132 27.86 0.19 27.71 - 28.02
Females 385 26.07 0.24 25.61 - 26.54 225 27.72 0.17 27.58 - 27.85
85-89 Total 458 25.35 0.21 24.94 - 25.76 Males 246 25.19 0.27 24.66 - 25.73 Females 212 24.43 0.28 24.88 - 25.98
Anstey
et al
.
B
M
C Neur
ol
og
y
2
010
,
10
:6
2
htt
p
:/
/ww
w
.biom
e
dcentr
al.
com/147
1-23
77/1
0
/62
Pa
g
e
6 o
f 12
90+ Total 182 23.48 0.39 22.71 - 24.24 Males 62 23.15 0.75 21.67 - 24.63 Females 120 23.56 0.45 22.68 - 24.43
95+ Total 42 21.20 0.87 19.50 - 22.91 Males 10 22.03 1.84 18.36 - 25.69 Females 32 21.10 0.94 19.25 - 22.95
* p < .05; ** p < .001 t-test analyses between gender were computed within each study for each Age Group category. t-test analyses for between DYNOPTA and both NSMH surveys were computed for total within each Age Group category.
Anstey et al . B M C Neur ol og y 2 010 , 10 :6 2 htt p :/ /ww w .biom e dcentr al. com/147 1-23 77/1 0 /62 Pa g e 7 o f 12
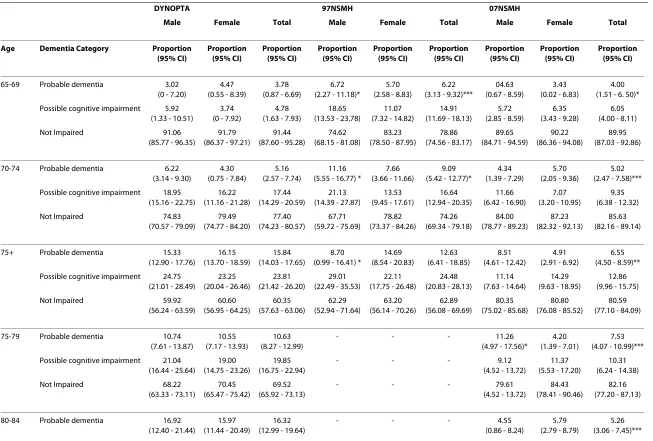
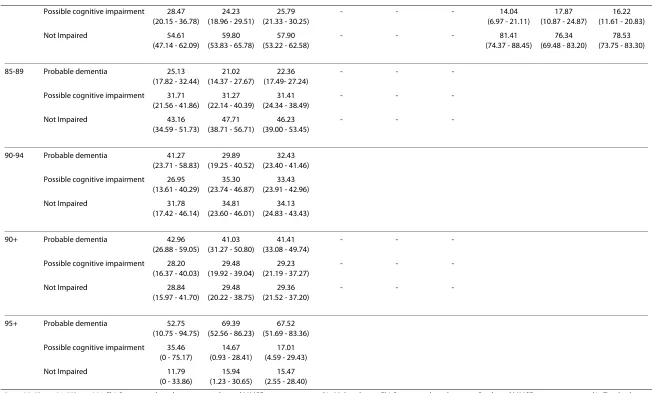
Table 3: Proportion of samples with probable dementia and possible cognitive impairment in DYNOPTA and by by gender and by age cohort
DYNOPTA 97NSMH 07NSMH
Male Female Total Male Female Total Male Female Total
Age Dementia Category Proportion (95% CI) Proportion (95% CI) Proportion (95% CI) Proportion (95% CI) Proportion (95% CI) Proportion (95% CI) Proportion (95% CI) Proportion (95% CI) Proportion (95% CI)
65-69 Probable dementia 3.02 (0 - 7.20)
4.47 (0.55 - 8.39)
3.78 (0.87 - 6.69)
6.72 (2.27 - 11.18)*
5.70 (2.58 - 8.83)
6.22 (3.13 - 9.32)***
04.63 (0.67 - 8.59)
3.43 (0.02 - 6.83)
4.00 (1.51 - 6. 50)* Possible cognitive impairment 5.92
(1.33 - 10.51)
3.74 (0 - 7.92)
4.78 (1.63 - 7.93)
18.65 (13.53 - 23.78)
11.07 (7.32 - 14.82)
14.91 (11.69 - 18.13)
5.72 (2.85 - 8.59)
6.35 (3.43 - 9.28)
6.05 (4.00 - 8.11)
Not Impaired 91.06
(85.77 - 96.35)
91.79 (86.37 - 97.21)
91.44 (87.60 - 95.28)
74.62 (68.15 - 81.08)
83.23 (78.50 - 87.95)
78.86 (74.56 - 83.17)
89.65 (84.71 - 94.59)
90.22 (86.36 - 94.08)
89.95 (87.03 - 92.86)
70-74 Probable dementia 6.22 (3.14 - 9.30)
4.30 (0.75 - 7.84)
5.16 (2.57 - 7.74)
11.16 (5.55 - 16.77) *
7.66 (3.66 - 11.66)
9.09 (5.42 - 12.77)*
4.34 (1.39 - 7.29)
5.70 (2.05 - 9.36)
5.02 (2.47 - 7.58)*** Possible cognitive impairment 18.95
(15.16 - 22.75)
16.22 (11.16 - 21.28)
17.44 (14.29 - 20.59)
21.13 (14.39 - 27.87)
13.53 (9.45 - 17.61)
16.64 (12.94 - 20.35)
11.66 (6.42 - 16.90)
7.07 (3.20 - 10.95)
9.35 (6.38 - 12.32)
Not Impaired 74.83
(70.57 - 79.09)
79.49 (74.77 - 84.20)
77.40 (74.23 - 80.57)
67.71 (59.72 - 75.69)
78.82 (73.37 - 84.26)
74.26 (69.34 - 79.18)
84.00 (78.77 - 89.23)
87.23 (82.32 - 92.13)
85.63 (82.16 - 89.14)
75+ Probable dementia 15.33 (12.90 - 17.76)
16.15 (13.70 - 18.59)
15.84 (14.03 - 17.65)
8.70 (0.99 - 16.41) *
14.69 (8.54 - 20.83)
12.63 (6.41 - 18.85)
8.51 (4.61 - 12.42)
4.91 (2.91 - 6.92)
6.55 (4.50 - 8.59)** Possible cognitive impairment 24.75
(21.01 - 28.49)
23.25 (20.04 - 26.46)
23.81 (21.42 - 26.20)
29.01 (22.49 - 35.53)
22.11 (17.75 - 26.48)
24.48 (20.83 - 28.13)
11.14 (7.63 - 14.64)
14.29 (9.63 - 18.95)
12.86 (9.96 - 15.75)
Not Impaired 59.92
(56.24 - 63.59)
60.60 (56.95 - 64.25)
60.35 (57.63 - 63.06)
62.29 (52.94 - 71.64)
63.20 (56.14 - 70.26)
62.89 (56.08 - 69.69)
80.35 (75.02 - 85.68)
80.80 (76.08 - 85.52)
80.59 (77.10 - 84.09)
75-79 Probable dementia 10.74 (7.61 - 13.87)
10.55 (7.17 - 13.93)
10.63 (8.27 - 12.99)
- - - 11.26
(4.97 - 17.56)*
4.20 (1.39 - 7.01)
7.53 (4.07 - 10.99)*** Possible cognitive impairment 21.04
(16.44 - 25.64)
19.00 (14.75 - 23.26)
19.85 (16.75 - 22.94)
- - - 9.12
(4.52 - 13.72)
11.37 (5.53 - 17.20)
10.31 (6.24 - 14.38)
Not Impaired 68.22
(63.33 - 73.11)
70.45 (65.47 - 75.42)
69.52 (65.92 - 73.13)
- - - 79.61
(4.52 - 13.72)
84.43 (78.41 - 90.46)
82.16 (77.20 - 87.13)
80-84 Probable dementia 16.92 (12.40 - 21.44)
15.97 (11.44 - 20.49)
16.32 (12.99 - 19.64)
- - - 4.55
(0.86 - 8.24)
5.79 (2.79 - 8.79)
Anstey
et al
.
B
M
C Neur
ol
og
y
2
010
,
10
:6
2
htt
p
:/
/ww
w
.biom
e
dcentr
al.
com/147
1-23
77/1
0
/62
Pa
g
e
8 o
f 12
Possible cognitive impairment 28.47 (20.15 - 36.78)
24.23 (18.96 - 29.51)
25.79 (21.33 - 30.25)
- - - 14.04
(6.97 - 21.11)
17.87 (10.87 - 24.87)
16.22 (11.61 - 20.83)
Not Impaired 54.61
(47.14 - 62.09)
59.80 (53.83 - 65.78)
57.90 (53.22 - 62.58)
- - - 81.41
(74.37 - 88.45)
76.34 (69.48 - 83.20)
78.53 (73.75 - 83.30)
85-89 Probable dementia 25.13 (17.82 - 32.44)
21.02 (14.37 - 27.67)
22.36 (17.49- 27.24)
- -
-Possible cognitive impairment 31.71 (21.56 - 41.86)
31.27 (22.14 - 40.39)
31.41 (24.34 - 38.49)
- -
-Not Impaired 43.16
(34.59 - 51.73)
47.71 (38.71 - 56.71)
46.23 (39.00 - 53.45)
- -
-90-94 Probable dementia 41.27 (23.71 - 58.83)
29.89 (19.25 - 40.52)
32.43 (23.40 - 41.46) Possible cognitive impairment 26.95
(13.61 - 40.29)
35.30 (23.74 - 46.87)
33.43 (23.91 - 42.96)
Not Impaired 31.78
(17.42 - 46.14)
34.81 (23.60 - 46.01)
34.13 (24.83 - 43.43)
90+ Probable dementia 42.96 (26.88 - 59.05)
41.03 (31.27 - 50.80)
41.41 (33.08 - 49.74)
- -
-Possible cognitive impairment 28.20 (16.37 - 40.03)
29.48 (19.92 - 39.04)
29.23 (21.19 - 37.27)
- -
-Not Impaired 28.84
(15.97 - 41.70)
29.48 (20.22 - 38.75)
29.36 (21.52 - 37.20)
- -
-95+ Probable dementia 52.75 (10.75 - 94.75)
69.39 (52.56 - 86.23)
67.52 (51.69 - 83.36) Possible cognitive impairment 35.46
(0 - 75.17)
14.67 (0.93 - 28.41)
17.01 (4.59 - 29.43)
Not Impaired 11.79
(0 - 33.86)
15.94 (1.23 - 30.65)
15.47 (2.55 - 28.40)
* p < .05; ** p < .01; *** p < .001 Chi-Square analyses between gender and MMSE category reported in Male column. Chi-Square analyses between Study and MMSE category reported in Total column under the NMHS surveys (ref is DYNOPTA). Yates' correction used where appropriate
Anstey et al.BMC Neurology 2010, 10:62
http://www.biomedcentral.com/1471-2377/10/62
Page 9 of 12
were not available to evaluate the validity of the MMSE cut-off in the 97 NSMH or 07 NSMH.
Comparison of mean MMSE scores by age and sex
Table 2 shows the mean MMSE scores by age groups and sex for all studies. As the breakdown of ages over 75 was not available for the 97 NSMH, and cognitive impairment increases with age, it was not possible to determine whether differences in mean MMSE scores above 75 were due to different age distributions between studies. Simi-larly the 07 NSMH only included data up to age 84 so that beyond this age, there are no available survey data within Australia for comparison with DYNOPTA.
With few exceptions, results across datasets were highly similar. Comparison of the 97 NSMH survey with DYNOPTA showed that the mean total MMSE was lower in the 97 NSMH than in DYNOPTA for males aged 65 to 69, and 70 to 74. However, comparison of the 07 NSMH survey and DYNOPTA showed that the total score was lower in DYNOPTA for ages 70-74, 75+ and 75-79, and 80-84.
The 07 NSMH had higher mean MMSE scores than the 97 NSMH in the 65-69 (t(1338) = 6.73, p < .001) 70-74 (t (1.58) = 6.59, p < .001) and 75+ age-groups (t (1672) = 8.71, p < .001).
Comparison of probable dementia and possible cognitive impairment by age and sex
Table 3 shows the proportion of the DYNOPTA and NSMH samples with probable dementia and possible cognitive impairment according to the MMSE, split by sex and age-group. There were no significant sex differ-ences in rates of probable dementia or impairment in the DYNOPTA sample. Probable dementia was more preva-lent in males than females in the 65-69 age-group and 70-74 age-group of the 97 NSMH. The finding that probable dementia was less prevalent in males than females in the
lower rates in the 75+ age-group is difficult to interpret because information was unavailable on the distribution of males and females in this age-group.
When males and females were combined to give a total prevalence rate, the 97 NSMH sample for 65-69 and the 70-74 year age groups had higher rates of probable dementia than DYNOPTA. When males and females were combined to give a total prevalence rate for the 07 NSMH sample, there was a higher rate of probable dementia in the 65-69 age-group, but lower rates in the 70-74 and 75+ age-groups in comparison with DYNOPTA. There were no significant differences between the 97 NSMH and 07 NSMH in rates of probable dementia.
Comparison of MMSE derived cut-offs with prevalence of dementia from meta-analyses
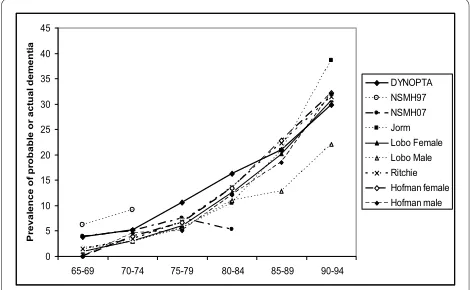
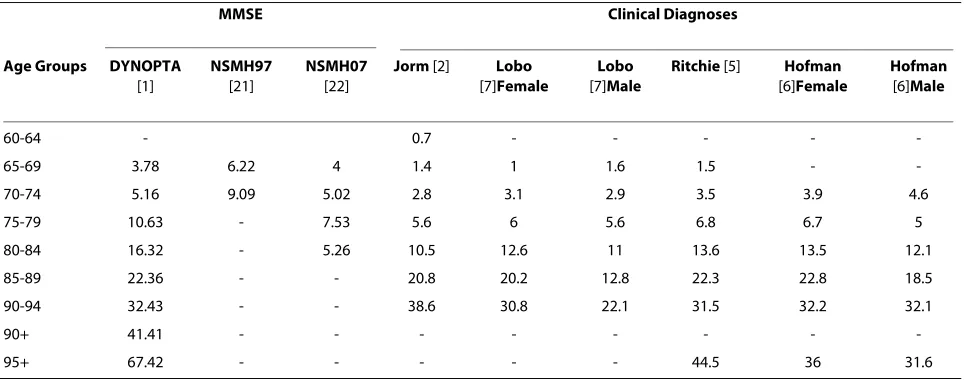
Table 4 shows the rates of probable dementia from DYNOPTA and the NSMH surveys compared with the prevalence of dementia from four meta-analyses included in the article by Jorm et al. [2]. For those aged 65-69, and 70-74 the rates of probable dementia from MMSE esti-mates are clearly higher than the estiesti-mates of dementia prevalence from clinical diagnoses, and the 97 NSMH stands out far above all other data sources. For the 75-79 and 80-84 age-groups DYNOPTA estimates are higher than the clinical estimates. For the 85-89 age-group and 90-94, the estimates from DYNOPTA are very similar to estimates from studies of clinical dementia. Estimates above the age of 95 are difficult to evaluate due to small numbers. The estimate from 07 NSMH for the 80-84 age-group appears to be far lower than any other published estimate. Figure 1 shows similar trajectories with age, for the prevalence of probable dementia derived from DYNOPTA and the meta-analyses. If the DYNOPTA estimates were projected onto the Australian population in 2008, the prevalence of dementia in the 65-69, 70-74, 75-79, 80-84 and 85+ age-groups would be 31450, 34232, 58479, 69173 and 148344 respectively [32].
Education and MMSE score
In DYNOPTA, MMSE scores differed according to level of educational attainment. Pair-wise contrasts revealed that individuals with tertiary qualifications (mean = 28.86, SEM = 0.99, n = 321) scored higher than those with post-secondary qualifications (mean = 27.93, SEM = 0.83, n = 1137, p < 0.001), secondary schooling only (mean = 27.02, SEM = 0.86, n = 2172, p < 0.001) or no formal edu-cation (mean = 23.66, SEM = 1.19, n = 14, p < 0.001). In both the 97 NSMH and the 07 NSMH, those reporting finishing secondary school had higher MMSE scores than those reporting not finishing secondary school (i.e. 27.48 vs 26.83 (t ( 1786 ) = 3.212, p = .001 and 28.79 vs 28.10 (t(1903 ) = 6.770, p = .000), respectively).
Figure 1 Comparisons of age trajectories of probable dementia
from Australian Surveys and meta-analyses of European Studies.
0 5 10 15 20 25 30 35 40 45
65-69 70-74 75-79 80-84 85-89 90-94
P
reval
en
ce o
f p
ro
b
a
b
le o
r act
u
a
l d
e
m
e
n
ti
a
Anstey et al.BMC Neurology 2010, 10:62
http://www.biomedcentral.com/1471-2377/10/62
Page 10 of 12
Discussion
The present study reports prevalence rates of probable dementia and possible cognitive impairment from the two largest sources of population-based data available in Australia, and compares these with published estimates of dementia prevalence based on meta-analyses of dementia prevalence from European studies. Overall the prevalence of probable dementia derived from the DYNOPTA dataset were comparable to estimates derived from meta-analyses. The NSMH surveys showed less consistency with the meta-analyses. The differing pattern of results from these surveys and the limited availability of age data in them suggest that these are not suitable sources of information for making projections about dementia or cognitive impairment in Australia. A possi-ble explanation for the greater congruence of DYNOPTA with the meta-analyses is that DYNOPTA MMSE data were obtained from investigator-led epidemiological studies where dementia and cognitive decline were a key focus. This may have led to higher quality training of assessors, and hence more reliable data collection and coding.
The sensitivity and specificity of the MMSE cutoff used in the DYNOPTA data was highly acceptable. Evaluation of our data showed that the MMSE has a high false posi-tive rate, suggesting that the figures for DYNOPTA may overestimate the true level of probable dementia. A high false positive rate is a characteristic of all screening instruments used to detect low prevalence disorders, and is not a limitation of the MMSE per se [33]. It therefore appears that the DYNOPTA estimates are a reasonable guide to the levels of cognitive impairment in Australia but may slightly overestimate rates of actual dementia. The prevalence of dementia in Australia based on the
2008 population statistics [32] are likely to represent the upper end of probable dementia prevalence.
In the 97 NSMH men had higher rates of probable dementia than women in the 65-69 and 70-74 age-groups. In the DYNOPTA sample, there were no signifi-cant differences in rates of probable dementia between men and women. It is possible that this difference between the survey data and some of the meta-analyses that found higher rates of dementia in women is due to sampling biases in the studies that contributed to the meta-analyses. Population weights were applied to all the survey datasets to account for sampling bias, whereas this was not done for the studies contributing to meta-analy-ses, or in the meta-analyses themselves. Alternatively, the higher life expectancy of Australian men compared to that of males in a number of European countries [34] may influence the population level of cognitive impairment among men. Other possible explanations for the differ-ence in prevaldiffer-ence patterns by gender include differdiffer-ences in sampling frames between studies, different risk factor profiles between countries, and possibly the higher of education among women in Australia due to the more recent data collection. Given the importance of establish-ing gender differences in prevalence for developestablish-ing pro-jections of need for dementia care, there is a need to further investigate gender differences in studies with clin-ical diagnoses.
All data sources have limitations. Prevalence studies used in meta-analyses may have sample bias, with partici-pants who complete clinical assessments having higher socio-economic status and education than the general population. They often under-represent minority groups, individuals with low literacy, and those living in rural or remote locations. Similarly, DYNOPTA and NSMH
sur-Table 4: Prevalence rates of probable dementia from Australian Surveys and prevalence rates of dementia from meta-analyses of European Studies
MMSE Clinical Diagnoses
Age Groups DYNOPTA
[1]
NSMH97
[21]
NSMH07
[22]
Jorm [2] Lobo
[7]Female
Lobo
[7]Male
Ritchie [5] Hofman
[6]Female
Hofman
[6]Male
60-64 - 0.7 - - - -
-65-69 3.78 6.22 4 1.4 1 1.6 1.5 -
-70-74 5.16 9.09 5.02 2.8 3.1 2.9 3.5 3.9 4.6
75-79 10.63 - 7.53 5.6 6 5.6 6.8 6.7 5
80-84 16.32 - 5.26 10.5 12.6 11 13.6 13.5 12.1
85-89 22.36 - - 20.8 20.2 12.8 22.3 22.8 18.5
90-94 32.43 - - 38.6 30.8 22.1 31.5 32.2 32.1
90+ 41.41 - - -
Anstey et al.BMC Neurology 2010, 10:62
http://www.biomedcentral.com/1471-2377/10/62
Page 11 of 12
veys under-represented minority groups including indig-enous Australians, those from culturally and linguistically diverse groups and rural and remote locations. None of the data reports on dementia prevalence have systemati-cally evaluated possible cohort effects. With the increase in IQ scores observed over the past several decades (known as the Flynn Effect) [35] and the general increase in health amongst cohorts moving into old age, it is possi-ble that a reduction in dementia prevalence at older ages will be observed due to greater cognitive reserve [36].
The MMSE has several limitations as a means of cate-gorizing individuals with dementia and these are well described in the literature [24,37,38]. Scores on the MMSE are related to level of education, although educa-tion only accounts for a small proporeduca-tion of variance in scores [39]. The MMSE appears to have unacceptably high misclassification rates among adults who are illiter-ate [40] but has been shown to be reliable for use in the oldest old [41]. A strength of our study is the reporting of standard errors and the use of population weights, whereas confidence intervals of estimates from meta-analyses were not reported. Hence, the degree of error associated with the estimates from meta-analyses is unknown.
Conclusions
The data reported here confirm recent projections of the numbers of persons with dementia in Australia [1] and indeed suggest they may even be conservative. An over-view of all the results from available sources suggests that the rate of dementia roughly doubles every 5 years between the ages of 70 and 84, but that the rate of increase slows thereafter. We conclude that MMSE data from population-based studies for which dementia or cognitive decline is a focus, provide a valuable adjunct to information on dementia prevalence derived from meta-analyses.
Competing interests
The authors declare that they have no competing interests.
Authors' contributions
KJA developed the idea for the manuscript, drafted the manuscript, and preted the statistical analyses. RAB conducted some statistical analyses, inter-preted the results and contributed to drafting the manuscript. CLB developed the sample weights, conducted some of the statistical analyses, and contrib-uted to drafting the manuscript. DS developed the sample weights, conducted some of the statistical analyses, and contributed to drafting the manuscript. KMK conducted some statistical analyses, interpreted the results and contrib-uted to drafting the manuscript. MAL contribcontrib-uted to interpretation of results and drafting of the manuscript. All authors read and approved the final manu-script.
Acknowledgements
This work was supported by the National Health and Medical Research Council of Australia grant (# 410215). Professor Anstey is funded by NHMRC Fellowship #366756. We thank Allison Bielak for her assistance. The data on which this research is based were drawn from several Australian longitudinal studies including: the Australian Longitudinal Study of Ageing (ALSA), the Canberra
Longitudinal Study of Ageing (CLS), the Personality And Total Health Through Life Study (PATH), and the Sydney Older Persons Study (SOPS). These studies were pooled and harmonized for the Dynamic Analyses to Optimize Ageing (DYNOPTA) project. All studies would like to thank the participants for volun-teering their time to be involved in the respective studies. Details of all studies contributing data to DYNOPTA, including individual study leaders and funding sources, are available on the DYNOPTA website http://dynopta.anu.edu.au.
Author Details
1Centre for Mental Health Research, Australian National University, Canberra,
ACT, Australia, 2Centre for Statistical & Survey Methodology (CSSM), University
of Wollongong, Wollongong, NSW, Australia and 3School of Psychology and
Centre for Ageing Studies, Flinders University, Adelaide, SA, Australia
References
1. Access Economics: Dementia Estimates and Projections: Australian States
and Territories: Report for Alzheimer's Australia 2005.
2. Jorm AF, Dear KB, Burgess NM: Projections of future numbers of
dementia cases in Australia with and without prevention. Aust N Z J Psychiatry 2005, 39:959-63.
3. Access Economics: The dementia epidemic: Economic impact and positive
solutions for Australia. Report for Alzheimer's Australia 2003.
4. Wancata J, Musalek M, Alexandrowicz R, Krautgartner M: Number of
dementia sufferers in Europe between the years 2000 and 2050. Eur Psychiatry 2003, 18:306-13.
5. Ritchie K, Kildea D: Is senile dementia "age-related" or
"ageing-related"?--evidence from meta-analysis of dementia prevalence in the oldest old. Lancet 1995, 364:931-4.
6. Hofman A, Rocca WA, Brayne C, Breteler MMB, Clarke M, Cooper B,
Copeland JRM, Dartigues JF, Da Silva DA, Hagnell O, et al.: Prevalence of
Dementia in Europe: A Collaborative Study of 1980-1990 Findings. Int J Epidemiol 1991, 20:736-748.
7. Lobo A, Launer LJ, Fratiglioni L, Andersen K, Di Carlo A, Breteler MM,
Copeland JR, Dartigues JF, Jagger C, Martinez-Lage J, et al.: Prevalence of
dementia and major subtypes in Europe: A collaborative study of population-based cohorts. Neurologic Diseases in the Elderly Research Group. Neurology 2000, 54:S4-9.
8. Jorm AF, Korten AE, Henderson AS: The prevalence of dementia: a
quantitative integration of the literature. Acta Psychiatr Scand 1987,
76:465-79.
9. Stroup DF, Berlin JA, Morton SC, Olkin I, Williamson GD, Rennie D, Moher
D, Becker BJ, Sipe TA, Thacker SB, et al.: Meta-analysis of Observational
Studies in Epidemiology: A Proposal for Reporting. JAMA 2000,
283:2008-12.
10. Brand RA, Editorial: Standards of Reporting: The CONSORT, QUORUM,
and STROBE Guidelines. Clin Orthop Relat Res 2009, 467:1393-4.
11. AIHW: Dementia in Australia: National data analysis and development
Canberra: Australian Institute of Health and Welfare; 2007.
12. Folstein MF, Robins LN, Helzer JE: The Mini-Mental State Examination.
Arch Gen Psychiatry 1983, 40:812.
13. Han L, Cole M, Bellavance F, McCusker J, Primeau F: Tracking cognitive
decline in Alzheimer's disease using the mini-mental state examination: A meta-analysis. Int Psychogeriatr 2000, 12:231-47.
14. Boustani M, Peterson B, Hanson L, Harris R, Lohr KN: Screening for
dementia in primary care: A summary of the evidence for the U.S. Preventive Services Task Force. Ann Intern Med 2003, 138:927-37.
15. Cherbuin N, Anstey KJ, Lipnicki DM: Screening for dementia: a review of
self- and informant-assessment instruments. Int Psychogeriatr 2008,
20:431-58.
16. Anstey KJ, Byles JE, Luszcz MA, Mitchell P, Steel D, Booth H, Browning C,
Butterworth P, Cumming RG, Healy J, et al.: Cohort profile: The Dynamic
Analyses to Optimize Ageing (DYNOPTA) project. Int J Epidemiol 2009. 17. Piguet O, Grayson DA, Creasey H, Bennett HP, Brooks WS, Waite LM, Broe
GA: Vascular risk factors, cognition and dementia incidence over 6 years in the Sydney older persons study. Neuroepidemiology 2003,
22:165.
18. Logie H, Hogan R, Peut A: Longitudinal studies of ageing Implications for
future studies Canberra: Australian Institute of Health and Welfare; 2004.
Received: 18 November 2009 Accepted: 21 July 2010 Published: 21 July 2010
This article is available from: http://www.biomedcentral.com/1471-2377/10/62 © 2010 Anstey et al; licensee BioMed Central Ltd.
This is an Open Access article distributed under the terms of the Creative Commons Attribution License (http://creativecommons.org/licenses/by/2.0), which permits unrestricted use, distribution, and reproduction in any medium, provided the original work is properly cited.
Anstey et al.BMC Neurology 2010, 10:62
http://www.biomedcentral.com/1471-2377/10/62
Page 12 of 12
19. Jorm AF, Christensen H, Doyle CJ, Henderson AS, Korten AE, Mackinnon AJ: The Canberra Interview for the Elderly: A standardized diagnostic interview for dementia and depression by DSM-III-R and ICD-10. In
Ageing, Health and HealingVolume 16. Edited by: Bergener M, Brocklehurst JC, Finkel SI. New York: Springer Publishing; 1995:187-96.
20. Anstey KJ, Lipnicki DM, Low LF: Cholesterol as a risk factor for dementia
and cognitive decline: a systematic review of prospective studies with meta-analysis. Am J Geriatr Psychiatry 2008, 16:343-54.
21. McLennan W: National Survey of Mental Health and Wellbeing of Adults:
Users' Guide Canberra: Australian Bureau of Statistics; 1999.
22. Pink B: National Survey of Mental Health and Wellbeing: Users Guide
Canberra: Australian Bureau of Statistics; 2007.
23. Ewing I: National Survey of Mental Health and Wellbeing: Summary of Results
Canberra: Australian Bureau of Statistics; 2007.
24. Mitchell AJ: A meta-analysis of the accuracy of the mini-mental state
examination in the detection of dementia and mild cognitive impairment. J Psychiatr Res 2009, 43:411-31.
25. Cullen B, Fahy S, Cunningham CJ, Coen RF, Bruce I, Greene E, Coakley D,
Walsh JB, Lawlor BA: Screening for dementia in an Irish community
sample using MMSE: a comparison of norm-adjusted versus fixed cut-points. Int J Geriatr Psychiatry 2005, 20:371-6.
26. Lezak MD, Howieson DB, Loring DL: Neuropsychological Assessment 4th
edition. New York: Oxford University Press; 2004.
27. Folstein MF, Folstein SE, McHugh PR: Mini-mental state a practical
method for grading the cognitive state of patients for the clinician. J Psychiatr Res 1975, 12:189-98.
28. American Psychiatric Association: Diagnostic and statistical manual of
mental disorders. 3rd. Revised. ed Washington D.C.: American Psychiatric Association; 1987.
29. World Health Organization: International Classification of Disease 10 1994.
30. American Psychiatric Association: Diagnostic and Statistical Manual of
Mental Disorders (DSM-IV) Washington: APA; 1994.
31. McKhann G, Drachman D, Folstein M, Katzman R, Price D, Stadlan EM:
Clinical diagnosis of Alzheimer's disease: Report of the NINCDS-ADRDA Work Group under the auspices of Department of Health and Human Services Task Force on Alzheimer's Disease. Neurology 1984, 34:939-44.
32. ABS: Population Estimates by Age and Sex by Geographical Classification
[ASGC 2008] Canberra, Australian Bureau of Statistics; 2009.
33. Streiner DL: Diagnosing tests: using and misusing diagnostic and
screening tests. J Pers Assess 2003, 81:209-19.
34. World Health Organization: World Health Statistics 2009 Report 2009.
35. Hiscock M: The Flynn effect and its relevance to neuropsychology. J
Clin Exp Neuropsychol 2007, 29:514-29.
36. Christensen H, Anstey KJ, Parslow RA, Maller J, Mackinnon A, Sachdev P:
The brain reserve hypothesis, brain atrophy and aging. Gerontology
2006, 53:82-95.
37. Eefsting JA, Boersma F, van Tilburg W, van den Brink W: Usefulness of the
'Mini-Mental State Test' for the diagnosis of dementia; study of criterion validity in a Dutch rural population. Ned Tijdschr Geneeskd
1997, 141:2066-70.
38. Wind AW, Schellevis FG, van Staveren G, Scholten RJPM, Jonker C, van Eijk J: Limitations of the Mini-Mental State Examination in diagnosing dementia in general practice. Int J Geriatr Psychiatry 1997, 12:101-8.
39. Jones RN, Gallo JJ: Education bias in the mini-mental state examination.
Int Psychogeriatr 2001, 13:299-310.
40. Scazufca M, Almeida OP, Vallada HP, Tasse WA, Menezes PR: Limitations of
the Mini-Mental State Examination for screening dementia in a community with low socioeconomic status: results from the Sao Paulo Ageing & Health Study. Eur Arch Psychiatry Clin Neurosci 2009, 259:8-15.
41. Kahle-Wrobleski K, Corrada MM, Li B, Kawas CH: Sensitivity and specificity
of the mini-mental state examination for identifying dementia in the oldest-old: the 90+ study. J Am Geriatr Soc 2007, 55:284-9.
Pre-publication history
The pre-publication history for this paper can be accessed here: http://www.biomedcentral.com/1471-2377/10/62/prepub
doi: 10.1186/1471-2377-10-62