Open Access
Research
Artificial arterial blood pressure artifact models and an evaluation
of a robust blood pressure and heart rate estimator
Qiao Li
1,2, Roger G Mark
2and Gari D Clifford*
2,3Address: 1Institute of Biomedical Engineering, School of Medicine, Shandong University, 44 Wenhua Xi Road, Jinan, Shandong, 250012, PR China, 2Massachusetts Institute of Technology, 77 Massachusetts Avenue, Cambridge, MA, 02139, USA and 3Harvard Medical School, 25 Shattuck Street, Boston, MA 02115, USA
Email: Qiao Li - liqiao@sdu.edu.cn; Roger G Mark - rgmark@mit.edu; Gari D Clifford* - gari@mit.edu * Corresponding author
Abstract
Background: Within the intensive care unit (ICU), arterial blood pressure (ABP) is typically recorded at different (and sometimes uneven) sampling frequencies, and from different sensors, and is often corrupted by different artifacts and noise which are often non-Gaussian, nonlinear and nonstationary. Extracting robust parameters from such signals, and providing confidences in the estimates is therefore difficult and requires an adaptive filtering approach which accounts for artifact types.
Methods: Using a large ICU database, and over 6000 hours of simultaneously acquired electrocardiogram (ECG) and ABP waveforms sampled at 125 Hz from a 437 patient subset, we documented six general types of ABP artifact. We describe a new ABP signal quality index (SQI), based upon the combination of two previously reported signal quality measures weighted together. One index measures morphological normality, and the other degradation due to noise. After extracting a 6084-hour subset of clean data using our SQI, we evaluated a new robust tracking algorithm for estimating blood pressure and heart rate (HR) based upon a Kalman Filter (KF) with an update sequence modified by the KF innovation sequence and the value of the SQI. In order to do this, we have created six novel models of different categories of artifacts that we have identified in our ABP waveform data. These artifact models were then injected into clean ABP waveforms in a controlled manner. Clinical blood pressure (systolic, mean and diastolic) estimates were then made from the ABP waveforms for both clean and corrupted data. The mean absolute error for systolic, mean and diastolic blood pressure was then calculated for different levels of artifact pollution to provide estimates of expected errors given a single value of the SQI.
Results: Our artifact models demonstrate that artifact types have differing effects on systolic, diastolic and mean ABP estimates. We show that, for most artifact types, diastolic ABP estimates are less noise-sensitive than mean ABP estimates, which in turn are more robust than systolic ABP estimates. We also show that our SQI can provide error bounds for both HR and ABP estimates.
Conclusion: The KF/SQI-fusion method described in this article was shown to provide an accurate estimate of blood pressure and HR derived from the ABP waveform even in the presence of high levels of persistent noise and artifact, and during extreme bradycardia and tachycardia. Differences in error between artifact types, measurement sensors and the quality of the source signal can be factored into physiological estimation using an unbiased adaptive filter, signal innovation and signal quality measures.
Published: 8 July 2009
BioMedical Engineering OnLine 2009, 8:13 doi:10.1186/1475-925X-8-13
Received: 9 April 2009 Accepted: 8 July 2009
This article is available from: http://www.biomedical-engineering-online.com/content/8/1/13
© 2009 Li et al; licensee BioMed Central Ltd.
Background
Arterial blood pressure (ABP) is a basic hemodynamic parameter in intensive care unit (ICU) monitoring. ABP waveforms are frequently corrupted by artifacts, such as transducer flushing, catheter clotting, movement artifacts, and non-invasive cuff inflations [1]. These errors cause monitors to generate a high rate of false alarms. In fact, ICU false alarm rates can be as high as 86% [2,3]. Various strategies, such as median filtering [4], multi-parametric analysis [5-7], machine learning [8-11] and signal quality assessment techniques [12], are used to reduce false alarms.
Multiple average observations of blood pressure increase the accuracy of ABP estimates [13]. Therefore, a tracking procedure based upon some memory of previous values, that is not thrown off by individual errors should provide a more accurate method of estimating ABP. Furthermore, a system that can integrate an estimate of the quality of each individual observation into each ABP estimate can improve the overall ABP estimate further [12].
In this study we present extensions of our data fusion framework [14,15] which uses a robust Kalman filter (KF) and signal quality indices (SQI), for robust tracking of systolic blood pressure (SBP), mean blood pressure (MBP) and diastolic blood pressures (DBP) derived from ABP waveforms. After preliminary beat detection based on a localised slope in the low-pass filtered ABP signal [16], the signal quality of the ABP waveform is calculated by a combination of two previously developed SQI metrics, one using heuristic amplitude and gradient thresholds [17], and one using fuzzy representation and fuzzy rea-soning [12]. Blood pressures are then estimated using a KF, adjusted to include the signal quality estimates.
Methods
Data sourcesFor the evaluation of our algorithm, we chose more than 6000 hours of high quality data (as judged by a stringent signal quality metric described in [12,17] and later in this article) comprising simultaneous ECG and ABP signals, from the Multi-Parameter Intelligent Monitoring for Intensive Care II (MIMIC II) database [18]. The MIMIC II database contains approximately 300,000 hours of bed-side monitor waveform data from over 4,000 patients. Since no database of real ABP noise exists, we invented a series of ABP artifact simulation algorithms, and added these realistic artificial artifacts to clean ABP signals to cre-ate the evaluation data set.
Artificial ABP artifact generation algorithms
After extensive searches through the MIMIC II database, we identified six generic phenomenological artifact types similar to those described in [1]. These are: 1) rapid
satu-ration (over a period of 5 to 20 seconds) to some maximal ABP, 2) rapid saturation to some ABP minimum, 3) rapid saturation to the current mean ABP, 4) high amplitude square wave artifact, 5) high frequency noise and 6) highly transient impulse-like artifact. These artifacts are now described in more detail, with visual examples, and algorithms for generating realistic and variable artificial representations of them [Matlab source code for generat-ing these artifacts, see Additional File 1]. Although the exact etiology of these artifact types is unknown, discus-sions with clinical staff who are familiar with these abnor-mal ABP waveform morphologies reveals that each artifact type is likely to be caused by damping (from a blocked arterial line), flushing of the arterial line (to reduce the damping), pinching of the arterial line, body movements or clinical activity or interventions. The resultant artifacts are discussed below in more detail with the mathematical definition of each artifact type.
1. Saturation to ABP maximum artifact (asmax)
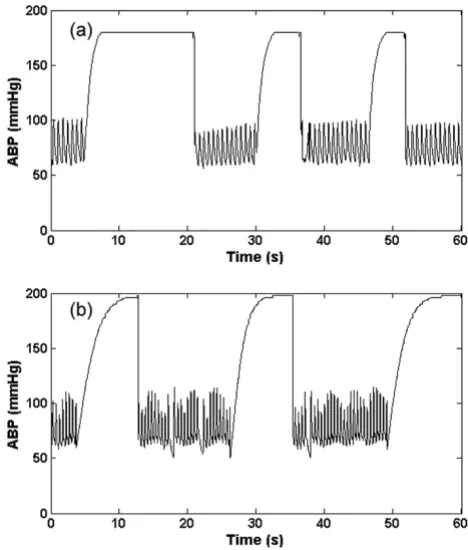
This type of artifact (as seen in Figure 1a) manifests as a rapid saturation from a normal ABP to a maximum value (ABPmax), which is set to be equal to 200 mmHg ± 10 mmHg, with an exponential-like curve. We therefore use
Artifact 1, (asmax); Real (a) and simulated (b) ABP saturation to maximum pressure, defined by Eq. (1)
Figure 1
the hyperbolic tangent function (tanh) to simulate this behaviour as follows:
where η(0 <η ≤ 1) is the rate of saturation, Adias is the diastolic ABP and fs is the sampling frequency of the ABP. A large value of ηtherefore leads to a rapid saturation to ABPmax. Examples of the real and artificial asmax artifact are shown in Figures 1a and 1b respectively. This type of arti-fact is likely due to the flushing of the arterial line, to reduce damping caused by a blood clot or thrombosis of the arterial line, for example.
2. Saturation to ABP minimum artifact (asmin)
This type of artifact (Figure 2) appears to be composed of four consecutive parts: 1) a rapid exponential diastolic sat-uration, 2) a rapid saturation from a normal ABP to a min-imum value (ABPmin) with an exponential-like decay, 3) an exponential increase from ABPmin to some ABP value, and 4) a gradual transition back to the unaffected blood
pressure. An artifact boundary is created with these four parts and then applied to the ABP. The upper boundary of the first part of the artifact is the maximum of ABP in the window, and the lower part is a right upside of a square function with the independent variable altered from 0 to 2.5. The upper boundary of the second part (asmin_2) is defined as:
And the lower part is obtained by decreasing asmin_2 to 90%. The upper boundary of the third and fourth part (asmin_3) is defined as:
where N is the length of the third and fourth parts. The lower third part is created by decreasing asmin_3 by 20% – 40% of its original value and the lower fourth part is the left downside of a square function. An example of the real and artificial asmin artifact is shown in Figures 2a and 2b respectively. This type of artifact may be due to a transient constriction in the arterial line such as pinching from arm movement.
3. Reduced pulse pressure artifact (app)
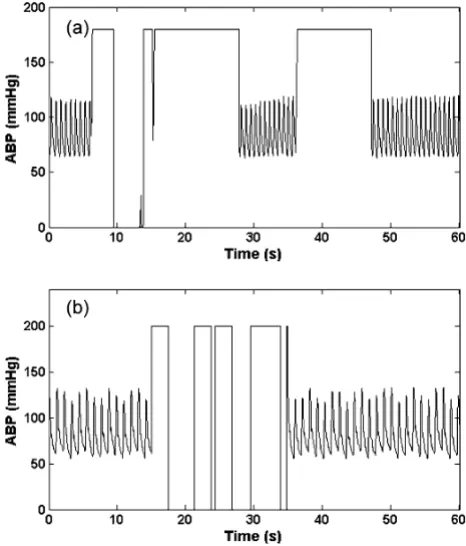
This type of artifact is similar to the systolic and diastolic ABP saturation artifact, gradually decreasing the pulse pressure. We simulated this artifact by decrementing the systolic ABP in a linear manner over a variable window length. A lowpass FIR filter with a passband cutoff of 5 Hz and a stopband cutoff of 10 Hz and a Kaiser window was also applied. An example of the real and artificial app arti-fact is shown in Figures 3a and 3b respectively. This type of artifact can be due to damping caused by thrombus in the arterial line.
4. Square wave artifact (asw)
This type of artifact consists of a series of square waves with varying random duty cycles. Examples of the real and artificial asw are shown in figure 4a and 4b. The length of the square wave is determined by generating a uniform random number distributed between 5 seconds and 20 seconds. This artifact simulates a fast flush test of the sen-sor [1]. A fast flush test helps determine the natural fre-quency and damping coefficient of the entire catheter monitoring system to ensure accuracy and consistency of the ABP measurement. Although a flush test is usually fol-lowed by a rapid oscillation that quickly dies away, this effect was not explicitly modeled here since it is brief and relatively low amplitude compared to the square wave. However, the addition of artifact type 6 (impulse artifact)
a n n
f s ABP Adias Adias
smax( , )η tanh( ) ( max )
π η
= ⋅ ⋅ ⋅ − +
(1)
a n n
f s smin_2( , )η [ tanh( )]
π η
= −1 ⋅ ⋅ (2)
a n n N
f s smin_3( , ) tanh(
( / )
)
η = π⋅ − 2 ⋅η (3)
Artifact 2, (asmin); Real (a) and Simulated (b) ABP saturation to lowest pressure in window defined by Eq.s (2) and (3)
Figure 2
to the end of each square pulse would allow modeling of this smaller effect.
5. High frequency artifact (ahf)
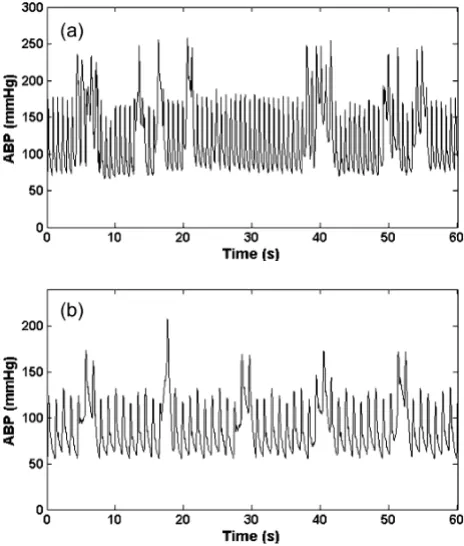
This type of artifact is simulated by a brown noise genera-tor (produced by Brownian motion), implemented through a 1/f2 bandpass filter. The brown noise was fur-ther filtered using a Kaiser window FIR bandpass filter with a passband between 1.5 Hz to 18 Hz. The resultant signal was then added to the real ABP signals. Examples of the real and artificial ahf are shown in figures 5a and 5b respectively. High frequency noise can also be simulated by differentiating the signal. This band-pass filtering phe-nomenon may be related to movement artifact or distur-bance of the transducer (such as dragging a cloth over the arterial line).
6. Impulse artifact (aimp)
This type of artifact is simulated by the sinc function as shown in Eq. (4). The central lobe of the sinc function was used as aimp artifact and was added to the real ABP signals. The impulse artifact is given by
where η(0.05 <η< 0.35) is the approximate percentage of pulse that central lobe occupies, n defines the frequency at which the sinc function oscillates, and NQ denotes selecting the central lobe of the sinc function. An example of the real and artificial aimp is shown in figures 6a and 6b respec-tively. This type of artifact could be due to motion, or a sharp mechanical artifact such as crimping of the tubing. It should be noted that these artifacts can also be applied to other biomedical signals such as the photoplethysmo-gram although the exact frequency response of each arti-fact and would require modification.
Signal quality assessment
Two previously developed ABP signal quality assessment methods, wSQI [12] and jSQI [17] were combined to derive the signal quality index of ABP. The wSQI algo-rithm was designed to reduce the incidence of false ABP alarms by rejecting low-quality ABP segments. The algo-rithm consists of an open source ABP pulse onset detec-tion routine, wabp [16], a waveform feature extraction
a n n
fs n fs
imp( , )η sin( ) ( / )
π
η π
= ⋅
⋅ ⋅
⎢ ⎣
⎢ ⎥
⎦
⎥ (4)
Artifact 3, (app); Real (a) and Simulated (b) ABP reduced pulse pressure in window using a 5–10 Hz FIR filter plus Kai-ser window
Figure 3
Artifact 3, (app); Real (a) and Simulated (b) ABP reduced pulse pressure in window using a 5–10 Hz FIR filter plus Kaiser window.
Artifact 4, (asw); Real (a) and Simulated (b) ABP square wave artifact
Figure 4
routine, a waveform feature fuzzy representation, and a fuzzy reasoning procedure to produce the signal quality index. ABP waveform feature extraction was performed on a beat-by-beat basis. The waveform features used in this algorithm were systolic blood pressure (SBP), diastolic blood pressure (DBP), and mean blood pressure (MBP), maximum positive pressure slope, maximum negative pressure slope, maximum up-slope duration (the maxi-mum duration over which the ABP signal can rise contin-uously), maximum duration above threshold (the maximum duration that the ABP signal stays above a pre-defined threshold), pulse-to-pulse interval (T), pulse pres-sure (the difference between the SBP and the DBP in a beat) and ECG-ABP delay time (the interval between the QRS onset in the ECG and the onset of the consequent ABP pulse).
The wSQI algorithm was previously trained on data from
the MIMIC DB [19]. It was shown to give an accurate assessment of ABP signal quality in previous studies [12] with a sensitivity of 99.8% and a positive predictivity (positive predictive value) of 99.3% for detecting true blood pressure alarms and a sensitivity of 98.2% and a positive predictivity of 99.4% for detecting false alarms. A
wSQI value is associated with each beat and possesses a
continuous value between 0 and 1 (bad to good). Values
for wSQI greater than 0.5 generally correspond to good
signal quality (sufficient for heart rate analysis) [12].
The jSQI algorithm is a binary abnormality index (with 0 indicating a normal beat type) and uses the same beat detection algorithm as wSQI, after which features in each ABP pulse are identified (see table 1). Plausible heuristic constraints are set on the ABP amplitudes, slopes, and beat-to-beat variations in order to generate a signal abnor-mality index. The last column in table 1 lists these con-straints. Note that for each beat, Pd and Ps are the local minimum and maximum around the pressure onset point. Pm is the average pressure between adjacent onsets. T is the time difference between adjacent onsets. The first 5 criteria in Table 1 impose bounds on the physiologic ranges of each feature. For example, any beat with a diastolic pressure of less than 20 mmHg is flagged as abnormal.
The sixth criterion in table 1 is the noise level, w, and is defined as the average of all negative slopes in each beat. Artifact 5, (ahf); Real (a) and Simulated (b) ABP high
fre-quency artifact generated with band-limited (1.5 Hz to 18 Hz) 1/f2 noise
Figure 5
Artifact 5, (ahf); Real (a) and Simulated (b) ABP high frequency artifact generated with band-limited (1.5 Hz to 18 Hz) 1/f2 noise.
Artifact 6, (aimp); Real (a) and Simulated (b) ABP impulse arte-fact using an adjustable sinc function (Eq. (4))
Figure 6
With high frequency noise, there will be slopes with high negative gradients in the waveform. The final 3 criteria in table 1 compare ABP features between adjacent beats. Large sudden changes in beat-to-beat features are likely indications of abnormality. Each criterion is assigned a Boolean value for each beat, 0 for a normal range and 1 for an abnormal range (physiologically abnormal or noise/artifact). jSQI takes a binary value which is the log-ical AND of each 9 criteria. Compared to human annota-tion of signal quality, this algorithm has been shown to have a sensitivity of 1.00, and a positive predictivity of 0.91 [17].
The ABP signal quality index, ψ, is calculated by combin-ing wSQI and jSQI as follows:
where 1 ≥η≥ 0 is the positive coefficient chosen to be η= 0.7 and jSQI = 1 indicates an abnormal beat. That is, if jSQI indicates a good quality signal, wSQI can be believed. Otherwise, wSQI is trusted less, by a multiplicative coeffi-cient, η, which effectively defines an arbitrary cut-off that defines the boundary between moderate and high quality data [14].
Kalman filtering for tracking the ABP 1. Kalman filtering algorithm
The KF is an optimal state estimation method for a sto-chastic signal [20,21] that estimates the state of a discrete-time controlled process, x, with measurement data z,
where x and z are governed by the linear stochastic differ-ence equations:
The random variables w and v are independent, white, and possess normal probability distributions, p(w) ~ N(0, Q) and p(v) ~ N(0, R). The matrices A, B, H are the coeffi-cient state transition matrices, Q being the state noise cov-ariance, R the measurement noise covariance and u an optional control input to the state x.
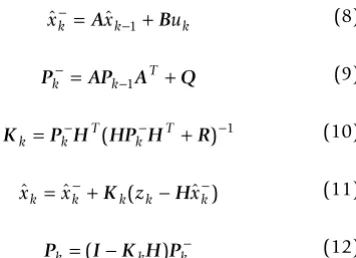
The KF algorithm is given by the following equations:
where and are a priori and a posteriori state
esti-mates before and after a given measurement zk; and Pk are the error covariances of a priori and a posteriori
esti-ψ
η
( )
*
k wSQI if jSQI
wSQI if jSQI
= =
= ⎧
⎨ ⎩
0
1 (5)
xk =Axk−1+Buk +wk−1 (6)
zk =Hxk+vk (7)
ˆ ˆ
xk−=Axk−1+Buk (8)
Pk− =APk−1AT +Q (9)
Kk =P Hk− T(HP Hk− T+R)−1 (10)
ˆ ˆ ( ˆ )
xk =xk−+Kk zk−Hxk− (11)
Pk =(I−K H Pk ) k− (12)
ˆ
xk− xˆk
Pk− Table 1: Features used in signal abnormality index jSQI. k is the beat index.
Feature Description Abnormality CRITERIA
Ps Systolic blood pressure (SBP) Ps > 300 mmHg
Pd Diastolic blood pressure (DBP) Pd < 20 mmHg
Pm Mean arterial pressure (MAP) Pm < 30 or Pm > 200 mmHg
f Instantaneous heart rate (60/T) f < 20 or f > 200 BPM
Pp Pulse pressure (Ps - Pd) Pp < 20 mmHg
w Noise term: mean of negative slopes w < -40/100 mmHg/ms
Ps[k] - Ps[k - 1] Absolute change in instantaneous SBP |ΔPs| > 20 mmHg
Pd[k] - Pd[k - 1] Absolute change in instantaneous DBP |ΔPd| > 20 mmHg
T[k] - T[k - 1] Absolute change in instantaneous HR |ΔT| > 2/3 s
mates, is the measurement innovation (or
residual); and Kk is the gain required to minimise the a posteriori error covariance, Pk.
We employed the KF to estimate the systolic, mean and diastolic blood pressure derived from the ABP at each pulse. However, in order to more heavily weight estimates derived from cleaner data, we propose the use of the SQI,
ψ, to adjust the measurement noise covariance, R, when Kk is updated. When the SQI is low, zk should be trusted less, so Kk should be small, and hence we force R to be large. This is achieved by modifying R as follows:
where R0 is chosen to be equal to unity and is the unal-tered value of R. In other words, we do not assume the noise is stationary and instead the state noise covariance is adaptive based upon our signal quality measures.
It can be seen from Eq. (13) that this nonlinear transfor-mation of R tends to unity as the SQI, ψ, tends to unity, and therefore doesn't affect the measurement noise covar-iance. When the SQI is high (near unity), the KF is forced to trust the current measurement, zk, and elevates the Kalman gain, Kk. At low values of ψ, R tends to infinity (but in practice is limited to a large value) and forces the KF to reduce Kk and hence trust the previous measure-ments more than the current measurement. Furthermore, an upper limit that defines the cusp between good and bad data, ψt, is defined. When ψ <ψt, the KF is not updated. The determination of the value of ψt is per-formed in the same manner as for the ECG signal quality metrics described in [14]. This involves plotting the error with no SQI-control on the KF for each artifact type, and picking the value of the SQI that corresponds to an accept-able level of error for a particular application. In general, a value of ψt = 0.5 provides an acceptable level of error (on average less than 20 mmHg). It should be noted that some types of artifact cause different levels of error and affect the SBP, MBP and DBP in different manners; see discus-sion.
2. KF initialization and operation
Following Tarassenko and Townsend [22,23], we pick the simplest form of the KF, and set the state to be a scalar. (Scalar notation is therefore used from this point onwards.) Therefore we implemented three separate KFs, one for each of the SBP, MBP and DBP. We further assume that the blood pressure at each moment is approximately equal to the blood pressure at the next moment (A≈1). After neglecting the control input, Eq. (8) then reduces to
. In order to initialise the KF, one must estimate Q, the state noise covariance matrix, and R, the
measure-ment noise covariance, to calculate and Kk. R was
sim-ilarly initialised to unity, noting that it is immediately modified by the SQI to reflect our trust in the data. Q was empirically adjusted to have an initial value of Q = 0.1. Values of Q < 0.1 lead to the KF trusting the state estimate too much and not adapting to the new initial observa-tions. Values of Q > 0.1 lead to the KF trusting the new observations too much, and simply following the new val-ues too closely. Setting H to unity then allows us to esti-mate the Kalman gain, Kk, from Eq. (10) and hence the a posteriori error covariance estimate, Pk, from Eq. (12). The filter can then be run online with only a few iterations (heart beats) for convergence. The Kalman residual is then
given as at each update (each detected beat).
Methodology overview
The beat-onset detection method wabp [16] was applied to ABP waveform and ABP waveform features (SBP, MBP and DBP) were derived using the wSQI algorithm. The SQI for each beat was derived using a 10s window, cen-tered on each beat. Second-by-second ABP features and SQI were acquired by calculating the median values of these beats within a moving 10s window, centered on each second. Then, the ABP values (SBP, MBP and DBP) together with the SQI, ψ, were inputted to the KF to obtain the optimal ABP estimation on a second-by-second basis. The final ABP values and SQI of each 10 second epoch were derived by calculating the median of the window's second-by-second output of the KF estimate of the ABP and SQI.
Merging of multiple KF estimates; Dealing with missing and irregularly sampled data
In general it is possible to fuse any number of independ-ent Kalman filtered observations, X, using the technique of Townsend and Tarassenko [22,23] such that
where Xk is the kth independent estimate and σ k is the innovation (equal to the residual, rk). In a recent paper [14] we proposed a modification to this approach where the SQI-scaled innovations are given by rk =zk−Hxˆk−
R=R0exp(ψ−2−1) (13)
ˆ ˆ
xk− =xk−1
Pk−
rk =zk−xˆk−
X
i
i i k
n
j
j j i
n
i
n Xk k n
. In this way, when one channel (e.g. channel k = 1) is corrupted by artifact and the correspond-ing parameter estimate (X1) is miscalculated, the SQI (SQI1) will be low and the sudden change of X1, will make the residual error (r1) large. The weighted innovation
( ) will therefore be large and the weighting for X1,
(which would be for two channels), will
be small. The estimation of X will then rely more on X2 than X1.
In theory, each of the Xk estimates can be recorded at dif-ferent (or irregular/uneven) sampling frequencies. Adjust-ments to the innovation update sequence can be made to adjust for the differing sampling frequencies, and the inherent confidences in the different recording equip-ment. In general, the innovation-based weighting func-tion can be modified so that
where 1 ≥λk ≥ 0 is a 'trust' factor for the kth channel of data. An example of the use of this parameter in blood pressure monitoring would be to fuse data from inflatable cuff measurements with direct arterial blood pressure. In this case, λk for the ABP could be set to 1.0, and the sphyg-momanometer-based cuff pressure can be set to be 0.8 (or
some other relevant fractional value). In fact, the actual value of λk can be calibrated for different BP measurement devices, which have been shown to produce significantly different errors [24-27]. For high pressure values, SBP is generally under-estimated by non-invasive cuff measure-ments (with respect to arterial measuremeasure-ments) [27] on average by 10 to 30 mmHg and DBP over-estimated on average by up to 10 mmHg [24]. At low blood pressures the opposite effect is seen [27]. It is also well-known that variation in protocol (such as arm position) can affect the accuracy of measurements [28]. Such knowledge can be incorporated into the confidence in the measure by
adjusting λk.
Robust heart rate estimation
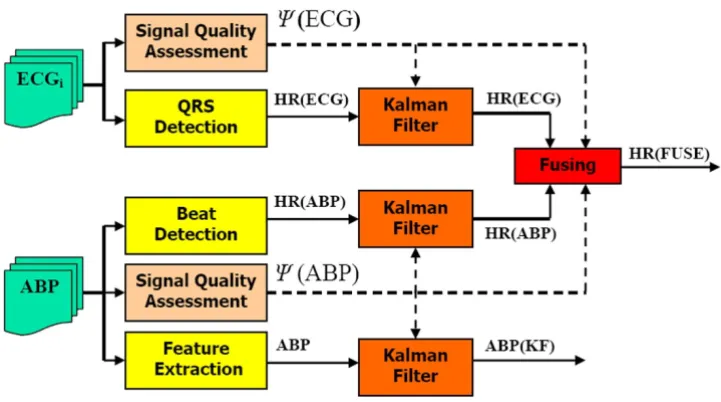
Of course, a continuous blood pressure waveform also carries more information than just blood pressure. Together with ABP, heart rate estimation is extremely important as a first-order estimate of cardiovascular sys-tem performance. In a recent paper [14], we demonstrated how the combinatory approach detailed above can improve the heart rate estimate by fusing estimates from the ECG and ABP, with SQI-modified innovations. (The trust factors, λk's, were set to be equal to unity, to reflect the fact that, in the absence of signal quality information, we trust the ECG as much as the ABP signal to provide an estimate of heart rate.) Figure 7 illustrates the general log-ical flow of combining measures of HR and ABP from both the ECG and ABP waveform. Note that ψ(ECG) is the
σk2=(rk/SQIk)2
σ12
σ22 σ σ
12 22
/( + )
σk2 =rk2/(λk⋅SQIk)2 (15)
General method for deriving heart rate and blood pressure from ICU signals
Figure 7
signal quality of the ECG as described in [14] and ψ(ABP) is the ψdescribed in this paper.
In other recent studies, we also used SQI-gated ABP sig-nals to determine the validity of ICU arrhythmia alarms [6,7,29], demonstrating that the ABP waveform can make a significant difference to the accuracy of alarms when a signal quality index is used.
Evaluation database 1. Normal clean data
The ABP estimate algorithm was evaluated on the MIMIC II database, found at http://www.physionet.org/phys iobank/database/mimic2db[18]. The following criteria were used to determine low-noise segments of the data-base: ECG signal quality [14] is good and ψ≥ 0.95 and the length of the segment is greater than or equal to one hour in duration and at least one channel of ECG and ABP are simultaneously available for analysis. From a 2500 patient subset with 150,000 hours of available data, the resultant clean dataset included 437 cases, comprising 3762 one-hour or more (1.62 ± 0.69 hours) data seg-ments, or 6084 hours total.
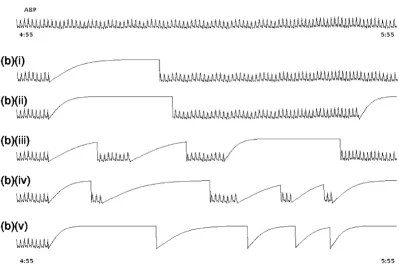
The six artificial ABP artifact models described above were then separately added to the clean dataset at different per-centages of noise duration to generate the noisy evalua-tion dataset. In order to provide a periodic training period, the artifacts were only added to every other 5 minute epoch in the clean data. Therefore, in each hour, 6 noisy 5 minute periods are created each followed by 5 minutes of clean data. The percentage of each 5 minute noise segment containing artificial noise was set to 20%, 40%, 60%, 80% and then 100% for each experiment. That is, for each 5 minute segment that is designated to contain noise, artifacts are simulated and added at random (in a non-overlapping manner) to these respective portions of that 5 minute segment. Each noisy (5 minute data) seg-ment was chose to follow a clean 5 minute segseg-ment. The rationale for this distribution was to allow the KF a period on which to train on the clean data. However, it turns out that much shorter segments of clean data could be chosen (see results section). Figure 8 illustrates the clean data and its appearance after adding the 'saturate to ABP maximum' artifact with differing percentages of artifact duration.
2. Abnormal arrhythmia data
The ABP estimation algorithm was also evaluated on an abnormal data subset of the MIMIC II database, which includes episodes of annotated arrhythmias [7]. The pres-ence of annotated arrhythmias allowed us to evaluate the performance of the algorithm for tracking heart rate changes during arrhythmic episodes which display sud-den changes in HR and ABP. No gold standard, labelled blood pressure data is currently available, and so it was
not possible to determine an independent objective meas-ure for ABP during the arrhythmic episodes. However, in a related work [6,7] we created a database to aid the devel-opment of a false alarm suppression algorithm for the ICU. This database included a subset of over 5500 life-threatening alarms taken from the same MIMIC II data-base, for which we have simultaneous ECG and ABP data. A team of experts annotated each alarm (at least twice, with a separate pass and adjudication for disagreements), for the categories of asystole, extreme bradycardia, extreme tachycardia, ventricular tachycardia (VT) and ven-tricular flutter/fibrillation (VF). We do not consider the algorithm presented in this paper to be applicable to asys-tole, since asystoles shorter than 10 seconds would not be detected without parameter adjustments to the algorithm. Furthermore, ventricular arrhythmias are waveform mor-phology related, and therefore are not relevant to our HR-tracking algorithm presented here.
In the MIMIC II database there are over 45,000 hours of simultaneous ECG and ABP data with associated alarms of the above types. These data include 707 episodes of extreme bradycardia alarms (of which 506 are true and 201 false) and 1877 episodes of extreme tachycardia alarms (of which 1444 true and 433 false). Such false alarm rates (28.4% for bradycardia and 23.1% for tachy-cardia) are typical of alarms in the ICU, which can be as high as 85% [3], but for life threatening alarms are usually around 40% [7]. Epochs of 20 seconds around each extreme bradycardia and tachycardia alarm, (with the alarm occurring at 17 seconds in the epoch) were chosen providing a test set of 2584 events (1950 true episodes) and over 14 hours (861 minutes) of simultaneous ECG and ABP.
Results
Following our previous work [14], we considered the Kalman filtered ABP of the clean dataset as the true ABP and a gold standard by which to evaluate the different ABP estimation methods. These were:
1. FE: Feature Extraction ABP estimate using wSQI.
2. SH: Sample-and-hold ABP estimate using ABP fea-ture extraction routine of wSQI and clipping the reported ABP value when ψ<ψt (SH). (This simulates the operation of monitoring equipment in the ICU.)
3. KF: ABP estimate using the SQI-based Kalman filter.
Addi-tional File 2] details the mean SQI, Ψ, ± one standard deviation, and the comparison of different ABP estima-tion methods on the whole evaluaestima-tion dataset for each of the different types of artifacts detailed in section 2.1. Table S1 also provides these results for different percentages of artifact contamination. In general, for slow saturation arti-facts, we can see that a value of ψ> 0.5 leads to a low ABP estimation error (less than 10 mmHg) using the SQI-based KF ABP estimation method described in this paper. However, the reduced pulse pressure artifact results in rel-atively large errors for the estimate of SBP when ψ≤ 0.9, indicating that we should trust the SBP less than the MBP or DBP, particularly in this circumstance. SBP estimates were corrupted mostly by saturations to ABPmin and reduced pulse pressure. The MBP was mostly distorted by saturations to ABPmax, square wave artifacts and satura-tions to ABPmin.
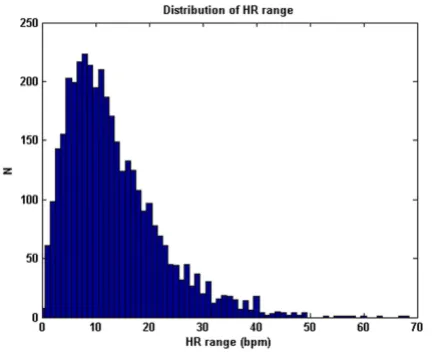
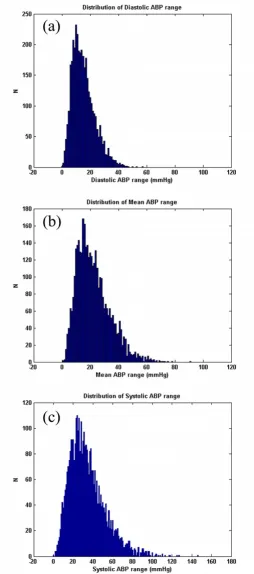
Note also that the results for the sample-and-hold algo-rithm (repeating the last value when ψ<ψt) are almost as good as the SQI-modified KF algorithm. This is in part due to the accuracy of the signal quality metric, and in part due to the fact that the data do not vary much in terms of blood pressure (or heart rate) for long periods of time. Figures 9, 10 and 11 illustrate the range of heart rates and blood pressures for the clean test data. Note that the range over all segments is approximately log-normal for HR, SBP, MBP and DBP and that most segments exhibit maxi-mal changes of around 10 BPM and 20 mmHg. This is reflective of the fact that ICU patients are well-managed [30]. We therefore tested the algorithm on arrhythmias which exhibit rapid and large changes in both ABP and HR.
Based on previous work [6], we calculated heart rates using the median of the four shortest pulse-to-pulse (PP) intervals in the ABP waveform for tachycardic episodes, Example of clean data and noisy ABP
Figure 8
Example of clean data and noisy ABP. (a) clean data with 2 leads of ECG and 1 lead of ABP. (b) The same segment of ABP after adding artifact 1, (asmax), saturation to maximum ABP with (i) 20, (ii) 40, (iii) 60, (iv) 80 and (v) 100 percentage of noise
and the four longest PP intervals for bradycardic episodes [29]. Of the 707 bradycardia alarms, (506 true and 201 false), our algorithm indicated suppression of 149 of the 201 false alarms (74.1%) and only 2 of the 506 true bradycardia alarms (0.4%). For tachycardia, 233 of the 433 false alarms (53.8%) were suppressed and only 6 of the 1444 true alarms (0.4%) were suppressed.
When the ECG-derived heart rate is also used [14], and fused with the ABP-derived heart rate, we found that our algorithm indicated suppression of 167 of the 201 false extreme bradycardia alarms, and accepted 500 of the 506 true extreme bradycardia alarms. In other words, our KF-based HR estimation algorithm correctly tracked the true abnormal drops in HR 98.8% of the time, and was only 'fooled' into tracking the artifacts (that tricked the moni-tors into alarming) 16.9% of the time. In the case of tach-ycardia, only one of the 1444 true alarms was suppressed and 281 of the 433 false alarms were suppressed. That is, over 99.9% of the true episodes of extreme tachycardia were tracked correctly, and 35.1% of the false episodes were incorrectly tracked as significant heart rate increases.
To test how much the use of the ABP waveform adds to our analysis, we evaluated our KF-framework for false alarm suppression using the ECG signal alone. In such a scenario, we found that for extreme bradycardia, our algo-rithm suppressed only 51 false alarms and suppressed 8 true alarms by mistake and for extreme tachycardia, our algorithm suppressed 4 true alarms and only 155 false alarms.
Finally, to test the relative contributions that our signal quality metrics, and fusion approach make to the results, we repeated the arrhythmia analysis using the SH method with signal quality control. This resulted in a suppression of 146 false alarms and 2 true alarms for extreme brady-cardia and the suppression of 230 false alarms 8 true alarms for extreme tachycardia. If the signal quality gating is removed, then many more true alarms are suppressed. In this scenario the results are that 155 false and 50 true bradycardia alarms are suppressed, and 399 false and 159 true tachycardia alarms are suppressed. This indicates that the signal quality analysis mainly contributes towards the improved false alarm suppression performance, although the data fusion step still provides a large increase in the false alarm suppression rate.
Clearly, fusing independent heart rate estimators from the ECG and ABP and using signal quality metrics results in a large increase in false alarm suppression rate from both single signal analysis, and conventional approaches, with only a minor (0.8%) increase in true alarm suppression rate (for extreme bradycardia) and a drop in true alarm suppression rate (from 0.4% to 0.1%) for extreme tachy-cardia.
Discussion
Our artifact classification scheme, and resultant evalua-tions using artificial examples of each type of artifact, has highlighted the different accuracies in ABP (SBP, MBP and DBP) estimates in the presence of different types of arti-facts. In general, the DBP is less noise-sensitive than the MBP, which is less noise-sensitive than the SBP. Slow sat-urations or decreases in pulse pressure (such as from thrombosis in the arterial line) can lead to large errors. High frequency noise appears to be less problematical in assessing accurate ABP estimates. Therefore, an automated method for classifying the type of artifacts identified in this study would be useful in tuning the response of the system, and allowing adaptation of the KF to change based upon artifact types. Such schemes could involve running assessments of the frequency content of the data [31], step-change detection and saturation detectors (such as tracking the ratios DBP/SBP and DBP/MBP).
Note that although the KF-based approach presented in this article is, on average, only marginally superior to a sample-and-hold approach when the signal quality is low, which is reflective of the infrequent changes in ABP or HR in the type of data we are using (i.e. ICU data) [30]. Of course, if a rapid change occurs during an artifactual period, the KF-fusion method is more likely (than the SH method) to accurately track the changes, as it can make use of data from other sources (such as a pulse oximeter or a non-invasive blood pressure cuff reading). This is demonstrated by the comparative results when applying The distribution of true HR range (HRmax-HRmin) of the clean
dataset comprising 3762 data segments of 1 hour or longer continuous waveform data (1.62 ± 0.69 h)
Figure 9
The distribution of true BP range (ABPmax-ABPmin) of the clean dataset for the DBP(a), MBP(b) and SBP(c) for each segment of data comprising 3762 data segments of 1 hour or longer continuous waveform data (1.62 ± 0.69 h)
Figure 10
our algorithm to extreme bradycardia and tachycardia with and without the addition of the ABP signal. Further-more, the KF formulation presented in this article is a sim-ple scalar formulation. However, it is evident that we can track a two-dimensional state ([HR, ABP]), or even a four-dimensional state ([HR, SBP, MBP, DBP]), to take advan-tage of the relationship between the HR and ABP. This may improve the tracking of the cardiovascular state and allow more accurate automatic rejection of erroneous esti-mates using our SQI-modified KF tracking procedure. However, care must be taken to factor in the subtleties of the cardiovascular changes in unhealthy patients (such as during hemorrhage), and a model of the cardiovascular system may be appropriate. Therefore, the technique pre-sented in this paper could be extended to track cardiovas-cular model parameters over time, such as in Sameni et al. [32]. One simple extension of our approach that may be
most appropriate is to the tracking of cardiac output meas-ures, since such measures involve an estimate of the heart rate and blood pressure and require high quality wave-forms. The method used in this paper may also allow automatic error bounds to be delivered with any estimate of the parameters being considered.
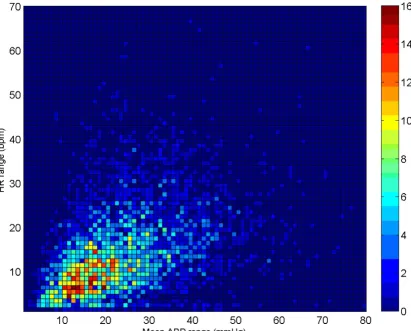
It is interesting to point out the generality of the results presented in this paper. The source data (the MIMIC II database) is a large ICU database consisting of a variety of patients one would expect to find in a top-level US teach-ing hospital. These include patient in the medical, surgi-cal, coronary, trauma, and cardiac surgery care units. A full description of the data can be found in [18]. Data were collected using standard equipment mainly from radial arterial lines. Although it is hard to say, without analyzing large amounts of similar data, we do not imagine that The joint-distribution of true HR range (HRmax-HRmin) and BP range (MBPmax-MBPmin) of the clean dataset for each segment of data comprising 3762 data segments of 1 hour or longer continuous waveform data (1.62 ± 0.69 h)
Figure 11
changes in equipment or location would significantly affect the generality of these results. The use of arterial blood pressure lines outside of the ICU is rare (except in the operating room), and so the data we have used is likely to provide a general assessment. It is also important to consider the generality of the artifact types. While prac-tices between countries may differ marginally, we do not imagine that this would lead to large differences in artifact types for other monitoring locations.
The work in this paper may also be extended to analyze photoplethysmograms (waveforms derived from pulse oximetery), a more common and non-invasive method of measuring the pulsatile flow in the cardiovascular system. Although excellent proprietary systems exist for signal quality assessment in such signals, and in some cases an SQI is available from the oximeter, no information is pub-licly available concerning the response of monitors to dif-ferent artifact types, and under difdif-ferent recording conditions. Furthermore, no data fusion framework of blood pressure with other cardiac-related signals (such as the ECG) has been published (or, as far as we know, implemented in a practical scenario). Our approach may provide a general system for assessing the signal quality and using the SQI to automatically inform the validity of derived estimates and may be appropriate in many medi-cal settings.
Conclusion
We have presented a phenomenological classification sys-tem for artifact types in the blood pressure, and artificial methods for generating these artifacts. We have also pre-sented an updated online system for continuously esti-mating HR and ABP using an SQI-modified Kalman Filter, and robustly weighting the estimates based on our trust in a given data segment. Using an extensive database of simultaneous ECG and ABP signals, we have evaluated our HR and ABP tracking algorithm. The proposed algo-rithm is shown to be robust and provides a predefined threshold (ψ≥ 0.9) for selecting data that may be trusted to give accurate blood pressure estimates (with an average error less than 10 mmHg). We have also demonstrated that diastolic blood pressure estimates are more robust to artifacts than mean blood pressure estimates, which in turn are more robust to artifacts than systolic blood pres-sure estimates. SBP estimates are likely to result in large errors for even moderate to high signal quality levels for certain types of artifact without signal quality analysis. Saturation-type noise produced the largest errors for all three blood pressure estimates. Results demonstrate that stringent signal quality measures should be used to qual-ify all blood pressure estimates. We have also shown that fusing independent heart rate estimators from the ECG and ABP together with SQIs in a KF framework provides a large increase in performance when tracking real episodes
of extreme bradycardia and tachycardia over conventional approaches used in the modern ICU.
Abbreviations
ABP: Arterial Blood Pressure; BPM: Beats Per Minute; DBP: Diastolic Blood Pressure; ECG: Electrocardiogram; FE: Feature Extraction; ICU: Intensive Care Unit; KF: Kalman Filter; MBP: Mean Blood Pressure; MIMIC: Multi-Parameter Intelligent Monitoring for Intensive Care; mmHg: Millimeters of Mercury (units of blood pressure); PP: Pulse-to-Pulse (interval); rMSE: Root Mean Square Error; SBP: Systolic Blood Pressure; SQI: Signal Quality Index; SH: Sample-and-Hold.
Competing interests
The authors declare that they have no competing interests.
Authors' contributions
GDC designed the experimental procedures, drafted the manuscript and provided overall editorial approval. GDC also provided coding assistance and a subset of the algo-rithms. RGM provided project guidance, interpretation of the ABP artifacts, and editorial assistance with the manu-script. QL provided descriptions of the techniques and generated the figures and editorial assistance. QL also implemented the majority of code, provided algorithm architecture input and designed some of the experiments. All authors read and approved the final manuscript.
Additional material
Acknowledgements
This work was supported by the U.S. National Institute of Biomedical Imag-ing and BioengineerImag-ing (NIBIB) under Grant Number R01 EB001659, and the Information & Communications University, Daejeon, South Korea under Grant Number 6914565. The content of this paper is solely the
Additional file 1
Matlab source code for generating artifacts described in article. Con-tains the following files: bp_art.m – Matlab routine for generating arti-facts sigmoid_art.m – Matlab sub-function to bp_art.m brownnoise.m – Matlab sub-function to bp_art.m sinc_art.m – Matlab sub-function to bp_art.m
Click here for file
[http://www.biomedcentral.com/content/supplementary/1475-925X-8-13-S1.zip]
Additional file 2
ψ and ABP estimation error for different types of noise and percentage levels of noise. Table S1 details the mean SQI and the comparison of dif-ferent ABP estimation methods on the whole evaluation dataset for each of the different types of artifacts and the results for different percentages of artifact contamination.
Click here for file
Publish with BioMed Central and every scientist can read your work free of charge "BioMed Central will be the most significant development for disseminating the results of biomedical researc h in our lifetime."
Sir Paul Nurse, Cancer Research UK
Your research papers will be:
available free of charge to the entire biomedical community
peer reviewed and published immediately upon acceptance
cited in PubMed and archived on PubMed Central
yours — you keep the copyright
Submit your manuscript here:
http://www.biomedcentral.com/info/publishing_adv.asp
BioMedcentral responsibility of the authors and does not necessarily represent the official
views of the NIBIB or the NIH. The authors would like to acknowledge the work of Drs. Tarassenko, Townsend, Sun and Zong, whose work contrib-uted significantly to this research.
References
1. McGhee BH, Bridges ME: Monitoring arterial blood pressure: what you may not know. Critical Care Nurse 2002, 22:60-79. 2. Lawless ST: Crying wolf: false alarms in a pediatric intensive
care unit. Crit Care Med 1994, 22:981-985.
3. Tsien CL, Fackler JC: Poor prognosis for existing monitors in the intensive care unit. Crit Care Med 1997, 25:614-619. 4. Mäkivirta A, Koski E, Kari A, Sukuvaara T: The median filter as a
preprocessor for a patient monitor limit alarm system in intensive care. Comput Methods Programs Biomed 1991, 34:139-144. 5. Chambrin MC: Alarms in the intensive care unit: how can the number of false alarms be reduced? Critical Care 2001,
5:184-188.
6. Clifford GD, Aboukhalil A, Zong W, Sun J, Moody GB, Mark RG:
Using the blood pressure waveform to reduce critical false ECG alarms. Comput in Cardiol 2006, 33:829-832.
7. Aboukhalil A, Nielsen L, Saeed M, Mark RG, Clifford GD: Reducing false alarm rates for critical arrhythmias using the arterial blood pressure waveform. J Biomed Inform 2008, 3(41):442-451. 8. Tsien CL, Kohans IS, Mclntosh N: Building ICU artifact detection models with more data in less time. Proc AMIA Symp
2001:706-710.
9. Zhang Y: Real-time development of patient-specific alarm algorithms for critical care. Conf Proc IEEE Eng Med Biol Soc
2007:4351-4.
10. Zhang Y, Silvers CT, Randolph AG: Real-Time Evaluation of Patient Monitoring Algorithms for Critical Care at the Bed-side. Conf Proc IEEE Eng Med Biol Soc 2007:2783-6.
11. Zhang Y, Szolovits P: Patient-specific learning in real time for adaptive monitoring in critical care. J Biomed Inform 2008,
3(41):452-460.
12. Zong W, Moody GB, Mark RG: Reduction of false arterial blood pressure alarms using signal quality assessment and relation-ships between the electrocardiogram and arterial blood pressure. Med Biol Eng Comput 2004, 42:698-706.
13. Meurs KM, Miller MW, Slater MR: Comparison of the indirect oscillometric and direct arterial methods for blood pressure measurements in anesthetized dogs. J Am Anim Hosp Assoc
1996, 32:471-475.
14. Li Q, Mark RG, Clifford GD: Robust heart rate estimation from multiple asynchronous noisy sources using signal quality indi-ces and a Kalman filter. Physiol Meas 2008, 29:15-32.
15. Clifford GD, Long WJ, Moody GB, Szolovits P: Robust parameter extraction for decision support using multimodal intensive care data. Philos Transact A Math Phys Eng Sci 2009,
367(1887):411-29.
16. Zong W, Heldt T, Moody GB, Mark RG: An open-source algo-rithm to detect onset of arterial blood pressure pulses. Com-put in Cardiol 2003, 30:259-262.
17. Sun JX, Reisner AT, Mark RG: A signal abnormality index for arterial blood pressure waveforms. Comput in Cardiol 2006,
33:13-16.
18. Clifford GD, Scott DJ, Villarroel M: User Guide and Documenta-tion for the MIMIC II Database. Version 2, Release 1. 2009. 19. Goldberger AL, Amaral LAN, Glass L, Hausdorff JM, Ivanov PC, Mark
RG, Mietus JE, Moody GB, Peng CK, Stanley HE: Physiobank, phys-iotoolkit, and physionet: Components of a new research resource for complex physiologic signals. Circulations 2000,
101:e215-e220.
20. Brown RG: Introduction to Random Signal Analysis and Kalman Filtering
New York: Wiley; 1983.
21. Welch G, Bishop G: An introduction to the Kalman filter. In
Technical Report TR95-041 Dept Comp Sci, Univ North Carolina, Chapel Hill; 2004.
22. Tarassenko L, Mason L, Townsend N: Multi-sensor fusion for robust computation of breathing rate. Electronics Letters 2002,
38:1314-1316.
23. Tarassenko L, Townsend N, Price JD: Combining measurements from different sensors. United States Patent Application Number 311250 [http://www.freepatentsonline.com/20030187337.html].
24. Hunyor SN, Flynn JM, Cochineas C: Comparison of performance of various sphygmomanometers with intra-arterial blood-pressure readings. Br Med J 1978, 15;2(6131):159-162. 25. Silman AJ: Failure of random zero sphygmomanometer in
general practice. Br Med J (Clin Res Ed) 1985,
15;290(6484):1781-1782.
26. Fitzgerald DJ, O'Malley K, O'Brien ET: Inaccuracy of London School of Hygiene sphygmomanometer. Br Med J (Clin Res Ed)
1982, 27;284(6316):662-663.
27. Saeed M: Temporal Pattern Recognition in Multiparameter ICU Data. 2007 [http://dspace.mit.edu/handle/1721.1/40507]. Doc-toral dissertation, Department of Electrical Engineering and Compu-ter Science, Massachusetts Institute of Technology, Cambridge, MA 28. Webster J, Newnham D, Petrie JC, Lovell HG: Influence of arm
position on measurement of blood pressure. Br Med J (Clin Res Ed) 1984, 26;288(6430):1574-1575.
29. Li Q, Clifford GD: Suppression of false arrhythmia alarms from ICU monitors using heart rate estimation based on com-bined arterial blood pressure and ECG analysis. The 2nd Inter-national Conference on Bioinformatics (iCBBE) Shanghai, China
2008:2185-2187.
30. Janz BA, Clifford GD, Mark RG: Multivariable analysis of seda-tion, activity and agitation in critically ill patients using the Riker scale, ECG, blood pressure and respiratory rate. Com-put in Cardiol 2005, 32:735-738.
31. Gil E, Vergara J, Laguna P: Detection of decreases in the ampli-tude fluctuation of pulse photoplethysmography signal as indication of obstructive sleep apnea syndrome in children. Biomel Sig Proc and Cont Biomedical Signal Processing and Control 2008,
3:267-277. doi:10.1016/j.bspc.2007.12.002.