CORRECTION
Open Access
Correction to: The impact of food
reformulation on nutrient intakes and
health, a systematic review of modelling
studies
Carlo Federici
1*, Patrick Detzel
2, Francesco Petracca
1, Livia Dainelli
2and Giovanni Fattore
1,3Correction to: BMC Nutr (2019) 5:2
https://doi.org/10.1186/s40795-018-0263-6
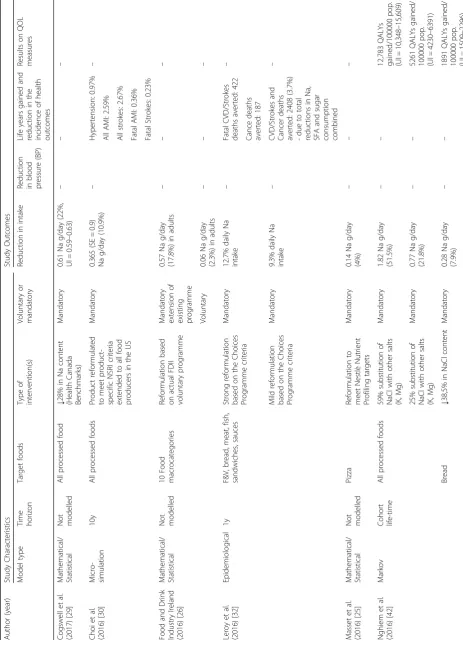
Following publication of the original article [
1
], the
authors reported an error in Table
1
. The rows and
columns do not align correctly. The correct table can be
found below.
The publishers apologise for this error. The original
article [
1
] has been updated.
Author details
1CeRGAS (Centre for Research on Health and Social Care Management), SDA
Bocconi School of Management, Milan, Italy.2Nestlé Research Center, Nestec SA, Lausanne, Switzerland.3Department of Policy Analysis and Public Management, Bocconi University, Milan, Italy.
Received: 11 January 2019 Accepted: 11 January 2019
Reference
1. Federici C, et al. The impact of food reformulation on nutrient intakes and health, a systematic review of modelling studies. BMC Nutr. 2019;5:2
https://doi.org/10.1186/s40795-018-0263-6.
* Correspondence:[email protected]
1CeRGAS (Centre for Research on Health and Social Care Management), SDA
Bocconi School of Management, Milan, Italy
Full list of author information is available at the end of the article
© The Author(s). 2019Open AccessThis article is distributed under the terms of the Creative Commons Attribution 4.0
Table
1
Interventions
targeting
sodium
consumption
Autho
r
(ye
ar)
Stud
y
Charac
teristics
Stud
y
Out
comes
Mod
el
type
Ti
me
hor
izon
Tar
get
food
s
Type
of
interve
ntion(s
)
Volunt
ary
or
mand
atory
Re
duction
in
intake
Redu
ction
in
blood
press
ure
(BP)
Life
years
gai
ned
and
red
uction
in
the
inc
idenc
e
of
heal
th
out
comes
Resu
lts
on
QOL
measu
res
Cogs
well
et
al.
(2017
)
[29]
Mat
hemat
ical/
Stat
istical
Not mod
elle
d
All
proc
essed
food
↓
28%
in
Na
cont
ent
(Heal
th
Canad
a
Be
nchmark
s)
Mandatory
0.
61
Na
g/day
(22%,
U
I=
0.59
–
0.63)
––
–
Choi
et
al.
(2016
)
[30]
Mi
cro-sim
ulation
10
y
All
proc
essed
foods
Prod
uct
refo
rmulated
to
meet
produ
ct-spe
cific
NSRI
criteria
exte
nde
d
to
all
food
produ
cers
in
the
US
Mandatory
0.
365
(SE
=
0.9)
Na
g/day
(10.9
%)
–
Hyp
ertension
:
0.97%
–
All
AM
I:
2.59%
All
st
rokes:
2.67%
Fatal
AMI:
0.36
%
Fatal
Strokes
:
0.23%
Food
an
d
Drink
Indust
ry
Ireland
(2016
)
[26]
Mat
hemat
ical/
Stat
istical
Not mod
elle
d
10
Food
macro
categories
Re
formulation
based
on
actual
FDII
vo
luntary
progr
amme
Mandatory exten
sion
of
existing progr
amme
0.
57
Na
g/day
(17.
8%)
in
adu
lts
––
–
Volunt
ary
0.
06
Na
g/day
(2.3
%)
in
adults
––
–
Leroy
et
al.
(2016
)
[32]
Ep
idem
iological
1y
F&V
,
bread,
me
at,
fish,
sandwiche
s,
sauces
Stro
ng
refo
rmulation
bas
ed
on
the
Cho
ices
Prog
ram
me
criteria
Mandatory
12
.7%
daily
Na
inta
ke
–
Fatal
CVD/S
trokes
de
aths
ave
rted:
422
–
Canc
e
de
aths
ave
rted:
187
Mi
ld
reform
ulation
bas
ed
on
the
Cho
ices
Prog
ram
me
criteria
Mandatory
9.
3%
dai
ly
Na
inta
ke
–
CVD
/Stroke
s
an
d
Canc
er
de
aths
ave
rted:
2408
(3.7%
)
-due
to
tot
al
red
uction
s
in
Na,
SFA
and
sugar
cons
um
ption
com
bined
–
Masset
et
al.
(2016
)
[25]
Mat
hemat
ical/
Stat
istical
Not mod
elle
d
Pizza
Re
formulation
to
me
et
Ne
stlè
Nutrient
Prof
iling
targets
Mandatory
0.
14
Na
g/day
(4%
)
––
–
Ngh
iem
et
al.
(2016
)
[42]
Mar
kov
Coh
ort
life
-time
All
proc
essed
foods
59
%
substitut
ion
of
NaC
l
with
othe
r
salts
(K,
Mg
)
Mandatory
1.
82
Na
g/day
(51.
5%)
––
12,7
83
Q
ALYs
gai
ned/1
00000
pop.
(UI
=
10,348
–
15
,609)
25
%
substitut
ion
of
NaC
l
with
othe
r
salts
(K,
Mg
)
Mandatory
0.
77
Na
g/day
(21.
8%)
––
5261
QALY
s
gai
ned
/
1000
00
po
p.
(UI
=
4230
–
6391
)
Bread
↓
38,5%
in
NaC
l
cont
ent
Mandatory
0.
28
Na
g/day
(7.9
%)
––
1891
QALY
s
gai
ned
/
1000
00
po
p.
(UI
=
1509
–
2296
Table
1
Interventions
targeting
sodium
consumption
(Continued)
Autho
r
(ye
ar)
St
udy
Charac
teristics
St
udy
Out
comes
Mod
el
type
Ti
me
hor
izon
Tar
get
food
s
Type
of
inte
rvention(s)
Volunt
ary
or
mand
atory
Re
duction
in
intake
Redu
ction
in
blood
press
ure
(BP)
Life
years
gai
ned
and
red
uction
in
the
inc
idenc
e
of
heal
th
out
comes
Resu
lts
on
QOL
me
asures
↓
11,1%
in
NaC
l
cont
ent
Mandatory
0.
08
Na
g/day
(2.3%
)
––
678
QALY
s
gained/
1000
00
po
p.
(UI
=
548
–
822)
Wilson
et
al.
(2016
)
[43]
Mar
kov
Co
hort
life
-time
All
proc
essed
food
s
(brea
d,
proces
sed
me
ats,
sauces,
snac
k
food
,
bakery,
cheese)
↓
36%
in
NaC
l
content
acr
oss
produ
ct
type
s
Mandatory
0.
628
Na
g/d
ay
––
5304
Q
ALYs
gained/
1000
00
po
p.
(UI
=
4270
–
6478
)
Volunt
ary
Sam
e
efficac
y
with
high
er
uncertainty
––
5000
Q
ALYs
gained/
1000
00
po
p.
(UI
=
3709
–
6391
)
Bread
↓
12
–
37%
in
NaCl
cont
ent
acro
ss
bre
ad
type
s
Mandatory
0.
043
Na
g/d
ay
––
387
QALY
s
gained/
1000
00
po
p.
(UI
=
309
–
470)
Volunt
ary
Sam
e
efficac
y
with
high
er
uncertainty
––
365
QALY
s
gained/
1000
00
po
p.
(UI
=
270
–
461)
Proc
essed
meats
↓
35
–
55%
in
NaCl
cont
ent
overa
ll
Mandatory
0.
069
Na
g/d
ay
––
583
QALY
s
gained/
1000
00
po
p.
(UI
=
470
–
704)
Volunt
ary
Sam
e
efficac
y
with
high
er
uncertainty
––
552
QALY
s
gained/
1000
00
po
p.
(UI
=
417
–
696)
Sauc
es
↓
30
–
63%
in
NaCl
cont
ent
acro
ss
sau
ces
type
s
Mandatory
0.
104
Na
g/d
ay
––
870
QALY
s
gained/
1000
00
po
p.
(UI
=
700
–
1057)
Volunt
ary
Sam
e
efficac
y
with
high
er
uncertainty
––
822
QALY
s
gained/
1000
00
po
p.
(UI
=
626
–
1039)
Comb
ination
of
bread,
proc
essed
meat
s
and
sau
ces
–
Mandatory
0.
217
Na
g/d
ay
––
1843
Q
ALYs
gained/
1000
00
po
p.
(UI
=
1487
–
2239
)
Volunt
ary
Sam
e
efficac
y
with
high
er
uncertainty
––
1743
Q
ALYs
gained/
1000
00
po
p.
(UI
=
1326
–
2204
)
Snack
food
↓
34
–
48%
in
NaCl
cont
ent
acro
ss
snac
ks
types
Mandatory
0.
032
Na
g/d
ay
––
265
QALY
s
gained/
1000
00
po
p.
(UI
=
217
–
322)
Volunt
ary
Sam
e
efficac
y
with
high
er
uncertainty
––
252
QALY
s
gained/
1000
00
po
p.
(UI
=
191
–
Table
1
Interventions
targeting
sodium
consumption
(Continued)
Autho
r
(ye
ar)
St
udy
Charac
teristics
St
udy
Out
comes
Mod
el
type
Ti
me
hor
izon
Tar
get
food
s
Type
of
inte
rvention(s)
Volunt
ary
or
mand
atory
Re
duction
in
intake
Redu
ction
in
blood
press
ure
(BP)
Life
years
gai
ned
and
red
uction
in
the
inc
idenc
e
of
heal
th
out
comes
Resu
lts
on
QOL
me
asures
Bread
and
bakery
produ
cts
↓
12
–
37%
in
NaCl
cont
ent
acro
ss
bre
ad
type
s;
↓
54
–
63%
in
NaCl
cont
ent
acro
ss
othe
r
bakery
produ
cts
Mandatory
0.
107
Na
g/d
ay
––
887
QALY
s
gained/
1000
00
po
p.
(UI
=
722
–
1078)
Volunt
ary
Sam
e
efficac
y
with
high
er
uncertainty
––
843
QALY
s
gained/
1000
00
po
p.
(UI
=
639
–
1061)
Chee
se
↓
27
–
42%
in
NaCl
cont
ent
acro
ss
che
ese
type
s
Mandatory
0.
045
Na
g/d
ay
––
383
QALY
s
gained/
1000
00
po
p.
(UI
=
309
–
461)
Volunt
ary
Sam
e
efficac
y
with
high
er
uncertainty
––
361
QALY
s
gained/
1000
00
po
p.
(UI
=
274
–
457)
Bruins
et
al.
(2015
)
[45]
Mat
hemat
ical/
St
atistical
Co
hort
life
-time
Sou
ps
↓
25%
in
Na
cont
ent
Mandatory
0.
05
Na
g/day
0.11
mm
Hg
Stro
kes:
0.49%
6.45
DALY
s
ave
rted/
1000
00
po
p
AM
I:
0.34%
An
gina:
0.34%
CHF
:
0.24%
Döts
ch-Klerk
et
al.
(2015)
[23]
Mat
hemat
ical/
St
atistical
Not mod
elle
d
All
proc
essed
food
s
Prod
ucts
reform
ula
ted
to
meet
the
6
g/day
NaC
l
cons
umpt
ion
targ
et
Mandatory
U
S:
1.8
Na
g/day
(23%)
––
–
U
K:
1.8
Na
g/day
(27%)
––
–
NL:
1.3
Na
g/day
(19%)
––
–
Prod
ucts
reform
ula
ted
to
meet
the
5
g/day
NaC
l
cons
umpt
ion
targ
et
Mandatory
U
S:
2.2
Na
g/day
(28%)
––
–
U
K:
2.1
Na
g/day
(32%)
––
–
NL:
1.8
Na
g/day
(26%)
––
–
Gillesp
ie
et
al.
(2015
)
[31]
Ep
idem
iologic
al
10
y
All
proc
essed
food
s
↓
30%
in
NaC
l
Mandatory
0.
58
Na
g/day
(UI
=
0.
56
–
0.
60)
0.81
mm
Hg
'(UI
=
0.53
–
1.
10)
CHD
de
aths
averted
or
post
poned:
4467
(UI
=
28
54
–
61
47)
–
↓
10%
in
NaC
l
Mandatory
0.
19
Na
g/day
(UI
=
0.
18
–
0.
20)
0.27
mm
Hg
(UI
=
0.18
–
0.37)
CHD
de
aths
averted
or
post
poned:
1502
(UI
=
95
3
–
2068)
–
↓
24%
in
NaC
l
Volunt
ary
(applie
d
to
39%
of
produ
cts)
0.
19
Na
g/day
(UI
=
0.
03
–
0.
63)
0.27
mm
Hg
(UI
=
0.04
–
0.92)
CHD
de
aths
averted
or
post
poned:
1474
(UI
=
22
0
–
4995)
Table
1
Interventions
targeting
sodium
consumption
(Continued)
Autho
r
(ye
ar)
St
udy
Charac
teristics
St
udy
Out
comes
Mod
el
type
Ti
me
hor
izon
Tar
get
food
s
Type
of
inte
rvention(s)
Volunt
ary
or
mand
atory
Re
duction
in
intake
Redu
ction
in
blood
press
ure
(BP)
Life
years
gai
ned
and
red
uction
in
the
inc
idenc
e
of
heal
th
out
comes
Resu
lts
on
QOL
me
asures
Hend
riksen
et
al.
(2015)
[22]
Mat
hemat
ical/
St
atistical
Not mod
elle
d
Sele
cted
foods
cont
ributing
to
high
inta
kes
of
NaC
l
↓
50%
in
NaC
l
content
on
average
Mandatory
0.
9
Na
g/day
(37%)
––
–
Ngh
iem
et
al.
(2015
)
[46]
Mar
kov
Co
hort
life
-time
All
proc
essed
food
s
↓
25%
in
NaC
l
Mandatory
0.
525
Na
g/d
ay
(15%)
––
4783
Q
ALYs
gained/
1000
00
po
p
(UI
=
3804
–
7174
)
Breads
,
proc
essed
me
ats
an
d
sau
ces
↓
25%
in
NaC
l
Mandatory
0.
296
Na
g/d
ay
(9%
)
––
2683
Q
ALYs
gained/
1000
00
po
p
(UI
=
2161
–
3256
)
Wilco
x
et
al.
(2015
)
[34]
Ep
idem
iologic
al
10
y
Not
mod
elle
d
Not
model
led
Mandatory
0.
005
Na
g/d
ay
(10%) (UI
=
0.
003
–
0.021)
1.15
mm
Hg
(UI
=
0.57
–
4.58)
CHD
Death
s
ave
rted:
49
7
(UI
=
130
–
3032
)
–
LYG
:
11192
(UI
=
56
79
–
41
,039)
–
Collins
et
al.
(2014
)
[36]
Ep
idem
iologic
al
10
y
Not
mod
elle
d
↓
15%
in
NaC
l
cont
ent
overa
ll
Volunt
ary
1.
21
Na
g/day
(UI
=
0.
32
–
1.
94)
–
LYG
:
14593
(UI
=
90
00
–
21
,049)
–
↓
20%
in
NaC
l
cont
ent
overa
ll
Mandatory
1.
62
Na
g/day
(UI
=
0.
65
–
3.
11)
–
LYG
:
19365
(UI
=
11
,967
–
27,887)
–
Hend
riksen
et
al.
(2014)
[47]
Mar
kov
20
y
(clinical
out
comes
);
coho
rt
life
-time
(DA
LYs)
All
proc
essed
food
s
↓
50%
in
NaC
l
cont
ent
on
average
Mandatory
2.
3
Na
g/day
(28%)
1.5
mmHg
(1.2%
)
4.
4%
AM
I
(UI
=
3.
1
–
5.6%)
0.5%
DALY
s
ave
rted
in
the
popu
lation
(UI
=
0.37
–
0.68
%)
CHF
:
1.8%
(UI
=
1.
3
–
2.3%)
Stro
kes:
6%
(UI
=
4.
1
–
7.8%)
Inc
rease
in
life
exp
ectan
cy:
0.7%
(UI
=
0.
5
–
0.9%)
Mason
et
al.
(2014
)
[53]
Ep
idem
iologic
al
10
y
Not
mod
elle
d
Not
model
led
Mandatory
10
%
daily
Na
inta
ke
(UI
=
5
–
40%)
–
Tu
nisia:
LYG
2272
(UI
=
11
51
–
33
61)
–
Syria
:
LYG
1119
2
(UI
=
56
79
–
41
,039)
Pal
estin
e:
LYG
945
(UI
=
47
9
–
3479)
Tu
rkey:
LYG
1352
21
(UI
=
68
,816
–
487,712
)
Kon
fino
et
al.
(2013
)
[37]
Mar
kov
10
y
All
proc
essed
food
s
↓
8%
in
NaC
l
inta
ke
(stepped
red
uction
by
4%
for
the
Mandatory (80%
of
sodium
from
proces
sed
food
s)
0.
353
Na
g/d
ay
1.00
–
2.00
mmHg
Tot
al
Death
s:
0.61%
–
Fatal
CHD:
Table
1
Interventions
targeting
sodium
consumption
(Continued)
Autho
r
(ye
ar)
St
udy
Charac
teristics
St
udy
Out
comes
Mod
el
type
Ti
me
hor
izon
Tar
get
food
s
Type
of
inte
rvention(s)
Volunt
ary
or
mand
atory
Re
duction
in
intake
Redu
ction
in
blood
press
ure
(BP)
Life
years
gai
ned
and
red
uction
in
the
inc
idenc
e
of
heal
th
out
comes
Resu
lts
on
QOL
me
asures
fi
rst
2y)
AM
I:
1.48%
Stro
kes:
0.99%
↓
40%
in
NaC
l
inta
ke
(4%
per
ye
ar
for
10
y)
Mandatory (80%
of
sodium
from
proces
sed
food
s)
1.
763
Na
g/d
ay
5.00
–
9.00
mmHg
Tot
al
Death
s:
1.77%
–
Fatal
CHD:
2.63%
AM
I:
4.27%
Stro
kes:
2.79%
Bertr
am
et
al.
(2012
)
[38]
Ep
idem
iologic
al
1y
Bread,
mar
gari
ne,
gravy,
soups
↓
54%
in
NaC
l
cont
ent
on
ave
rage
Mandatory
0.
85
Na
g/day
–
Stro
kes:
8%
–
CHD
:
6.5%
Hyp
ertensive
heart
dis
ease:
11%
Cobi
ac
et
al.
(2012
)
[48]
Mar
kov
Co
hort
life
-time
Bread,
mar
gari
ne,
bre
akfast
cere
als
Bas
ed
on
Hea
rt
Fou
ndat
ion
Ti
ck
Prog
ram
me:
↓
26%
in
NaC
l
content
in
bre
ad;
11%
in
mar
gari
ne
and
61
%
in
bre
akfast
ce
reals
Mandatory
0.
009
Na
g/d
ay
––
1451
DALY
s
ave
rted/
1000
00
po
p
(UI
=
1088
–
1813
)
Comb
ris
et
al.
(2011
)
[8]
Mat
hemat
ical/
St
atistical
Not mod
elle
d
Break
fast
cere
als
Mi
ld
to
st
rong
refo
rmulation
bas
ed
on
food
nut
rient
dis
tribution
Mandatory
0.
001
–
0.013
Na
g/day
(1.4
–
13.5
%)
––
–
Bisc
uits/
pastries
0.
0003
–
0.002
Na
g/day
(1.7
0
–
10.81%)
––
–
Bread-bas
ed
produc
ts
0.
0023
–
0.013
Na
g/day
(1.6
0
–
8.8%)
––
–
Cobi
ac
et
al.
(2010
)
[49]
Ep
idem
iologic
al
Co
hort
life
-time
Bread,
mar
gari
ne,
bre
akfast
cere
als
Bas
ed
on
Hea
rt
Fou
ndat
ion
Ti
ck
Prog
ram
me:
↓
26%
in
NaC
l
content
in
bre
ad;
11%
in
mar
gari
ne
and
61%
in
break
fast
cere
als
Volunt
ary
0.
009
Na
g/d
ay
––
5300
DALY
s
ave
rted
(UI
=
2600
–
9200
)
Mandatory exten
sion
of
actu
al
progr
am
to
all
produ
cts
––
–
110,
000
DALY
s
ave
rted
(UI
=
53,0
00
–
18
0,000)
Smith
-Spangl
er
et
al.
(2010)
[50]
Mar
kov
Co
hort
life
-time
Not
mod
elle
d
Not
model
led
Volunt
ary
9.
5%
dai
ly
Na
inta
ke
(UI
=
5
–
40%)
1.25
mm
Hg
Stro
kes
ave
rted:
51
3885
2,06
0,790
DALY
s
ave
rted
AM
I
ave
rted:
48
Table
1
Interventions
targeting
sodium
consumption
(Continued)
Autho
r
(ye
ar)
St
udy
Charac
teristics
St
udy
Out
comes
Mod
el
type
Ti
me
hor
izon
Tar
get
food
s
Type
of
inte
rvention(s)
Volunt
ary
or
mand
atory
Re
duction
in
intake
Redu
ction
in
blood
press
ure
(BP)
Life
years
gai
ned
and
red
uction
in
the
inc
idenc
e
of
heal
th
out
comes
Resu
lts
on
QOL
me
asures
Roode
nburg
et
al.
(2009)
[27]
Mat
hemat
ical/
St
atistical
Not mod
elle
d
All
proc
essed
food
s
Re
formulation
set
to
meet
Choic
es
Prog
ram
me
criteria
Mandatory
23
%
daily
Na
inta
ke
(10%
adj
usting
for
ene
rgy
compe
nsation)
––
–
Rubins
tein
et
al.
(2009)
[51]
Mar
kov
Co
hort
life
-time
Bread
↓
to
1
g
of
NaCl
pe
r
10
0
g
of
bre
ad
Volunt
ary
–
1.33
mm
Hg
–
18.7
DALY
s
ave
rted/
1000
00
po
p
Murray
et
al.
(2003
)
[52]
Mar
kov
Co
hort
life
-time
Not
mod
elle
d
Not
model
led
Mandatory
Ass
umed
30
%
Na
Intake
Amr
B:
3.
11%
on
ave
rage
–
600,
000
DALY
s
ave
rted
EurA:
3.
49%
on
ave
rage
–
1,30
0,000
DALY
s
ave
rted
SearD:
3.
49%
on
ave
rage
–
1,00
0,000
DALY
s
ave
rted
Volunt
ary
Ass
umed
15
%
Na
Intake
Amr
B:
1.
56%
on
ave
rage
–
300,
000
DALY
s
ave
rted
in
the
popu
lation
EurA:
1.
74%
on
ave
rage
–
700,
000
DALY
s
ave
rted
in
the
popu
lation
SearD:
1.
75%
on
ave
rage
–
500,
000
DALY
s
ave
rted
in
the
popu
lation
Abbreviations
:
AMI
Acute
Myocardial
Infarction,
AmrB
Region
of
the
Americas
group
B,
CHD
Coronary
Heart
Disease,
CHF
Coronary
Heart
Failure,
CVD
Cardiovascular
diseases,
DALY
Disability
Adjusted
Life
Years,
EurA
European
Region
group
A,
FDII
Food
and
Drink
Industry
Ireland,
F&V
fruit
and
vegetables,
K
potassium,
LYG
Life
Years
Gained,
Mg
magnesium,
Na
sodium,
NaCl
Sodium
Chloride,
NL
Netherlands,
NSRI
National
Salt
Reduction
Initiative,
QALY
Quality
Adjusted
Life
Year,
SearD
Southeast
Asian
Region
group
D,
UI
Uncertainty
Interval,
UK
United
Kingdom,
US
United
States
of