METHODOLOGY
A gene expression microarray
for
Nicotiana benthamiana
based on de novo
transcriptome sequence assembly
Michal Goralski
1, Paula Sobieszczanska
1, Aleksandra Obrepalska‑Steplowska
2, Aleksandra Swiercz
1,3,
Agnieszka Zmienko
1,3*and Marek Figlerowicz
1,3*Abstract
Background: Nicotiana benthamiana has been widely used in laboratories around the world for studying plant‑pathogen interactions and posttranscriptional gene expression silencing. Yet the exploration of its transcriptome has lagged behind due to the lack of both adequate sequence information and genome‑wide analysis tools, such as DNA microarrays. Despite the increasing use of high‑throughput sequencing technologies, the DNA microarrays still remain a popular gene expression tool, because they are cheaper and less demanding regarding bioinformatics skills and computational effort. Results: We designed a gene expression microarray with 103,747 60‑mer probes, based on two recently published versions of N. benthamiana transcriptome (v.3 and v.5). Both versions were reconstructed from RNA‑Seq data of non‑ strand‑specific pooled‑tissue libraries, so we defined the sense strand of the contigs prior to designing the probe. To accomplish this, we combined a homology search against Arabidopsis thaliana proteins and hybridization to a test 244k microarray containing pairs of probes, which represented individual contigs. We identified the sense strand in 106,684 transcriptome contigs and used this information to design an Nb‑105k microarray on an Agilent eArray plat‑ form. Following hybridization of RNA samples from N. benthamiana roots and leaves we demonstrated that the new microarray had high specificity and sensitivity for detection of differentially expressed transcripts. We also showed that the data generated with the Nb‑105k microarray may be used to identify incorrectly assembled contigs in the v.5 transcriptome, by detecting inconsistency in the gene expression profiles, which is indicated using multiple microar‑ ray probes that match the same v.5 primary transcripts.
Conclusions: We provided a complete design of an oligonucleotide microarray that may be applied to the research of N. benthamiana transcriptome. This, in turn, will allow the N. benthamiana research community to take full advan‑ tage of microarray capabilities for studying gene expression in this plant. Additionally, by defining the sense orienta‑ tion of over 106,000 contigs, we substantially improved the functional information on the N. benthamiana transcrip‑ tome. The simple hybridization‑based approach for detecting the sense orientation of computationally assembled sequences can be used for updating the transcriptomes of other non‑model organisms, including cases where no significant homology to known proteins exists.
Keywords: Nicotiana benthamiana, Microarray, Coding strand, Leaf and root transcriptome
© 2016 The Author(s). This article is distributed under the terms of the Creative Commons Attribution 4.0 International License (http://creativecommons.org/licenses/by/4.0/), which permits unrestricted use, distribution, and reproduction in any medium, provided you give appropriate credit to the original author(s) and the source, provide a link to the Creative Commons license, and indicate if changes were made. The Creative Commons Public Domain Dedication waiver (http://creativecommons.org/ publicdomain/zero/1.0/) applies to the data made available in this article, unless otherwise stated.
Background
The multiple genome sequencing projects undertaken during the last decade constituted the basis for integrated,
whole-genome studies of genes, gene functions and regu-latory mechanisms in various organisms. Analysis of the cell’s transcriptome composition and dynamics in response to specific stimuli provides important insights into the complexity of the gene regulatory network and key genetic players [1–3]. Currently, the most commonly used techniques for genome-wide expression studies are
Open Access
*Correspondence: [email protected]; [email protected] 3 Institute of Computing Science, Poznan University of Technology, Piotrowo 2, 60‑965 Poznan, Poland
DNA microarrays and high throughput RNA sequenc-ing (RNA-Seq) [4]. The latter technique directly reveals the sequence of transcripts and is becoming increas-ingly popular, as a result of continuous improvements in both the sequencing technology and the data analysis software. This increase has been marked by the develop-ment of sequencing centers and large consortia focused on specific organisms (Rice Genome Annotation Project, 1001 Arabidopsis Genomes Project, The Maize Genome Sequencing Consortium, to name just a few). These communities work on developing and standardization of protocols to facilitate aggregating and comparison of various datasets. Current RNA-Seq applications involve assembly of the transcriptome, with or without the refer-ence genome information, gene discovery and expression analysis, identification of unknown exon junctions and alternative transcripts, measuring allele-specific expres-sion and many more [5–8]. On the contrary, microarrays can only derive information on targets that are actually represented by the microarray probes and are sensitive to cross-hybridization, as well as display poor signal resolu-tion and increased variaresolu-tion at low signal intensities [9, 10]. Despite these drawbacks, the results generated on microarray platforms are concordant with those obtained with RNA-Seq [11, 12]. Additionally, thousands of studies performed over the past decades proved that the micro-arrays reflect the transcriptome composition with high fidelity and that they are a rich source of biologically val-uable information. Since their introduction, microarrays have been effectively used in searching for disease mark-ers [13], alternative splicing [14], gene function predic-tion [15], identification of transcriptionally active regions of the nuclear, mitochondrial and chloroplast genomes [16–18] and many other applications. The microarray experiments are still much cheaper than RNA-Seq, not only regarding the price of consumables and reagents but also the computational and human resources required for data analysis and storage. The latter are often underesti-mated when calculating the real costs of high-throughput sequencing experiments [19]. Remarkably, extracting biological information from the RNA-Seq data requires combining computational skills with deep knowledge of the problem of interest, typically by the close coop-eration of experts in each of those fields. Therefore, sequencing-based experiments may pose a substantial challenge for individual laboratories. With the small size of the resulting datasets and the relatively easy data analysis, DNA microarrays are still an attractive alterna-tive to RNA-Seq for a variety of studies, e.g., focused on differential analysis of known genes in the conditions of study and in time-course studies, where a large number of samples are to be processed and compared in a repeat-able manner. We surveyed the gene expression profiling
experiments for Arabidopsis and rice, deposited in Gene Expression Omnibus database in years 2012–2015. Those which utilize DNA microarrays constantly outnumber the sequencing-based studies (Additional file 1: Figure S1). Even taking into account the delays in publishing results of research projects, this comparison proves that the DNA microarrays are still used for measuring gene expression changes.
Nicotiana benthamiana is a plant model widely used in
many laboratories around the world, especially in plant-pathogen interaction studies, due to the ease of infection by a large number of plant viruses [20–23], viroids [24], bacteria [25, 26] and fungi [27, 28]. However, the num-bers of N. benthamiana gene expression profiling results available in public databases, such as Gene Expression Omnibus (GEO) or ArrayExpress, are surprisingly low. One possible reason for the low abundance is the lack of a microarray platform dedicated to N. benthamiana. The detailed design of the only N. benthamiana-specific oli-gonucleotide microarray described so far [29] based on Expressed Sequence Tags data has not been revealed (this information is available on demand from the authors [29]) and the microarray has not been widely used. Moreover, it was produced in the NimbleGen technology, which was discontinued and the NimbleGen microarrays are no longer available to purchase. Nearly 98 % of micro-array experiments for N. benthamiana reported in GEO were carried out with microarrays specific to another
Solanaceae species, thus employing a so-called
cross-spe-cies hybridization (CSH) approach. This approach gained considerable popularity before RNA-Seq methods were introduced on a broad scale and was successfully utilized to profile gene expression in multiple organisms with limited sequence information as well as to extract valid biological information [30–33]. However, it was admit-ted that CSH analyses suffer from several limitations, which significantly reduce the amount of information that can be derived from the microarrays. These limita-tions include: higher proportion of genes with no detect-able signal (due to lack of the target matching the probe), higher risk of cross-hybridization of transcripts that have similar (but not perfect) homology to the microar-ray probe, and the lack of probe representation for genes specific to the organism of interest. Also, several authors reported that CSH is characterized by lower mean signal intensity and disturbed spot morphology in comparison with single species hybridization, as a result of weaker binding of targets to their non-perfectly matching probes [34, 35]. All these disturbances affect the overall qual-ity of microarray data and complicate the analysis steps. Published reports on sequencing the N. benthamiana
genome [36, 37] and, more recently, on assembling the
39] now enable researchers to perform N. benthamiana -oriented studies in the broader, genomics context.
To facilitate these types of studies, we designed an oli-gonucleotide microarray (Nb-105k microarray) based on the transcriptomes assembled de novo from the short reads by Australian & New Zealand Consortium and described in detail previously [38, 39]. As those transcrip-tomes were derived from the non-strand-specific librar-ies, we used bioinformatics and experimental approaches to ensure the correct orientation of the probes on the final microarray. Our microarray design has been made public via the Agilent eArray platform. In our experience, the Nb-105k microarray showed excellent performance and high sensitivity when employed for gene expression profiling in leaves versus roots. We predict that it will become an appreciated and useful gene expression analy-sis resource for the N. benthamiana research community.
Results
Determination of the sense cDNA strand in N. benthamiana transcriptome v.3 unigenes
To facilitate the gene expression studies in N.
bentha-miana, we decided to design a custom microarray tool
which will represent the entire N. benthamiana tran-scriptome and will be compatible with a widely employed Agilent technology platform. The microarray was pri-marily based on transcriptome v.3, which represented the most contemporary and comprehensive source of N.
benthamiana transcripts available at the time our work
was initiated. The transcriptome v.3 was previously cre-ated with the effort of the Australian & New Zealand Consortium, by assembling 193 million short reads gen-erated from the RNA-Seq analysis of nine different N.
benthamiana tissues on an Illumina sequencing platform
using Abyss v1.3 and Trans-Abyss v1.1 [38]. It consists of a representative set of 119,014 unigenes with an aver-age size of 795 bp (the longest contig size was 14,845 bp) and an extended dataset of 237,340 unique transcripts, including all spliced isoforms detected for each gene.
We expected random orientation of the unigenes because they were assembled de novo from reads that originated from non-strand-specific libraries. This posed a problem, as the oligonucleotide probe design step requires a priori knowledge of the transcript orientation. The probes targeting non-coding strands will be useless, as they will not recognize the intended transcript (rep-resented by fluorescently labeled single-stranded cDNA/ cRNA). To determine the coding strand, we performed homology searches on the amino acid level against
Arabi-dopsis thaliana reference protein set. Matches were
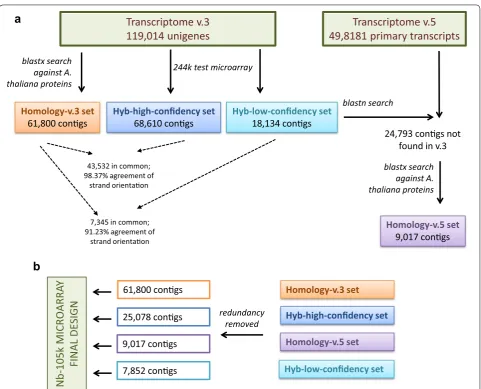
found for 61,800 N. benthamiana unigenes (Homol-ogy-v.3 set, see Fig. 1) and their orientation was chosen accordingly. Of the unigenes, 50.4 % needed conversion
to their reverse complement, confirming our expecta-tions regarding strand randomness introduced by the sequencing and de novo assembly process.
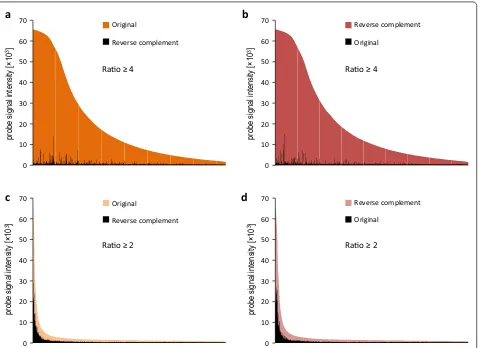
Homology searches provided the strand orientation for approximately half of the unigenes. To increase this number, we turned to experimental detection of the cod-ing strand. To accomplish this, we designed a test 244k microarray with pairs of probes representing 118,934 unigenes in both orientations (80 shortest unigenes from the v.3 transcriptome were not included, due to the microarray capacity limitations). The microarray was hybridized to a labeled RNA pool from various tissues and experimental treatments of N. benthamiana. The sense probe was then identified for each unigene as being the only one from the pair which produced a detectable microarray signal or had a stronger signal. We arbitrarily set the relative signal intensity of the expressed strand to be at least 4 times higher than its reverse complement to ensure high confident predictions (Fig. 2a, b). The accept-ance criteria were fulfilled by 68,610 microarray probes (Hyb-high-confidency set, see Fig. 1), of which 49.1 % were in the same orientation as the transcriptome v.3 unigenes, in accordance with the expected strand ran-domness of the unigenes. Next, we analyzed unigenes for which the probe signal intensity ratio was not less than two but below four (Fig. 2c, d). We identified 18,134 such cases (Hyb-low-confidency set, see Fig. 1), of which 50.8 % were in the same orientation as the transcriptome v.3 contigs.
We also compared the hybridization-based and homol-ogy-based predictions. A. thaliana protein matches were available for 43,532 unigenes from the Hyb-high-confi-dency set and for 7345 unigenes from the Hyb-low-con-fidency set. Homology predictions identified the same coding strand as the hybridization-based approach, for 98.37 and 91.23 % of them, respectively. We concluded that the hybridization-based approach allowed us to predict the coding strand with high accuracy and that both Hyb-high-confidency and Hyb-low-confidency sets were composed of reliable data. In summary, we defined the coding strand for an additional 32,930 unigenes, with no homology-based predictions. Altogether, both approaches (homology-based and hybridization-based) defined the correct orientation of 79.6 % of the v.3 con-tigs. Whenever the two methods resulted in contradic-tory predictions, we chose the coding strand from the homology data.
Determination of the sense cDNA strand in N. benthamiana transcriptome v.5 contigs
by increasing the amount of sequenced data and combin-ing four de novo assemblers (TransAbyss, Trinity, SOAP-denovo-Trans, and Oases). This approach generated much longer sequence assemblies (with a mean length 1674 bp). The new transcriptome consists of 49,818 pri-mary transcripts (representative models, usually with the longest sequence) and 184,708 alternative transcripts (cDNA isoforms other than in the primary set). We com-pared v.5 primary transcripts with sequences from the Homology-v.3 set, high-confidency set and Hyb-low-confidency set and selected those without any signif-icant matches. We then used their translated sequences in a homology search against A. thaliana proteins, as described above. As a result, we supplemented our data-set with 9017 additional contigs, derived from transcrip-tome v.5, for which the coding strand could be inferred by homology (Homology-v.5 set, see Fig. 1).
Nb‑105k microarray design and gene expression analysis
The four sets of sequences with defined orientations (Homology-v.3, Homology-v.5, Hyb-high-confidency and Hyb-low-confidency) were used to create the final microarray (Fig. 1). The Nb-105k microarray includes 103,747 oligonucleotide probes representing N.
bentha-miana contigs and 1325 standard Agilent positive and
negative controls. The performance of the new micro-array was verified by comparing the gene expression in leaves vs roots of N. benthamiana plants. High qual-ity data were obtained using four biological repli-cates (see “Methods” section). By applying restrictive filters (including a mean intensity, Amean, of at least 6,
an FDR-corrected p value < 0.0005, and a relative dif-ference in expression of at least fourfold), we obtained 6643 probes that indicated differential gene expression with a high level of confidence. Of these, 4478 showed
Transcriptome v.3
119,014 unigenes
blastx search against A. thaliana proteins
Homology-v.3 set
61,800 congs
244k test microarray
Hyb-high-confidency set
68,610 congs
43,532 in common; 98.37% agreement of
strand orientaon
Hyb-low-confidency set
18,134 congs
7,345 in common; 91.23% agreement of
strand orientaon
Transcriptome v.5
49,8181 primary transcripts
blastn search
24,793 congs not found in v.3
blastx search against A. thaliana proteins
Homology-v.5 set 9,017 congs
a
61,800 congs
7,852 congs 9,017 congs
Nb-105k
MICROARRA
Y
FINAL DESIGN
25,078 congs
Homology-v.3 set
Hyb-high-confidency set
Hyb-low-confidency set
Homology-v.5 set
redundancy removed
b
up-regulation and 2165 showed down-regulation in leaves.
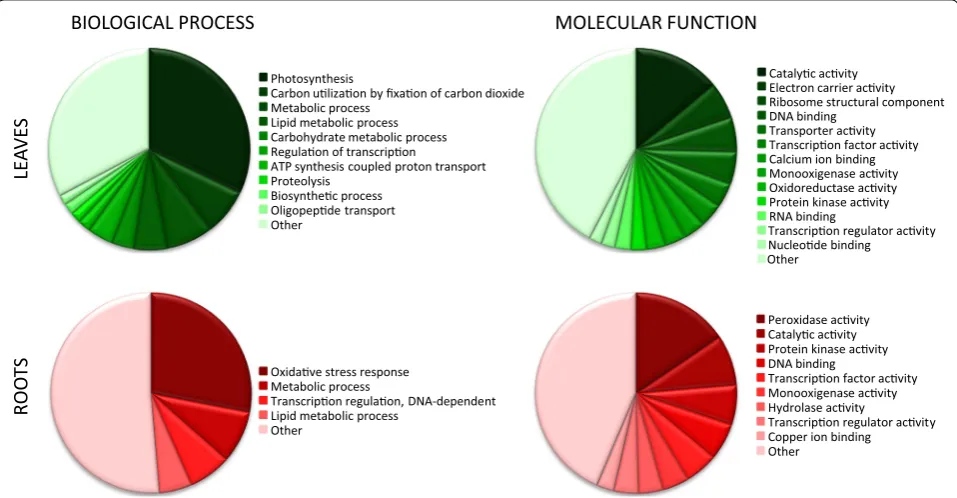
We used available Gene Ontology (GO) information for rapid verification of the biological contents within the differentially expressed gene sets (Fig. 3). GO annotations were available for 22 % of the genes that were up-regulated in leaves. The main categories in this set encompassed genes involved in photosynthe-sis-related processes and functions. Among the genes that showed up-regulation in roots, 19 % possessed GO annotations. The main biological process repre-sented in this dataset was the stress-response, and the main represented molecular function was peroxidase activity. Based on these analyses, we concluded that the Nb-105k microarray was able to correctly reflect the transcriptome specificities in the two organs under study.
Verification of v.5 contig assembly using gene expression data generated with Nb‑105k microarray
The Nb-105k microarray was designed to contain one probe per contig. However, a comparison of the two tran-scriptome versions found that multiple v.3 unigenes (from 2 to 173) matched the same v.5 primary transcript. One example was the v.5 primary transcript Nbv5tr6241943, matched by 63 v.3 unigenes, each represented by an indi-vidual microarray probe. Nbv5tr6241943 is annotated as Ribulose bisphosphate carboxylase (RuBisCO) small chain 8B. The respective v.3 unigenes covered the whole range of its length (Additional file 1: Figure S2A) and possessed various functional annotations (mostly anno-tated as RuBisCO chains: 1, 2A, 2B, 3, 3B, 8B). In our microarray experiment, all were up-regulated in leaves (20–317 times, Additional file 1: Figure S2B) and all but one fulfilled the restrictive statistical significance criteria.
0 10 20 30 40 50 60
70 Reverse complement
Original
0 10 20 30 40 50 60
70 Reverse complement
Original 0
10 20 30 40 50 60
70 Original
Reverse complement
0 10 20 30 40 50 60
70 Original
Reverse complement
[ yti
sn
etni
la
ngi
s e
bor
p×
10
3]
[ yti
sn
etni
la
ngi
s e
bor
p×
10
3]
probe signal intensity
[×
10
3]
probe signal
intensity
[×
10
3]
Rao ≥ 4
Rao ≥ 2
Rao ≥ 4
Rao ≥ 2
a
c
b
d
Fig. 2 Detection of the sense strand in v.3 unigenes by hybridization to the 244k microarray. The signal intensities of probes representing each contig in both orientations were compared, and the probe with the stronger signal was defined as the sense one. a, b Probes selected for the Hyb‑ high‑confidency set, with an intensity ratio ≥4 and an identical (a) or reverse complement (b) orientation relative to the v.3 unigene sequence; c, d
probes selected for the Hyb‑low‑confidency set, with an intensity ratio ≥2, but less than 4 and an identical (c) or reverse complement (d) orienta‑
However, another cluster of 17 v.3 unigenes displayed variability in expression levels even though all of them matched the same v.5 primary transcript Nbv5tr6230285. Close inspection of Nbv5tr6230285 sequence, which is annotated as Uncharacterized RNA methyltransferase pc1998, revealed that it is probably a chimeric contig. Its 5′ end matches a conserved protein domain found in the AdoMet-dependent methyltransferases superfam-ily (which is encoded in open reading frame +3) and its 3′ end matches a domain of protease HtpX (which is encoded in open reading frame −3) (Additional file 1: Figure S3A). The mapping and relative orientations of v.3. unigenes (that had their coding strands defined by homology searches and hybridization to the 244k test microarray) clearly revealed that only the 3′ part of the Nbv5tr6230285 contig belongs to the gene that is up-regulated in leaves (Additional file 1: Figure S3B). When used in this manner, the gene expression data obtained with the Nb-105k microarray may also aid the improve-ment of N. benthamiana transcriptome annotation.
Discussion
Despite the increasing availability of genomic and tran-scriptomic data for many species, the need for bioinfor-matics skills and access to large computational resources often result in the pool of “big data” being unused by biol-ogists. Gene expression microarrays are relatively easy to explore, even by non-expert users. Dedicated databases
(e.g., Genevestigator, Plant Expression Database) pro-vide access to integrated microarray data from multiple sources and experiments, allowing intra- and interspe-cies comparisons. Here, we described a N. benthamiana
gene expression microarray (Nb-105k microarray) which reflects the current, advanced state of knowledge regard-ing the N. benthamiana genome and transcriptome. Based on our experience, commercial microarrays for plants that either have not been sequenced or do not have fully annotated genomes (e.g., Agilent Tobacco 4 × 44k or Barley 4 × 44k gene expression microarrays, which are based on 2004–2008 sequence releases) typically include multiple probes that have the incorrect orienta-tion and, as a consequence, do not produce useful data [40, Goralski et al., unpublished]. In the present work, we used a combination of bioinformatics and experimental approaches to detect the sense orientation of the con-tigs prior to designing the probes. We defined the cod-ing strand for 66.4 % of v.3 transcriptome unigenes uscod-ing homology searches and for 81.3 % of v.3 transcriptome unigenes using RNA hybridization to the test microarray. The latter approach provided substantially more data and did not require sequence homology to known proteins. The efficiency of this simple, hybridization-based verifi-cation was demonstrated by the high level of agreement of outputs generated by the two methods. Ultimately, we defined the sense strand orientation of 97,667 contigs from v.3 transcriptome (82.1 %). Apart from the direct
Other Photosynthesis
Carbon ulizaon by fixaon of carbon dioxide Metabolic process
Lipid metabolic process Carbohydrate metabolic process Regulaon of transcripon
ATP synthesis coupled proton transport Proteolysis
Biosynthec process Oligopepde transport
LE
AV
ES
RO
OT
S
BIOLOGICAL PROCESS MOLECULAR FUNCTION
Protein kinase acvity RNA binding Catalyc acvity Electron carrier acvity Ribosome structural component DNA binding
Transporter acvity Transcripon factor acvity Calcium ion binding Monooxigenase acvity Oxidoreductase acvity
Nucleode binding Transcripon regulator acvity Other
Oxidave stress response Metabolic process
Transcripon regulaon, DNA-dependent Lipid metabolic process
Other
Peroxidase acvity Catalyc acvity Protein kinase acvity DNA binding
Transcripon factor acvity Monooxigenase acvity Hydrolase acvity
Transcripon regulator acvity Copper ion binding Other
application for the Nb-105k microarray design purposes, the data we obtained will serve as a useful guide for future users of this transcriptome dataset.
Our carefully designed microarray consists of nearly 104,000 probes targeting N. benthamiana transcripts from de novo assemblies of Seq data. As the RNA-Seq libraries were prepared from samples representing mixed tissues, the Nb-105k microarray based on these data can be considered a versatile gene expression tool. Indeed, we observed its high sensitivity in detecting and distinguishing the regulation of genes expressed in roots and leaves of N. benthamiana plants. The micro-array is mainly based on transcriptome v.3 [33], but we also included additional unique sequences from the more recent transcriptome v.5 [34]. The latter version con-sists of smaller number of contigs that are much larger, as they were assembled from the combination of multi-ple assemblies and include more short-read data. For this reason, some of the microarray probes derived from v.3 unigenes may map to the same primary transcript from v.5. As shown in the present study, a comparison of the expression profiles generated with such probes allows for additional experimental verification of the transcriptome assemblies. To this end, the Nb-105k microarray usage can be extended from simple gene expression analysis to increasing the accuracy and completeness of the cur-rent and future N. benthamiana transcriptomes. On the other hand, the future improvement of N. benthamiana
genome and transcriptome will likely enable re-designing of the Nb-105k microarray, for example to include probes discriminating between paralogous sequences. (The cur-rent version of our microarray was not tested for dis-criminating between highly similar sequences).
In conclusion, we provided details on the design of an oligonucleotide microarray that reflects the cur-rent advanced state of N. benthamiana transcriptome research. This, in turn, will allow the N. benthamiana
research community to take full advantage of microarray techniques for studies of gene expression in this plant.
Methods Plant material
Nicotiana benthamiana plants were planted on Jiffy
pel-lets and transferred to pots with soil after 2 weeks. The plants were grown in growth chambers at 22 °C/20 °C (day/night). Two sets of samples were prepared for two stages of our experiment, as follows. For detecting the coding strand using hybridization-based approach we collected roots, leaves, and stems from: 4-week old healthy plants, 10-week old healthy plants, 6-week old plants infected with peanut stunt virus, 6-week old plants infected with tomato torrado virus, 6-week old plants
wounded mechanically, 6-week old plants wounded by whitefly Trialeurodes vaporariorum. For the analysis of gene expression we collected leaves and roots from four independent 6-week old plants (leaves/roots from one plant constituted one biological replicate). All the mate-rial was frozen in liquid nitrogen.
RNA extraction and labeling
Total RNA was extracted using RNeasy Plant Mini Kit QIAGEN) and DNase-digested with TURBO DNA-free kit (Ambion), according to the manufacturers’ standard protocols. RNA quality was determined using Nanodrop 2000 spectrophotometer and capillary electrophoresis in 2100 Bioanalyzer (Agilent). All samples were of high quality, with A260/A280 ≥ 2 and no visible signs of
deg-radation when analyzed on a capillary electrophoresis gel. For hybridization-based coding strand prediction the frozen plant material samples were mixed in equal amounts before RNA extraction (“pooled sample”). For gene expression analysis total RNA was extracted from one plant at a time, (leaves and roots separately), con-stituting a biological replicate: “L1”, “L2”, “L3”, “L4” and “R1”, “R2”, “R3”, “R4”. Labeled cRNA samples were pre-pared from 200 ng RNA, using a Quick Amp Labeling Kit (Agilent) and quality-checked on a Nanodrop 2000 spectrophotometer.
Homology searches of transcriptome v.3 unigenes
Nicotiana benthamiana unigenes (transcriptome v.3)
were downloaded from a server at the School of Molecu-lar Bioscience [40]. Each sequence was used as a query in a BLASTX homology search against the A. thaliana
reference protein set, with e-value threshold set at 0.001. The best A. thaliana hit was then used to check and, if needed, correct the orientation of the query sequences. Whenever the orientation of A. thaliana protein match-ing strand was opposite to the N. benthamiana sequence (Plus/Minus or Minus/Plus), the latter was converted into its reverse-complement counterpart.
Design of the 244k test microarray
Hybridization and analysis of the 244k test microarray
Cy3- and Cy5-labeled cRNA obtained from the same “pooled sample” was hybridized to one 244k test micro-array in A1 × 244K hybridization chamber (Tecan)
on a HS 4800 Pro automatic station (Tecan), accord-ing to the manufacturer’s guidelines regardaccord-ing Agilent microarrays treatment. A Gene Expression Hybridiza-tion Kit (Agilent) and Gene Expression Wash Buffer Kit solutions (Agilent) were used for the hybridization and washing steps, respectively. The intensity data were col-lected with 4200AL GenePix scanner and processed with GenePix Pro 6.1 software using morphological open-ing background method. Followopen-ing a quality check with background intensity plotting functions and background subtraction step (“subtract,” offset = 10), implemented
in R/Bioconductor limma package [41] the intensity data collected for the Cy3 and Cy5 channels were plot-ted against each other. They demonstraplot-ted a high linear correlation (R2 = 0.955). Therefore, only the data for the
Cy5 channel were used in the subsequent comparison of the signal intensities of paired probes (see the Results section). The intensity date were further compared in Microsoft Excel 2010.
Homology searches of transcriptome v.5 primary transcripts
Nicotiana benthamiana primary transcripts
(transcrip-tome v.5) were downloaded from a server at the School of Molecular Bioscience [40]. To compare v.3 and v.5 transcriptomes and to supplement our dataset with the contigs missing from the v.3 assembly, we used each v.3 contig of a previously defined strand orientation to query the v.5 dataset with BLASTN. Matches with an e-value <0.001, a gap opening penalty of 6 and a gap extension penalty of 2 were considered significant. With such parameters, the identity level of successfully aligned sequences exceeded 90 % in 93.9 % of the cases tested. The remaining v.5 sequences (those without matches in v.3 dataset) were used as queries in a BLASTX homol-ogy search against the A. thaliana reference protein set, with an e-value threshold set at 1,E-03 and strand orien-tation identified as described in the “Homology searches of transcriptome v.3 unigenes” section.
Design of the Nb‑105k microarrays
The sense probes (60-mers) were designed for each tran-script from Homology-v.3, Homology-v.5, Hyb-high-confidency and Hyb-low-Hyb-high-confidency sets on an Agilent eArray platform. The same four datasets were also com-bined into a reference transcriptome. This reference tran-scriptome was used by the Agilent software for design purposes, to ensure maximum specificity of the probes towards their targets. The microarrays in 2 × 10⁵k
format (two microarrays per slide) were then purchased from Agilent.
Hybridization and analysis of the Nb‑105k microarrays
Cy3- and Cy5-labeled cRNA from leaves and roots of N.
benthamiana plants were hybridized to Nb-105k
micro-arrays in the following dye-swap design: Cy3-“L1” ver-sus Cy5-“R2”, Cy3-“L2” verver-sus Cy5-“R3”, Cy3-“R4” verver-sus Cy5-“L3” and Cy3-“R1” versus Cy5-“L4”. The hybridiza-tion was performed in A2 × 105K hybridization cham-bers (Tecan) on a HS 4800 Pro (Tecan) automatic station, according to the manufacturer’s guidelines regarding Agilent microarrays treatment. A Gene Expression Hybridization Kit (Agilent) and Gene Expression Wash Buffer Kit solutions (Agilent) were used for the hybridi-zation and washing steps, respectively. The intensity data were collected with 4200AL GenePix scanner and processed with GenePix Pro 6.1 software using morpho-logical opening background method. The data were then analyzed with standard analysis pipeline implemented in R/Bioconductor limma package [41], as described pre-viously [42, 43]. Briefly, the background was subtracted from the probe intensity data. The normalization steps involved “loess” within array normalization and “Aquan-tile” between array normalization. Quality plots (‘MA-plot” and “density (‘MA-plot”) were generated to evaluate the data normalization performance and assess the micro-array data accuracy and dynamic range. The analysis of Agilent Spike-in controls was also performed and con-firmed that the generated data well reflected the theoreti-cal Cy5/Cy3 RNA ratios across a broad range of template copy numbers. The pre-processed data were used for differential expression analysis by applying a Bayesian linear model. The significance threshold was set at a p
value <0.0005 (after applying Benjamini and Hochberg’s method to control the false discovery rate), a mean inten-sity (Amean) >6 and at least a fourfold relative expression
difference between roots and leaves. Gene Ontology annotations of v.3 transcripts were the same as used in [38]. Raw and normalized gene expression data from this experiment were deposited into the NCBI GEO reposi-tory [44] and are accessible via a GEO Series accession number GSE76631.
Microarray probe mappings and availability
(according to the results of sense strand identification performed in the current study), the contig ID has an RC_prefix. To download the original Agilent design files, with probe sequences or to order the Nb-105k microar-ray, go to https://earray.chem.agilent.com/earray/ then click the “Published Designs” link button on the right and select N. benthamiana from the species list.
The final microarray probes were also mapped to tran-scriptomes v.3 and v.5 to provide the links between two transcriptomes datasets. For this, each probe sequence was used as a query in a megablast similarity search against a local database created for a transcriptome v.3 or v.5, transcriptome, respectively, with the following parameters: e-value <0.0001, word size = 7, 65 % iden-tity, no masking for low complexity sequences. Best hit for each search was reported in Additional file 2: Table S1 in addition to the primary targets (those for which the probes were designed).
Abbreviations
RNA‑Seq: RNA sequencing; GEO: gene expression omnibus; GO: gene ontol‑ ogy; RuBisCO: ribulose bisphosphate carboxylase.
Authors’ contributions
AZ and MF conceived the study. AZ designed the microarrays. AOS provided plant material. MG performed RNA isolation and labeling. MG and PS per‑ formed hybridization experiments. MG, PS and AZ analyzed the data. AS and PS performed homology searches. AZ wrote the manuscript. AZ and PS pre‑ pared figures. MG, AS, AOS and MF helped to draft the manuscript. All authors read and approved the final manuscript.
Author details
1 Institute of Bioorganic Chemistry, Polish Academy of Sciences, Noskowsk‑ iego 12/14, 61‑704 Poznan, Poland. 2 Institute of Plant Protection – National Research Institute, Wladyslawa Wegorka 20, 60‑318 Poznan, Poland. 3 Institute of Computing Science, Poznan University of Technology, Piotrowo 2, 60‑965 Poznan, Poland.
Acknowledgements
We thank Kenlee Nakasugi for providing GO annotation data for v3 tran‑ scriptome dataset. The research was supported by National Science Center Grants 2012/05/B/ST6/03026 and 2011/03/B/NZ9/01577. The publication was supported by the Polish Ministry of Science and Higher Education, under the KNOW program.
Competing interests
The authors declare that they have no competing interests.
Received: 17 January 2016 Accepted: 10 May 2016
Additional files
Additional File 1: Figure S1. Proportions of array‑based (blue) and high throughput sequencing‑based (orange) RNA profiling experiments deposited in GEO Database in 2012‑2015 for Arabidopsis and rice. Figure S2. Gene expression data for v.3 unigenes mapping v.5 primary transcript Nbv5tr6241943. Figure S3. Gene expression data for v.3 unigenes map‑ ping v.5 primary transcript Nbv5tr6230285.
Additional File 2: Table S1. Targets of Nb‑105k microarray probes in Transcriptomes v.3 and v.5.
References
1. Dinneny JR, Long TA, Wang JY, Jung JW, Mace D, Pointer S, et al. Cell iden‑ tity mediates the response of Arabidopsis roots to abiotic stress. Science. 2008;320:942–5.
2. Tohge T, Fernie AR. Co‑expression and co‑responses: within and beyond transcription. Front Plant Sci. 2012;3:248.
3. Zhang W, Luo J, Chen F, Yang F, Song W, Zhu A, et al. BRCA1 regulates PIG3‑mediated apoptosis in a p53‑dependent manner. Oncotarget. 2015;6:7608–18.
4. Mantione KJ, Kream RM, Kuzelova H, Ptacek R, Raboch J, Samuel JM, et al. Comparing bioinformatic gene expression profiling methods: microarray and RNA‑Seq. Med Sci Monit Basic Res. 2014;20:138–42.
5. Garber M, Grabherr MG, Guttman M, Trapnell C. Computational methods for transcriptome annotation and quantification using RNA‑seq. Nat Methods. 2011;8:469–77.
6. Gregg C, Zhang J, Weissbourd B, Luo S, Schroth GP, Haig D, et al. High‑ resolution analysis of parent‑of‑origin allelic expression in the mouse brain. Science. 2010;329:643–8.
7. McGettigan PA. Transcriptomics in the RNA‑seq era. Curr Opin Chem Biol. 2013;17:4–11.
8. Oshlack A, Robinson MD, Young MD. From RNA‑seq reads to differential expression results. Genome Biol. 2010;11:220.
9. Richard AC, Lyons PA, Peters JE, Biasci D, Flint SM, Lee JC, et al. Compari‑ son of gene expression microarray data with count‑based RNA measure‑ ments informs microarray interpretation. BMC Genom. 2014;15:649. 10. Ritchie ME, Silver J, Oshlack A, Holmes M, Diyagama D, Holloway A, et al. A
comparison of background correction methods for two‑colour microar‑ rays. Bioinformatics. 2007;23:2700–7.
11. Wang C, Gong B, Bushel PR, Thierry‑Mieg J, Thierry‑Mieg D, Xu J, et al. The concordance between RNA‑seq and microarray data depends on chemi‑ cal treatment and transcript abundance. Nat Biotechnol. 2014;32:926–32. 12. Zhao S, Fung‑Leung WP, Bittner A, Ngo K, Liu X. Comparison of RNA‑Seq
and microarray in transcriptome profiling of activated T cells. PLoS ONE. 2014;9:e78644.
13. Bejjani BA, Shaffer LG. Clinical utility of contemporary molecular cytoge‑ netics. Annu Rev Genomics Hum Genet. 2008;9:71–86.
14. Zhang C, Li HR, Fan JB, Wang‑Rodriguez J, Downs T, Fu XD, Zhang MQ. Profiling alternatively spliced mRNA isoforms for prostate cancer clas‑ sification. BMC Bioinform. 2006;7:202.
15. Zhu M, Deng X, Joshi T, Xu D, Stacey G, Cheng J. Reconstructing differen‑ tially co‑expressed gene modules and regulatory networks of soybean cells. BMC Genom. 2012;13:437.
16. Giegé P, Sweetlove LJ, Cognat V, Leaver CJ. Coordination of nuclear and mitochondrial genome expression during mitochondrial biogenesis in Arabidopsis. Plant Cell. 2005;17:1497–512.
17. Li L, Wang X, Sasidharan R, Stolc V, Deng W, He H, et al. Global identifica‑ tion and characterization of transcriptionally active regions in the rice genome. PLoS ONE. 2007;2:e294.
18. Żmieńko A, Guzowska‑Nowowiejska M, Urbaniak R, Pląder W, Formano‑ wicz P, Figlerowicz M. A tiling microarray for global analysis of chloroplast genome expression in cucumber and other plants. Plant Methods. 2011;7:29.
19. Muir P, Li S, Lou S, Wang D, Spakowicz DJ, Salichos L, Zhang J, Wein‑ stock GM, Isaacs F, Rozowsky J, Gerstein M. The real cost of sequencing: scaling computation to keep pace with data generation. Genome Biol. 2016;17:53.
20. Obrępalska‑Stęplowska A, Wieczorek P, Budziszewska M, Jeszke A, Renaut J. How can plant virus satellite RNAs alter the effects of plant virus infec‑ tion? A study of the changes in the Nicotiana benthamiana proteome after infection by peanut stunt virus in the presence or absence of its satellite RNA. Proteomics. 2013;13:2162–75.
21. Obrępalska‑Stęplowska A, Renaut J, Planchon S, Przybylska A, Wieczorek P, Barylski J, et al. Effect of temperature on the pathogenesis, accumula‑ tion of viral and satellite RNAs and on plant proteome in peanut stunt virus and satellite RNA‑infected plants. Front Plant Sci. 2015;6:903. 22. Lukhovitskaya NI, Cowan GH, Vetukuri RR, Tilsner J, Torrance L, Savenkov
EI. Importin‑α‑mediated nucleolar localization of potato mop‑top virus TRIPLE GENE BLOCK1 (TGB1) protein facilitates virus systemic movement, whereas TGB1 self‑interaction is required for cell‑to‑cell movement in
• We accept pre-submission inquiries
• Our selector tool helps you to find the most relevant journal
• We provide round the clock customer support
• Convenient online submission
• Thorough peer review
• Inclusion in PubMed and all major indexing services
• Maximum visibility for your research
Submit your manuscript at www.biomedcentral.com/submit
Submit your next manuscript to BioMed Central
and we will help you at every step:
23. Margaria P, Miozzi L, Rosa C, Axtell MJ, Pappu HR, Turina M. Small RNA pro‑ files of wild‑type and silencing suppressor‑deficient tomato spotted wilt virus infected Nicotiana benthamiana. Virus Res. 2015;208:30–8. 24. Dadami E, Boutla A, Vrettos N, Tzortzakaki S, Karakasilioti I, Kalantidis K.
DICER‑LIKE 4 but not DICER‑LIKE 2 may have a positive effect on potato spindle tuber viroid accumulation in Nicotiana benthamiana. Mol Plant. 2013;6:232–4.
25. Lee S, Yang DS, Uppalapati SR, Sumner LW, Mysore KS. Suppression of plant defense responses by extracellular metabolites from Pseudomonas
syringae pv. tabaci in Nicotiana benthamiana. BMC Plant Biol. 2013;13:65.
26. Meng F, Altier C, Martin GB. Salmonella colonization activates the plant immune system and benefits from association with plant pathogenic bacteria. Environ Microbiol. 2013;15:2418–30.
27. Rivas‑San Vicente M, Larios‑Zarate G, Plasencia J. Disruption of sphin‑ golipid biosynthesis in Nicotiana benthamiana activates salicylic acid‑ dependent responses and compromises resistance to Alternaria alternata
f. sp. lycopersici. Planta. 2013;237:121–36.
28. Ramegowda V, Senthil‑Kumar M, Ishiga Y, Kaundal A, Udayakumar M, Mysore KS. Drought stress acclimation imparts tolerance to Sclerotinia
sclerotiorum and Pseudomonas syringae in Nicotiana benthamiana. Int J
Mol Sci. 2013;14:9497–513.
29. Goodin MM, Zaitlin D, Naidu RA, Lommel SA. Nicotiana benthamiana: its history and future as a model for plant‑pathogen interactions. Mol Plant Microbe Interact. 2008;21:1015–26.
30. Rifkin SA, Kim J, White KP. Evolution of gene expression in the Drosophila
melanogaster subgroup. Nat Genet. 2003;33:138–44.
31. Bigger CB, Brasky KM, Lanford RE. DNA microarray analysis of chim‑ panzee liver during acute resolving hepatitis C virus infection. J Virol. 2001;75:7059–66.
32. Schenk PM, Thomas‑Hall SR, Nguyen AV, Manners JM, Kazan K, Spangen‑ berg G. Identification of plant defence genes in canola using Arabidopsis cDNA microarrays. Plant Biol (Stuttg). 2008;10:539–47.
33. Becher M, Talke IN, Krall L, Krämer U. Cross‑species microarray transcript profiling reveals high constitutive expression of metal homeostasis genes in shoots of the zinc hyperaccumulator Arabidopsis halleri. Plant J. 2004;37:251–68.
34. Bar‑Or C, Bar‑Eyal M, Gal TZ, Kapulnik Y, Czosnek H, Koltai H. Derivation of species‑specific hybridization‑like knowledge out of cross‑species hybridization results. BMC Genom. 2006;7:110.
35. Bar‑Or C, Novikov E, Reiner A, Czosnek H, Koltai H. Utilizing microar‑ ray spot characteristics to improve cross‑species hybridization results. Genomics. 2007;90:636–45.
36. Bombarely A, Rosli HG, Vrebalov J, Moffett P, Mueller LA, Martin GB. A draft genome sequence of Nicotiana benthamiana to enhance molecular plant‑microbe biology research. Mol Plant Microbe Interact. 2012;25:1523–30.
37. Naim F, Nakasugi K, Crowhurst RN, Hilario E, Zwart AB, Hellens RP, Taylor JM, Waterhouse PM, Wood CC. Advanced engineering of lipid metabo‑ lism in Nicotiana benthamiana using a draft genome and the V2 viral silencing‑suppressor protein. PLoS ONE. 2012;7:e52717.
38. Nakasugi K, Crowhurst RN, Bally J, Wood CC, Hellens RP, Waterhouse PM. De novo transcriptome sequence assembly and analysis of RNA silencing genes of Nicotiana benthamiana. PLoS ONE. 2013;8:e59534.
39. Nakasugi K, Crowhurst R, Bally J, Waterhouse P. Combining transcriptome assemblies from multiple de novo assemblers in the allo‑tetraploid plant
Nicotiana benthamiana. PLoS ONE. 2014;9:e91776.
40. School of Molecular Bioscience, The University of Sydney. http://sydney. edu.au/science/molecular_bioscience/sites/benthamiana/downloads. php. Accessed 09 May 2014.
41. Limma Smyth GK. linear models for microarray data. In: Gentleman R, Carey V, Dudoit S, Irizarry R, Huber W, editors. Bioinformatics and compu‑ tational biology solutions using R and bioconductor. New York: Springer; 2003. p. 397–420.
42. Zmienko A, Samelak‑Czajka A, Goralski M, Sobieszczuk‑Nowicka E, Kozlowski P, Figlerowicz M. Selection of reference genes for qPCR‑ and ddPCR‑based analyses of gene expression in senescing barley leaves. PLoS ONE. 2015;10:e0118226.
43. Zmienko A, Goralski M, Samelak‑Czajka A, Sobieszczuk‑Nowicka E, Figle‑ rowicz M. Time course transcriptional profiling of senescing barley leaves. Genom Data. 2015;4:78–81.