Optimization of CVT Pulley Quenching Process Through
Quenching Simulation
Koichi Taniguchi* - Shunzo Umegaki - Kanji Ueno
Jatco Ltd, Imaizumi, Fuji, Japan
The address order global environmental issues have prompted the automobile industry to significantly improve the fuel consumption of vehicles. In order to provide better fuel consumption, continuously variable transmissions (CVT) have been increasingly adopted year by year, in place of conventional step type automatic transmission (StepAT). A CVT consists of both belts and pulleys and production of the pulleys requires precise dimensional accuracy. However, corrective adjustments following heat treatment have been inevitable since the carburizing and quenching process causes bending distortions of the pulley. A large amount of time and man-hours have been spent on trial-and-error to determine the heat treatment conditions that minimize these distortions. For this reason, the development of a quenching simulation, which makes it possible to determine optimal heat treatment conditions through theoretical study, is currently underway. The intention of this study is to improve the accuracy of this simulation through restructuring the simulation models based on the actual measurement of cooling curves.
© 2009 Journal of Mechanical Engineering. All rights reserved.
Keywords: pulley, bending distortion, heat treatment, quenching, simulation
0 INTRODUCTION
Due to the growing demand to reduce CO2
emissions and improve fuel consumption, the transition from StepAT to CVTs, which are efficient in fuel consumption, has been accelerated. Unlike conventional transmissions, a CVT consists of pulleys and steel belts and can change speeds in a steeples fashion. The pulleys are the main components of this transmission mechanism. Since production of the parts requires precise dimensional accuracy, the bending distortions caused by the carburizing and quenching process means that corrective adjustment following the heat treatment is inevitable. In order to minimize these bending distortions, a large amount of time and man-hours have been used to study conditions as production trials have been repeated to determine optimal quenching conditions.
On the other hand, with the rise of IT technologies, several research institutes and companies have reported application examples of the quenching simulation Taniguchi et al. [5]. We are also working on the development of bending distortion prediction methods through utilizing the quenching simulation [5]. We have been conducting research to establish a method of distortion prediction through restructuring simulation models based on the results of
quenching experiments and then applying this method to the production process. This paper describes the processes and the results of this development.
1 QUENCHING SIMULATION
A simple description of distortion calculation steps for the quenching simulations used at present are shown below.
Step 1: The cooling rate during quenching is determined from the thermal conductivity of the steel and quenching oil.
Step 2: The phase transformation and hardness are determined from the cooling rate. Step 3: In order to determine the total distortion,
the heat contraction amount is determined from the cooling rate, and the expansion amount from the phase transformation.
As shown above, the distortion is determined from the combined amount of the heat contraction during the cooling process and the expansion caused by the phase transformation Inoue et al [3] in this simulation. Therefore, it becomes essential to input the following three items.
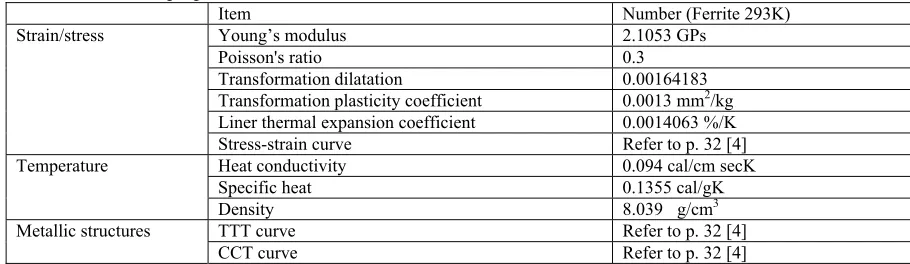
Table 1. Materials properties
Item Number (Ferrite 293K)
Young’s modulus 2.1053 GPs
Poisson's ratio 0.3
Transformation dilatation 0.00164183 Transformation plasticity coefficient 0.0013 mm2/kg
Liner thermal expansion coefficient 0.0014063 %/K Strain/stress
Stress-strain curve Refer to p. 32 [4]
Heat conductivity 0.094 cal/cm secK
Specific heat 0.1355 cal/gK
Temperature
Density 8.039 g/cm3
TTT curve Refer to p. 32 [4]
Metallic structures
CCT curve Refer to p. 32 [4]
- The thermal conductivity between the
quenching agent and steel that determines the cooling rate.
- Surface area division of the FEM model that
can correctly reproduce the temperature changes during the quenching process.
- Steel material properties such as the
expansion coefficient during phase transformation.
1.1 Material Properties
In this paper, the steel material properties of SCr420H quoted from the report from the VHT-project Virtual Heat Treatment tool for monitoring and optimizing HT processes [4] were used for the calculation. Table 1 shows the steel material property items that are necessary for the quenching simulation.
1.2 Heat Transfer Coefficient
For oil quenching it is necessary to take measurements by quenching tests since the heat transfer coefficient depends on the shape of the part and also changes drastically during quenching. Heat transfer coefficients are calculated from cooling curves. Figure 1 shows the cooling curve for one of the typical quenching oils (JIS No. 1, Class1) [2]. Cooling proceeds from a high temperature through three processes in sequence. These processes, in order, are the vapor blanket stage (A), boiling stage (B) and convection stage (C).
In the vapor blanket stage, a slow cooling rate is shown as the surface of the part is covered by a vapor film. In the boiling stage, a fast cooling rate is shown as the boiling prompts heat transfer and the quenching proceeds.
The inclination of the cooling curve (heat transfer coefficient) drastically changes at point D, the point at which the transition from the vapor blanket stage to the boiling stage occurs. The temperature of point D is termed the "characteristic temperature" and represents one of the performances of the quenching oil. It is essential to determine the characteristic temperature accurately in order to improve the accuracy of this simulation. In this study, we aimed at improving the accuracy of the simulation by measuring the actual cooling curves at each part of the pulley and determining the characteristic temperatures.
Fig. 1. Cooling curve (Quenching oil)
1.3Area Division of FEM Model
L2 80
L1 L3
100
A-id
B-id
Sheave
Shaft bottom
Shaft top
Glass plate
Video camera
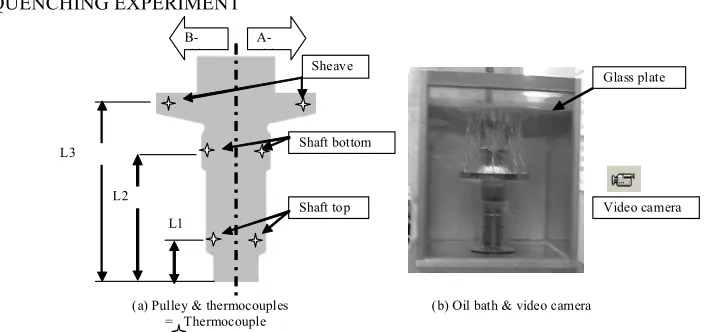
(a) Pulley & thermocouples (b) Oil bath & video camera
= Thermocouple
process of the vapor blanket collapse, as well as to estimate the heat transfer coefficient. Since measuring the temperature is not sufficient for understanding the process of the vapor blanket collapse and as the shape of the CVT pulley is especially complicated, we decided to conduct an actual quenching process experiment. We used an observable oil bath for the quenching experiment. Not only was the temperature measured but the collapse of the vapor blanket was also observed with the use of images. As a result, the area division of the FEM model was able to more accurately reproduce the actual phenomenon.
1.4Calculation Method
Similar to the earlier application examples, the purpose of this quenching simulation is to calculate the distortion caused by heat stress and stresses attributed to phase transformations. Remaining stress caused by plastic forming and creep deformation caused by exposure to high temperatures has been excluded. In order to prevent FEM calculation errors from affecting the distortion calculation results, the FEM mesh was symmetrically constructed along the axis. The conditions for expansion/contraction and transformation characteristics of the steel are uniformly applied to the entire portion of the part.
2 QUENCHING EXPERIMENT
2.1 Experimental Method
In order to observe the collapse of the vapor blanket and changes in temperature, an observable oil bath was used for the quenching experiment.
Fig. 2 shows the thermocouples (a) and oil bath (b) for experiment. As shown in Fig. 2a, two thermocouples with a diameter of 1.6 mm are mounted symmetrically to the Shaft Top, Shaft Bottom and Sheave, for a total of six mounting positions, in order to take the measurements regarding temperature changes. The depth of all mounting positions is 4 mm from the surface. The distances from the shaft end are as follows: L1 = 30 mm, L2 = 80 mm, L3 = 100 mm.
After being heated at 1143 K for one hour in the test furnace (Ar atmosphere), quenching is performed in an oil bath containing JIS No. 1 Class 1 quenching oil at an oil temperature of 313 K. As shown in Fig. 2b, one side of the oil bath consists of a heat-resistant glass plate to allow the observation of the inside of the bath, and the behaviour of the vapour blanket collapse during quenching is filmed using a digital video camera.
During the quenching experiment, the quenching oil is kept static. It is not stirred so that the flow inside the oil bath generated by the heat convection is not disturbed by external factors.
2.2 Experimental Results
Fig. 3 shows the actual cooling curves for the A-side and B-side of the Shaft Top.
Initially, both the A and B-sides are cooled at the same rate; however a difference occurs on the two cooling curves at the circled section. It appears that the circled section is the transition point from the vapor blanket stage to the boiling stage (characteristic temperature).
Fig. 3. Pulley cooling curve (Shaft Top)
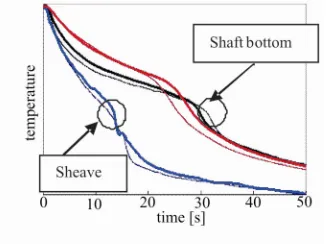
Fig. 4 shows the actual cooling curves. The Shaft Top has a higher characteristic temperature compared to the Sheave and Shaft Bottom. The cooling curves of the Shaft Bottom show that the inclination of the cooling curve changes at around 30 s after the start of quenching. It also shows the transition to the boiling stage.
Fig. 4. Pulley cooling curve
Fig. 5 shows an image of the Shaft Bottom 30 s after the start of quenching. The dotted line indicates the boundary between the vapor blanket stage and the boiling stage. The direction of the arrow indicates the direction in which the collapse advances, and the triangle indicates the origin of collapse. 28 s after the start of quenching, a collapse occurs in the direction diagonally upwards from the origin (the triangle)
at the bottom left, the collapse then ends 32 s after the start. As described above, due to an observable oil bath used in the quenching experiment, two important results shown below were obtained:
1. A temperature difference occurs even between the symmetrically placed measuring points. 2. At any given measuring point, a change in the cooling curve occurred at the characteristic temperature.
Fig. 5. Pulley shaft vapor blanket collapse, end of 30 s
3 SIMULATION MODEL
Fig. 6 shows the simplified diagram describing the vapor blanket collapse shown in the circled section of Fig. 5. The direction of the arrow indicates the direction in which the collapse advances and the triangle indicates the origin of collapse.
The boiling stage starts earlier in the white and gray areas, while the vapor blanket stage lasts longer in the black area. As indicated in the figure, the results of the experiment show that the collapse advances diagonally upwards. It is necessary to use a modelling method with tetrahedral elements to model the collapse advancing diagonally upwards.
Since such modelling methods entail a longer calculation time and have lower accuracy, the progress of collapse needs to be simplified in the simulation model to advance in the direction of the horizontal.
Fig. 8. Simulation boundary condition First collapse side = (■)
Late collapse side = (■)
Uniform collapse area = (□)
A=Sheave, B=Shaft Bottom, C=Shaft Top
A
B
C
Fig.7. Boundary condition (Image) First collapse side = (■)
Late collapse side = ■ Center Axis
Axial
Circumference
first starts, while the black area represents the side where the vapor blanket stage lasts longer.
The direction of the arrow indicates the direction in which the collapse advances and the triangle indicates the origin of collapse. We studied more complex models, however due to the long construction time required for the simulation models and their inadequate prediction accuracy, simple divided model was adopted.
Fig. 8 shows the simulation model for a VT pulley constructed, based on the concepts above. Based on the quenching experiment results, the model was divided at the stepped section into the Shaft Top and Shaft Bottom, Sheave was also divided. With the addition of four sections where the collapse occurs symmetrically, the model is ultimately divided into ten sections. The white area represents the area in which the collapse occurs symmetrically.
4 SIMULATION RESULT
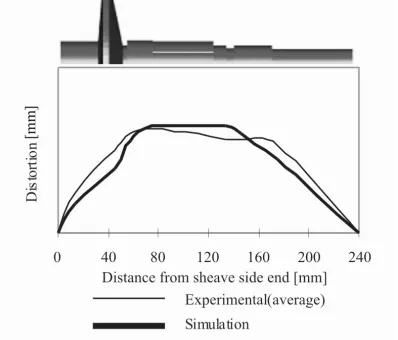
Fig. 9 shows the comparison of the simulation results for bending distortion and actual measurements. The thin line represents the mean value of the actual measurements obtained from the quenching experiment and the thick line represents the simulation results.
Comparing the data for both, it appears that the mean values of the experiment results have nicely reproduced the simulated results. Furthermore, in the comparison of the distortion patterns, both the mean values of the measurements and the calculated values also demonstrate a favourable fit, which indicates that the distortions occur on the boundaries between the Shaft Top and Shaft Bottom as well as between the Shaft Bottom and Sheave.
From the results described above, the simulation method that reproduces the distortions by applying the proper cooling conditions to the ten sections of the simulation model, which were divided based on the results of this visualizing experiment, can be considered quite effective in the prediction of bending distortions.
Fig. 9. Pulley bending distortion
Fig. 6. Pulley shaft vapor blanket collapse (Image)
Canter Axis
Circumference
5 APPLICATION TO THE PRODUCTION PROCESS
As described in the previous chapter, the CVT pulley quenching simulation made it possible to predict the amount of bending distortion by applying proper cooling conditions to each part of the FEM model and the proper characteristic temperature to the quenching oil.
This time, our intent was to optimize the quenching conditions by utilizing this simulation.
5.1 Quenching Conditions Studied
The variable conditions in the quenching process are agitation, oil bath pressure, oil temperature, quenching temperature and oil type. When assuming an application to the production process using a continuous furnace, the oil temperature, quenching temperature and oil type cannot be changed during the continuous production. Therefore, agitation and oil bath pressure are the subjects of this study. We assumed that agitation affects the vapor blanket collapse and the oil bath pressure affects the transition from the boiling stage to the convection stage since the pressure affects the boiling temperature of the oil. With these assumptions in mind, the cooling model of this simulation was constructed. We referred to the report on the relationship between flow rate, oil bath pressure and changes in the cooling curves (5) for the construction of the cooling model.
Table 2 shows the six patterns of the quenching process studied in this simulation.
The agitation test conditions were provided in three levels (+20%, Base, -20%) since agitation is assumed to greatly affect the collapse of the vapor blanket. The pressure test conditions were provided in two levels (Base, -20%) since the effects of pressure on the distortion is assumed to be smaller, compared to that of agitation.
Table 2. Quenching pattern
Agitation Presser
No. 1 -20% Base
No. 2 Base Base
No. 3 +20% Base
No. 4 -20% -20%
No. 5 Base -20%
No. 6 +20% -20%
5.2 Simulation Results
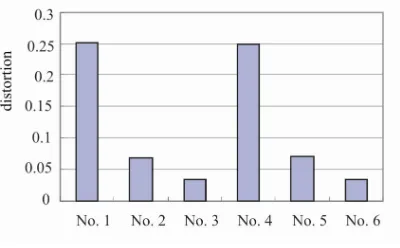
Fig. 10 shows the amount of distortions calculated under conditions No. 1 through No. 6.
From these simulation results, it can be assumed that enhancing agitation is effective in reducing distortions. The effects of quenching with a depressurized oil bath were not confirmed.
Fig. 10. Simulation result
5.3 Preliminary Experiment Results
A preliminary experiment was conducted, based on the above results from the quenching simulation. The conditions under which the experiment was conducted were No. 2, 3 and 6, those assumed to be effective in reducing the distortion.
Fig. 11 shows the comparison of the mean values for the measurements obtained from the experiment and the simulation results. Similar to the simulation results, the results under condition No. 3 show the smallest amount of distortion. According to the preliminary experiment results have nicely reproduced with the simulation results as far as the agitation is concerned, which is shown.
However, the experiment results for condition No. 6 show differences from those of the simulation.
Although, from the simulation results, it was expected that the effects of the oil bath pressure would be small, the experiment results show that depressurizing the oil bath increases the amount of distortion.
5.4 Experiment Results
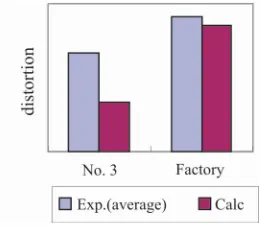
Lastly, we conducted the quenching experiment using 240 pulleys under condition No. 3, in order to confirm the effects of changes in conditions.
Fig. 12 shows both the mean values for the distortion amounts obtained from this experiment using a larger number of test samples and the calculation values from the simulation. The results of this experiment show an increase in the mean value of the distortion amount. However, as confirmed in the preliminary experiment, the improvements in distortion attributed to changes in the agitation conditions were also confirmed.
According to the results described above, it was confirmed through the experiments and simulations that agitation is more effective than oil bath pressure in improving pulley distortions caused by the quenching process.
Fig. 12. Manufacturing result
6 CONCLUSION
In order to reduce the amount of bending distortion occurring in the quenching process, we approached the problem through the development of a quenching simulation method that can reproduce the occurring process and the amount of distortion. As a result of our approaches, we reached the following conclusions.
1. Through this simulation method it became possible to reproduce the distortions
equivalent to the actual phenomena by providing the temperature differences, attributed to the collapse of the vapor blanket as a heat boundary condition to each part of the simulation model.
2. The results of this simulation showed that agitation is more effective as a countermeasure to the distortions than depressurized quenching, and this fact was also confirmed through the reproduction experiment.
The results mentioned above allow us to predict that the simulation can be utilized in optimizing the quenching conditions in the CVT pulley production process in order to minimize the bending distortions.
7 ACKNOWLEDGMENTS
These pulley quenching experiments were conducted in cooperation with Associate Professor Narazaki and Engineering Official Ogasawara at Utsunomiya University.
We would like to express our gratitude for their cooperation.
8 REFERENCES
[1] Arimoto, K., Kim, H., Narazaki, M., Lambert, D., Wu, W. T. Mechanism of Quench Distortion on Steel Shaft with Keyway. Proc. 21st Heat Treating Society
Conf., 5-8.11.01, Indianapolis, ASM Int., Materials Park, OH, 2001, p. 144-151. [2] Ichitani, K. Influence of Cooling Process on
Quenching Distortion. J. Japan Soc. Heat Treat. 42 (2002), p. 341-345.
[3] Inoue, T., Ju, D. Y., Arimoto, K. Metallo-thermo-mechanical Simulation of Quenching Process – Theory and Implementation of Computer Code HEARTS. Proc. Int. Conf. on Quenching and Control of Distortion. vol.1, ASM Int., Materials Park, Ohaio, 1992, p. 205-212.
[4] Okamura, K., Ju, D. Y., Shichino, H. Joint Meeting of JSMS and ISHT on Benchmark Project on Quenching Simulation, 2004, p. 5-8. [5] Taniguchi, K., Ueno, K., Sato, T.