University of New Orleans
ScholarWorks@UNO
University of New Orleans Theses and Dissertations Dissertations and Theses
12-15-2007
Potential Transportation Improvements and Land
Use Impacts in the Elysian Fields Corridor
Caroline Lanford University of New Orleans
Follow this and additional works at:https://scholarworks.uno.edu/td
This Thesis is brought to you for free and open access by the Dissertations and Theses at ScholarWorks@UNO. It has been accepted for inclusion in University of New Orleans Theses and Dissertations by an authorized administrator of ScholarWorks@UNO. The author is solely responsible for ensuring compliance with copyright. For more information, please contactscholarworks@uno.edu.
Recommended Citation
Lanford, Caroline, "Potential Transportation Improvements and Land Use Impacts in the Elysian Fields Corridor" (2007).University of New Orleans Theses and Dissertations. 644.
Potential Transportation Improvements and Land Use Impacts
in the Elysian Fields Corridor
A Thesis
Submitted to the Graduate Faculty of the
University of New Orleans
in partial fulfillment of the
requirements for the degree of
Master of Urban and Regional Planning
by
Caroline Elizabeth Lanford
B.A. Newcomb College, Tulane University, 2000
Table of Contents
List of Figures ... iii
List of Tables ... iv
Abstract ...v
Chapter 1 Introduction...1
Observations ...2
Problem ...3
Proposed Solution ...3
Research Questions...3
Hypothesis...3
Methodology ...4
Summary ...5
Chapter 2 Existing and Historical Conditions...6
Demographic Data ...6
Neighborhoods, Land Use, and Community Facilities...15
Overview of Existing Plans ...32
Existing Bicycle and Pedestrian Environment...33
Existing and Pre-Katrina Bus Service...34
Chapter 3: Transit Technology Evaluation...36
Traditional Bus Transit ...36
Bus Rapid Transit (BRT) ...37
Light Rail Transit (LRT)...39
Streetcars...41
Alternatives ...42
Express Bus Alternative...43
BRT Alternative...66
LRT Alternative ...32
Streetcar ...78
Estimated Capital Costs ...79
Estimated Operating and Maintenance (O&M) Costs ...79
Chapter 4: Literature Review...84
Introduction...84
Literature Review...84
Findings...98
Chapter 5: Land Use and Economic Analysis and Conclusion...99
Introduction...99
Station Location Selection ...100
Station Area Impact Analysis ...100
General Discussion of Potential Economic Effects ...105
Demand ...107
Feasibility Analysis...108
Summary of Findings...111
References ...114
List of Figures
Figure 2-1 Study Area...6
Figure 2-2 Neighborhoods ...7
Figure 2-3 Flood Depths August 31, 2005...15
Figure 2-4 Existing Land Use District 6 (1999) ...22
Figure 2-5 Existing Land Use District 7 (1999) ...26
Figure 2-6 Existing Land Use District 2 (1999) ...29
Figure 2-7 Existing Land Use District 1 (1999) ...31
Figure 3-1 New Orleans RTA Traditional Bus Vehicle ...36
Figure 3-2 Las Vegas MAX BRT Vehicle ...39
Figure 3-3 Houston METRO LRT Vehicle ...40
Figure 3-4 RTA Streetcar Vehicle ...42
Figure 3-5 BRT Alternative Typical Section...45
Figure BRT 1 ...47
Figure 3-6 BRT Alternative Center Platform Typical Section ...48
Figure BRT 2 ...49
Figure BRT 3 ...51
Figure BRT 4 ...52
Figure BRT 5 ...54
Figure BRT 6 ...56
Figure BRT 7 ...58
Figure BRT 8 ...59
Figure BRT 9 ...61
Figure BRT 10 ...62
Figure LRT 1...67
Figure LRT 2...68
Figure LRT 3...69
Figure LRT 4...70
Figure LRT 5...71
Figure LRT 6...72
Figure LRT 7...73
Figure LRT 8...74
Figure LRT 9...75
List of Tables
Table 2-1 Year 2000 Population and Race ...9
Table 2-2 Age Distribution in Year 2000 ...10
Table 2-3 Median Household Income in 1999 ...11
Table 2-4 Per Capita Income in 1999 ...11
Table 2-5 Poverty Status in 1999...12
Table 2-6 Educational Attainment for Persons over the Age of 25 ...13
Table 2-7 Zero Vehicle Households in 2000 ...14
Table 2-8 RTA Routes with the Highest Monthly Ridership Numbers May 2005 ...34
Table 2-8 RTA Routes with the Highest Monthly Ridership Numbers May 2007 ...35
Table 3-1 BRT Running Time Calculations ...64
Table 3-2 LRT Running Time Calculations ...78
Table 3-3 Comparative Costs for Selected BRT, Streetcar, and LRT Systems...79
Table 3-4 BRT Costs Estimates...81
Table 3-5 LRT Costs Estimates ...82
Table 4-1 LRT Comparison of Most Populous Bus Only Cities in 1996 to Rail Cities Size and Performance Data...88
Abstract
This study examines potential transportation improvements in the Elysian Fields Avenue Corridor, and the benefit that these improvements may produce. Data for the study area are compiled and analyzed. Conceptual plans for the implementation of different transit technology alternatives were developed and assessed in terms of user benefits, cost, potential land use impacts, potential economic impacts, and feasibility. Case studies and relevant literature are reviewed. The intent of this thesis is to provide an overview of the study area prior and
subsequent to Hurricane Katrina, develop plans for the implementation of transit alternatives in the Elysian Fields Avenue Corridor, and assess potential costs and benefits of the different alternatives developed.
Chapter 1: Introduction
The City of New Orleans, Louisiana is in a transitory state. The population and urban fabric of the city are constantly changing. An initial, gradual return to the city occurred in the months following Hurricane Katrina. Some of the pre-Katrina population has no intention of returning; others are unable to return due to unsettled or inadequate insurance settlements, the lack of affordable rental housing, inadequate infrastructure, and numerous other barriers. A new population of persons associated with the business of rebuilding has come to the city, the transience or permanence of their residency is unknown. A second exodus from the city is taking place, as residents initially committed to rebuilding the city grow frustrated with the slow pace of rebuilding, high crime rates, and higher rents and energy costs. Meanwhile, the physical rebuilding of the city is occurring in a “patchwork” fashion. In many areas of the city, one or two houses on a block are being repaired, while the rest remain untouched or gutted and boarded. Numerous planning efforts have culminated in a Draft Unified New Orleans Plan, the approval and implementation of which, it is hoped, will accelerate the recovery process.
New Orleans has become a living laboratory for planners, engineers, architects, developers, and civil servants. One of America’s greatest cultural resources will be lost if these efforts fail. This study seeks to build upon recent reports chronicling the needs of the city and the “best” way to solve these problems. Continuing a discussion publicly initiated by the Bring New Orleans Back Commission, this study examines the potential for transportation infrastructure improvements to guide and stimulate redevelopment in damaged areas of the city. The Elysian Fields Avenue corridor and alternative transit improvements that could encourage redevelopment in the Gentilly area is the focus of this study.
As concerns increase about the contribution of personal automobiles to global warming and the sustainability of continued dependence on fossil fuels, improvements to mass transit are
necessary to plan for a sustainable New Orleans. Improving transit service in the city is both progressive and historically sensitive, as New Orleans has traditionally had a more extensive transit system than most comparable American cities, as well as a larger transit-dependent population.
Prior to August 2005, the Gentilly area was one of the most diverse and stable neighborhoods in New Orleans. Planning District 6, which covers the Gentilly area, had higher household income levels and home-ownership rates than the City of New Orleans as a whole (New Orleans City Planning Commission 1999: 149). The former stability of the neighborhood adds to its attractiveness for redevelopment.
Elysian Fields Avenue is a north-south primary arterial roadway extending approximately five miles from the Mississippi River to Lake Ponchartrain. The southern terminus of Elysian Fields forms the boundary of the historic Vieux Carre (French Quarter) and Faubourg Marigny districts. Elysian Fields Avenue terminates at a traffic circle at Lakeshore Drive, an east-west roadway paralleling Lake Ponchartrain in the Gentilly area of New Orleans.
Hurricane Katrina. However, at the northern and southern termini of Elysian Fields Avenue there are islands of relatively little damage. These two islands, the Vieux Carre/Faubourg Marigny area and the University of New Orleans (UNO), are also major trip generators for a potential transit system. There are several other potential trip generators along the Elysian Fields corridor, including Dillard University, UNO Technology Park, and the Lakefront Arena. The combination of existing major trip generators and large areas in need redevelopment provide an ideal corridor for induced transit-oriented development.
From the river to Gentilly Boulevard, more than half of its length, Elysian Fields Avenue is six lanes. At Gentilly Boulevard, it transitions to four lanes to its terminus at Lakeshore Drive. With the exception of the portion of the route at Interstate 10 (I-10) between North Miro and
Abundance Streets, Elysian Fields Avenue has a very wide median (neutral ground). The typical section of Elysian Fields Avenue provides ample right-of-way that could be reconstructed to accommodate other transportation modes.
There is a need for transportation improvements in the Elysian Fields corridor. At this time, public transportation services available in the New Orleans Metropolitan Area have been reduced as a result of Hurricane Katrina. The Regional Transit Authority (RTA) is operating with a fraction of its pre-Katrina budget, fleet, and staff. Prior to Hurricane Katrina, two routes operated on Elysian Fields Avenue, a local route and an express service. Currently, only the local service has been re-established with significantly longer headways.
This study seeks to provide an analysis of transit alternatives and their potential to impact redevelopment in the Elysian Fields Avenue corridor. In order to evaluate the redevelopment potential of the corridor, baseline conditions in the corridor are established in Chapter 2. An overview of existing and historical conditions, including demographics, land uses, community and cultural resources, and transportation infrastructure is provided. Chapter 2 also describes existing and on-going planning efforts in the corridor. Chapter 3 evaluates different transit technologies that could be applied in the corridor, including the characteristics of traditional and express bus service, bus rapid transit (BRT), streetcar, and light rail transit (LRT). A description of alternatives for the application of these transit technologies is also provided in Chapter 3, along with preliminary cost estimates for implementation. Chapter 4 reviews selected literature relevant to the subject. An evaluation of potential land use and economic impacts for each alternative is provided in Chapter 5. This evaluation includes an analysis of station area impacts and transit-oriented development potential.
The following text presents the research question for this thesis, in terms of observations made, the problem identified, the proposed solution to this problem, research questions and hypotheses concerning the outcome of this research.
Observations
Elysian Fields Avenue local. Using the express service, travel times were upwards of 20 minutes.
Following the events of August 2005, several neighborhoods along the Elysian Fields Avenue corridor were devastated, but at each end anchors of stability, activity, and relatively little damage remained. The damaged neighborhoods are recovering. Some neighborhoods are recovering more quickly than others. Over two years later, throughout the severely damaged neighborhoods there are homes and businesses that appear to not have been touched since the levees failed. Other structures persist in a state of uncertainty, gutted and boarded up.
The neutral ground of Elysian Fields Avenue is very wide due to the fact that it was formerly the location of a passenger rail line. It would be a good location for a rapid transit line. Rapid transit lines have revitalized deteriorating and economically depressed areas and enhanced conditions in growing markets.
Problem
Although it has been discussed before in several planning documents, no real plan exists for transit improvements in the Elysian Fields Avenue corridor.
Proposed Solution
A conceptual plan for transit improvements in the Elysian Fields Avenue corridor will be developed. The potential social, economic and environmental impacts of different transit technology alternatives in the Elysian Fields Avenue corridor will be assessed.
Research Questions
This thesis attempts to answer several research questions. In terms of physical planning and service strategy, how would premium transit services be implemented on Elysian Fields Avenue? What factors contribute to the development of a transit system that successfully achieves user benefits, increases ridership and enhances land development and economic activities? Do different transit technologies vary in their potential to induce land development and economic impacts? Would the development of a premium transit service be feasible in the Elysian Fields Avenue Corridor?
Hypothesis
There is a supposition that trains and streetcars are more attractive than buses (Ben-Akiva and Morikawa: 1). The author challenges the validity of this supposition, particularly when a BRT system includes the critical premium features associated with LRT. There are empirical studies that present evidence to support both views, and these studies are evaluated in the literature review portion of this thesis.
Methodology
To determine the potential benefits that a new rapid transit system may have on the Elysian Fields Avenue corridor, it was first necessary to become familiar with the area. The roadway geometry and land uses were evaluated. The progress of redevelopment and restoration were periodically surveyed between September 2005 and the present. Census 2000 data were gathered and analyzed to provide a demographic profile of the corridor. Because the corridor contains at least twelve distinct and diverse neighborhoods (depending on who you ask), the process for the compilation and presentation of the data needed to be identified.1
It was decided that presentation and analysis of the majority of the data for each of the twelve neighborhoods separately, or by tract or block group, would be excessive, difficult to digest, and would not clearly illustrate demographic trends in different portions of the study corridor. Therefore, the individual tracts and block groups were examined, and similar neighborhoods were grouped together, and referred to as “neighborhood areas.” For example, the area north of I-610 is often locally referred to collectively as “Gentilly,” and is grouped together in this study. Residents of Gentilly may disagree with this grouping due to strong neighborhood identities in the area. The author grants that the portion of Gentilly within the study area contains several diverse neighborhoods with different housing styles and some variance in demographic
characteristics. However, the area is often thought of collectively, as evidenced by the formation of the Gentilly Civic Improvement Association and its grouping as Planning District 6. The Lake Oaks neighborhood may be more “upper-middle class” than other Gentilly neighborhoods, and some portions of the Dillard neighborhood may be more “lower-middle class.” However, these variances balance out to present an accurate compilation of data for this middle-class inner suburb.
Demographic data are presented by neighborhood area as well as the study area as a whole. These data are compared to data for Orleans Parish, Louisiana, and the United States. An overview of each of the twelve neighborhoods, including a brief history, land uses, community facilities, institutions, and housing statistics was compiled.
The obvious limitation of 2000 Census data is that they are historical, and conditions have changed since 2000, particularly since August 2005. In many areas, these changes are
significant. Although many reputable entities such as the Bureau of the Census, the Louisiana Public Health Institute, the United States Postal Service, and GCR and Associates, Inc. have tracked indicators to make current population estimates, these sources were not used. Because the re-population process is dynamic, it was determined to assess the repopulation of
1
neighborhoods on a qualitative basis. Visual surveys were periodically conducted to gauge repopulation and redevelopment.
Planning reports for each of the neighborhoods and the city as a whole were consulted. These included plans that existed prior to August 2005, such as the City of New Orleans Planning Commission’s 1999 Land-Use Plan, and the numerous planning reports produced following Hurricane Katrina.
A physical plan for a new transit system was developed. This required a review of technical standards and specifications to evaluate the corridor’s physical suitability for the application of various transit technologies and configurations. Case-studies, technical reports, and relevant literature were reviewed and analyzed.
An assessment of land use, economic, and overall impacts for the transit alternatives was developed, and the feasibility of the alternatives is addressed. This assessment is generally qualitative, but some quantitative methods are applied.
Summary
This study intends to provide an overview of the existing and historic characteristics of the Elysian Fields Avenue corridor. The physical, land-use, transportation, and demographic traits of the neighborhoods adjacent to the corridor are documented herein. These data provide a basis for the analysis of the suitability of the corridor for transportation improvements. Alternative transit improvements were developed and evaluated in terms of cost, aesthetics,
Chapter 2: Existing and Historical Conditions
Demographic Data
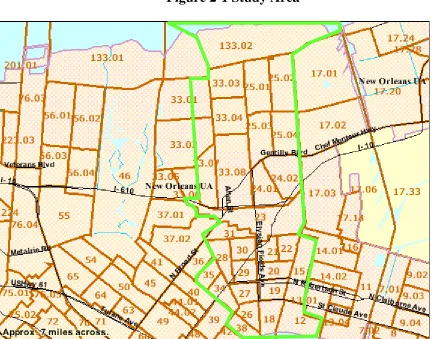
The study area is defined as shown on Figure 2-1 below.
Figure 2-1 Study Area
Source: United States Department of Commerce, Bureau of the Census, outline added by author
The area north of Interstate 610 (I-610) is composed of many neighborhoods, including: a portion of Lake Oaks (Census 2000 tract 133.02, block group 1), St. Anthony (Census 2000 tracts 33.03 and 33.04), Milneburg (Census 2000 tracts 25.01 and 25.02), Gentilly Terrace (Census 2000 tracts 24.01, 24.02, 25.03, and 25.04), Dillard (Census tracts 33.07 and 33.08) and a portion of Filmore (Census 2000 tract 33.01, block group 1 and Census 2000 tract 33.02, block group 1). This area is referred to collectively as “Gentilly.”
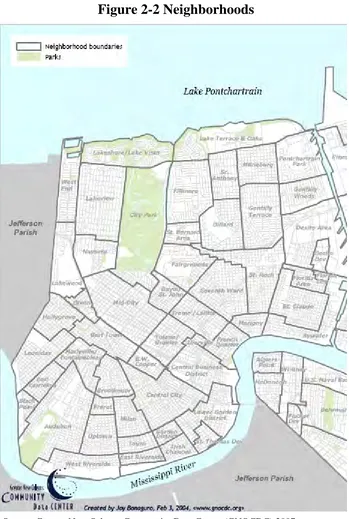
Figure 2-2 Neighborhoods
Source: Greater New Orleans Community Data Center (GNOCDC) 2007
Figure 2-2 provides a map of New Orleans neighborhoods in the vicinity of the study area. These neighborhoods are unique and diverse; therefore, study area data is presented as a whole, as well as by individual neighborhood areas composed of the Census divisions described above.
margins of error in Orleans Parish. The dynamic nature of the recovery precludes reliable population estimates and projections, and it is likely that accurate population figures will not be available until the Census Bureau conducts an enumeration in 2010. Census 2000 data are presented as part of this project, despite significant population changes, due to the lack of statistically reliable demographic data and the varying nature of the population. Careful
consideration was given to the data presented, and the most recent, appropriate, and reliable data available were used in the discussion of existing conditions in the study area.
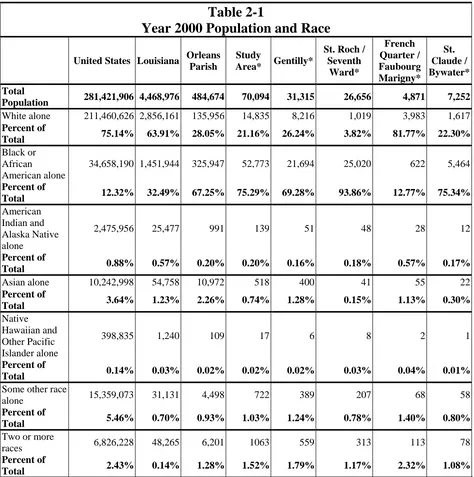
Table 2-1 provides the year 2000 statistics for the total population and racial composition of the United States, the State of Louisiana, Orleans Parish, the entire study area, and the portions of neighborhoods included in the study area, as described on page 6.
The total population of the study area in 2000 was 70,094 persons, which is approximately 14.46% of the total population of Orleans Parish in 2000. As shown in Table 1-1, Orleans Parish, the study area, and the portions of neighborhoods within the study area, have a higher percentage of African-Americans than the state and the nation as a whole. The study area is predominantly black: 75.29% of the total population of the study area in the year 2000 was African-American. However, within the individual neighborhoods the racial composition is more diverse. The Gentilly neighborhoods included in the study area are primarily black (69.28%), but there is a also a large white population (26.24%). The portions of the Faubourg Marigny and the French Quarter in the study area have a much larger white population than the other neighborhoods, composed of 81.77% white. By contrast, the portion of the St. Roch / Seventh Ward neighborhoods included in the study area were 94.61% black in the year 2000.
Table 2-1
Year 2000 Population and Race
United States Louisiana Orleans Parish
Study
Area* Gentilly*
St. Roch / Seventh Ward* French Quarter / Faubourg Marigny* St. Claude / Bywater* Total
Population 281,421,906 4,468,976 484,674 70,094 31,315 26,656 4,871 7,252
White alone 211,460,626 2,856,161 135,956 14,835 8,216 1,019 3,983 1,617
Percent of
Total 75.14% 63.91% 28.05% 21.16% 26.24% 3.82% 81.77% 22.30%
Black or African American alone
34,658,190 1,451,944 325,947 52,773 21,694 25,020 622 5,464
Percent of
Total 12.32% 32.49% 67.25% 75.29% 69.28% 93.86% 12.77% 75.34%
American Indian and Alaska Native alone
2,475,956 25,477 991 139 51 48 28 12
Percent of
Total 0.88% 0.57% 0.20% 0.20% 0.16% 0.18% 0.57% 0.17%
Asian alone 10,242,998 54,758 10,972 518 400 41 55 22
Percent of
Total 3.64% 1.23% 2.26% 0.74% 1.28% 0.15% 1.13% 0.30%
Native Hawaiian and Other Pacific Islander alone
398,835 1,240 109 17 6 8 2 1
Percent of
Total 0.14% 0.03% 0.02% 0.02% 0.02% 0.03% 0.04% 0.01%
Some other race
alone 15,359,073 31,131 4,498 722 389 207 68 58
Percent of
Total 5.46% 0.70% 0.93% 1.03% 1.24% 0.78% 1.40% 0.80%
Two or more
races 6,826,228 48,265 6,201 1063 559 313 113 78
Percent of
Total 2.43% 0.14% 1.28% 1.52% 1.79% 1.17% 2.32% 1.08%
Source: U.S. Bureau of the Census, Census 2000, Summary File 1 (SF1) 100-Percent Data, Table P3 Race – Universe: Total Population. Compiled by author, percentages calculated by author.
Notes: * Area composed of Census divisions as described on page 6 of this document.
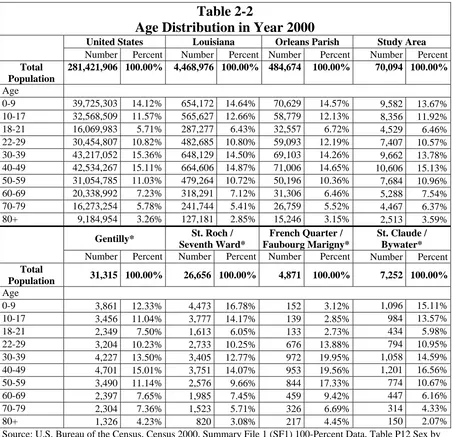
(3.12%), while the portions of St. Roch / Seventh Ward included in the study area had a high percentage of children under the age of ten (16.78%).
Table 2-2
Age Distribution in Year 2000
United States Louisiana Orleans Parish Study Area
Number Percent Number Percent Number Percent Number Percent
Total Population
281,421,906 100.00% 4,468,976 100.00% 484,674 100.00% 70,094 100.00%
Age
0-9 39,725,303 14.12% 654,172 14.64% 70,629 14.57% 9,582 13.67%
10-17 32,568,509 11.57% 565,627 12.66% 58,779 12.13% 8,356 11.92%
18-21 16,069,983 5.71% 287,277 6.43% 32,557 6.72% 4,529 6.46%
22-29 30,454,807 10.82% 482,685 10.80% 59,093 12.19% 7,407 10.57%
30-39 43,217,052 15.36% 648,129 14.50% 69,103 14.26% 9,662 13.78%
40-49 42,534,267 15.11% 664,606 14.87% 71,006 14.65% 10,606 15.13%
50-59 31,054,785 11.03% 479,264 10.72% 50,196 10.36% 7,684 10.96%
60-69 20,338,992 7.23% 318,291 7.12% 31,306 6.46% 5,288 7.54%
70-79 16,273,254 5.78% 241,744 5.41% 26,759 5.52% 4,467 6.37%
80+ 9,184,954 3.26% 127,181 2.85% 15,246 3.15% 2,513 3.59%
Gentilly* St. Roch / Seventh Ward*
French Quarter / Faubourg Marigny*
St. Claude / Bywater*
Number Percent Number Percent Number Percent Number Percent
Total
Population 31,315 100.00% 26,656 100.00% 4,871 100.00% 7,252 100.00%
Age
0-9 3,861 12.33% 4,473 16.78% 152 3.12% 1,096 15.11%
10-17 3,456 11.04% 3,777 14.17% 139 2.85% 984 13.57%
18-21 2,349 7.50% 1,613 6.05% 133 2.73% 434 5.98%
22-29 3,204 10.23% 2,733 10.25% 676 13.88% 794 10.95%
30-39 4,227 13.50% 3,405 12.77% 972 19.95% 1,058 14.59%
40-49 4,701 15.01% 3,751 14.07% 953 19.56% 1,201 16.56%
50-59 3,490 11.14% 2,576 9.66% 844 17.33% 774 10.67%
60-69 2,397 7.65% 1,985 7.45% 459 9.42% 447 6.16%
70-79 2,304 7.36% 1,523 5.71% 326 6.69% 314 4.33%
80+ 1,326 4.23% 820 3.08% 217 4.45% 150 2.07%
Source: U.S. Bureau of the Census, Census 2000, Summary File 1 (SF1) 100-Percent Data, Table P12 Sex by Age – Universe: Total Population. Compiled by author, percentages calculated by author.
Notes: * Area composed of Census divisions as described on page 6 of this document.
Table 2-3
Median Household Income in 1999
United States $41,994
Louisiana $32,566
Orleans Parish $27,133
Study Area* $21,380
Gentilly^ $31,932
St. Roch / Seventh Ward * $16,040
French Quarter / Faubourg Marigny * $21,981
St. Claude / Bywater* $20,778
Source: U.S. Bureau of the Census, Census 2000, Summary File 3 (SF3) Sample Data, Table P53 Median Household Income in 1999 (Dollars) – Universe: Households.
Notes: * Median calculated by author by determining the median of the Census tracts included in the geographic area as described on page 1-1 of this document.
^ Median calculated by author by calculating the median of the Census tracts and block groups included in the “Gentilly” geographic area as described on page 6 of this document.
As shown in Table 2-3, median household income in the study area as a whole is lower than the figures for Orleans Parish, Louisiana, and the United States. However, the median household income for the Gentilly area was higher than median household income for Orleans Parish and Louisiana. Median household income in the St. Roch / Seventh Ward portion of the study area was significantly less than the figures for the United States, Louisiana, Orleans Parish, and the entire study area. The range of median household income statistics in the study area suggests there were diverse economic conditions within the study area in 1999.
Per capita income figures for the nation, state, Orleans Parish, the study area and neighborhood areas are presented in Table 2-4.
Table 2-4
Per Capita Household Income in 1999
United States $21,587
Louisiana $16,912
Orleans Parish $17,258
Study Area* $17,450
Gentilly^ $18,554
St. Roch / Seventh Ward * $9,742
French Quarter / Faubourg Marigny * $31,152
St. Claude / Bywater* $18,767
Source: U.S. Bureau of the Census, Census 2000, Summary File 3 (SF3) Sample Data, Table P82 Per Capita Income in 1999 (Dollars) – Universe: Total Population.
Notes: * Area composed of Census divisions as described on page 6 of this document.
^ Per capita income for the study area calculated by author by determining the mean of the per capita income figures for each neighborhood area in the study area.
The range of per capita incomes presented in Table 2-4 also indicates differing economic
conditions among the neighborhoods in the study area. Per capita income in the entire study area was slightly higher than the figures for Orleans Parish and Louisiana. Per capita income in the French Quarter / Faubourg Marigny area in 2000 was $31,152, significantly higher than the figures for the study area, parish, state, and the nation. The per capita income statistic for the French Quarter / Faubourg Marigny area is higher than the median household income figure for the same area: generally, median household income statistics are higher than per capita statistics for the same area. This may be explained by the way the two statistics are calculated and the smaller population of persons under the age of 15 living in French Quarter / Faubourg Marigny area .2
The Census Bureau uses income thresholds that vary by family size to determine poverty. If the total income of a family is less than the threshold, then that family and every individual in it is considered in poverty (U.S. Census Bureau 2007). Table 2-5 provides poverty statistics for the nation, state, parish, the study area, and the neighborhood areas within the study area.
Table 2-5
Poverty Status in 1999
Total Income in 1999 below poverty level
Percent of Total
United States 273,882,232 33,899,812 12.38%
Louisiana 4,334,094 851,113 19.64%
Orleans Parish 468,453 130,896 27.94%
Study Area 64,321 17,983 27.96%
Gentilly* 30,518 5,042 16.52%
St. Roch / Seventh Ward* 26,408 10,078 38.16%
French Quarter / Faubourg Marigny* 4,680 923 19.72%
St. Claude / Bywater* 7,171 2,940 41.00%
Source: U.S. Department of Commerce, Bureau of the Census, Census 2000, Summary File 3 (SF3) Sample Data, Table P87 Poverty Status in 1999 – Universe: Population for whom Poverty Status is determined. Percentages calculated by author.
Notes: * Area composed of Census divisions as described on page 6 of this document.
The percentage of persons determined to be living in poverty in the study area is similar to the percentage for Orleans Parish as a whole, significantly greater than the state-wide statistic, and over twice as much as the nation-wide figure. The range of the percentage of persons
determined to be living in poverty in the study area supports the evidence that there are diverse economic conditions within the study area. All of the neighborhood areas, with the exception of
2
Gentilly, have percentages of persons living in poverty that are greater than both the nation-wide and state-wide figures.
The economic data presented in Tables 2-3, 2-4, and 2-5 provide insight into the complex economic conditions present in the study area in 1999. The French Quarter / Faubourg Marigny area had the highest per capita income and the second highest median household income
statistics in the study area 1999. At the same time, it was determined that 19.72% of the population of this area lived in poverty. In this particular neighborhood, individuals with very high-incomes live alongside persons with very low incomes. This is a condition that exists throughout much of the City of New Orleans. There are areas of the city, and the study area, where poverty and wealth are concentrated. Areas of concentration become more apparent when these economic statistics are examined at the block group and block levels. Within the study area, the highest income statistics are found at the northern and southern edges of the study area: adjacent to Lake Ponchartrain in the Lake Terrace and Lake Oaks neighborhoods and in the French Quarter. Conversely, the lowest income areas are concentrated near the interstate
facilities (I-10 and I-610) located in the center of the project area in the St. Roch / Seventh Ward neighborhoods.
Table 2-6 presents information on levels of educational attainment for persons over twenty-five years of age for the nation, the state, Orleans Parish, the study area, and the individual
neighborhood areas within the study area.
Table 2-6
Educational Attainment for Persons over the Age of 25
United States Louisiana Orleans Parish Study Area
Number Number Number Number
Total 182,211,639 Percent 2,775,468 Percent 300,568 Percent 44,612 Percent
High School or Higher^ 146,496,014 80.40% 2,076,416 74.81% 224,486 74.69% 32,656 73.20%
Bachelor's Degree or Higher 44,462,605 24.40% 519,778 18.73% 77,407 25.75% 9,195 20.61%
Gentilly* St. Roch / Seventh Ward *
French Quarter / Faubourg Marigny*
St. Claude / Bywater*
Number Number Number Number
Total 20,373 Percent 15,626 Percent 4,217 Percent 4,396 Percent
Completed High School or
Higher^ 16,618 81.57% 9,499 60.79% 3,711 88.00% 2,828 64.33% Bachelor's Degree or Higher 5,295 25.99% 1,330 8.51% 1,779 42.19% 791 17.99% Source: U.S. Department of Commerce, Bureau of the Census, Census 2000, Summary File 3 (SF3) Sample Data, Table P37 Sex by Educational Attainment for the Population 25 Years and Over – Universe: Population 25 years and over. Compiled by author. Percentages calculated by author.
Notes: * Area composed of Census divisions as described on page 6 of this document. ^Includes high school equivalency.
The percentage of persons over the age of twenty-five in the study area that have completed high school or higher education is similar to the percentage for Orleans Parish and the State of
persons over twenty-five in the Gentilly area who have completed high school or higher and a bachelor’s degree or higher is greater than the nation-wide percentages, as well as the state-wide and parish-wide percentages. The high level of educational attainment in the Gentilly area may be explained by the proximity of the area to several institutions of higher learning. The French Quarter / Faubourg Marigny area has the highest levels of educational attainment, with 42.19% of the population over 25 having obtained a Bachelor’s degree or higher. This is the highest percentage of all of the neighborhood groups, and is significantly higher than the statistics for the nation, state, parish and study area. By contrast, the level of educational attainment in the St. Roch / Seventh Ward area is significantly lower than the figures for the nation, state, parish and study area.
The large number of persons living in the New Orleans area without access to personal vehicles became apparent to the nation during the 2005 hurricane season. Table 2-7 presents statistics for households without personal vehicles for the nation, state, parish, and the study area (in its entirety and by neighborhood divisions) for the year 2000.
Table 2-7
Zero Vehicle Households in 2000
United States Louisiana Orleans Parish
Study
Area Gentilly*
St. Roch / Seventh
Ward
French Quarter / Faubourg Marigny*
St. Claude / Bywater*
Total Occupied
Housing Units 105,480,101 1,656,053 188,251 28,414 12,489 10,008 3,133 2,784
Total No Vehicle
Housing Units 10,861,067 196,305 51,435 8,442 2,054 4,214 1,174 1,000
Percent of Total 10.30% 11.85% 27.32% 29.71% 16.45% 42.11% 37.47% 35.92%
Source: U.S. Department of Commerce, Bureau of the Census, Census 2000, Summary File 3 (SF3) Sample Data, Table H44 Tenure by Vehicles Available – Universe: Occupied Housing Units. Compiled by author. Percentages calculated by author.
Notes: * Area composed of Census divisions as described on page 6 of this document.
As shown in Table 2-7, nearly 30% of the households in the study area in the year 2000 did not have a vehicle, slightly more than the parish-wide statistic and significantly more than the national and state-wide figures. Within the study area, the Gentilly area had the smallest percentage of zero-vehicle households, at 16.45%, which is still significantly higher than the statewide and national statistics. In the other neighborhood areas, the percentage of zero-vehicle households is high (between 35.92% and 42.11%). The high percentage of zero-vehicle
than the benefits. The lower incidence of zero-vehicle households in the Gentilly area may relate to the more suburban nature of the area, which is less pedestrian- and cyclist-oriented.
Neighborhoods, Land Use, and Community Facilities
New Orleans is a city composed of neighborhoods, and each neighborhood in the study area is unique. The neighborhoods described in this document are those recognized by the City of New Orleans. This section provides a brief description of each neighborhood, including major land use patterns and community facilities. Community facilities include schools, parks, libraries, hospitals, churches, and similar facilities. Although neighborhood boundaries are often ambiguous and indistinct, the boundaries shown on the City of New Orleans Planning Commission’s Neighborhoods of New Orleans map were used for purposes of this analysis. Most of these boundaries are consistent with census tract boundaries.
To comprehensively discuss conditions in the study area, conditions prior to Hurricane Katrina as well as existing and emerging conditions are presented.
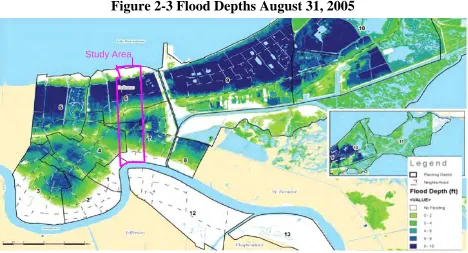
Figure 2-3 illustrates the flood depths in Orleans Parish subsequent to the levee breaches of 2005. The study area has been outlined to demonstrate the range of damage that occurred in the corridor.
Figure 2-3 Flood Depths August 31, 2005
Source: LSU Atlas and GCR & Associates, Inc. in Unified New Orleans Plan. Study Area added by author.
Gentilly
“Gentilly” is a collective term for the area north of I-610 to Lake Ponchartrain, bounded by Bayou St. John to the west and the Industrial Canal to the east, which composes New Orleans Planning Commission Planning District 6. There are several major activity centers in Gentilly, including: the University of New Orleans (UNO), Southern University at New Orleans (SUNO), Dillard University, and the Baptist Theological Seminary, the University of New Orleans
Research and Technology Park, and the Lakefront Arena. Apart from these major activity centers, land use in Gentilly is primarily residential and the urban fabric is typical of a mid-twentieth century inner suburb. Although often referred to collectively, Gentilly is composed of several neighborhoods with distinct characteristics. Each of the Gentilly neighborhoods included in the study area is briefly discussed below.
Lake Oaks
The portion of the Lake Oaks area included in the study area is bounded by Lake Ponchartrain to the north, the London Avenue Canal to the west, Leon C. Simon Boulevard to the south and the Industrial Canal to the east. The UNO campus is the dominant land use in the north-west portion of the study area, and the Lakefront Arena/UNO East Campus is the dominant land use in the eastern portion of the study area. Lake Oaks Park and the UNO Research and Technology Park dominate the north-central portion of the area. There is a commercial area at the intersection of Leon C. Simon Boulevard and Franklin Avenue. The remaining portion of this neighborhood within the study area is composed of the Lake Oaks residential subdivision.
Although the Lake Oaks area is one of the newer sections of the city, the area has an interesting history. The Ponchartrain Railroad (Smokey Mary) was constructed in the 1830’s and ran along Elysian Fields Avenue to connect the Faubourg Marigny to the Lake (GNOCDC 2007a). The construction of the rail line and the Milneburg Pier influenced the development of the lakefront as a resort area with fishing camps, bars, restaurants, and dancehalls (Ibid. 2007). Many of the early jazz legends performed at these entertainment venues (Ibid. 2007).
Prior to the 1930’s, the land occupied by Lake Oaks was marshland. The land that composes Lake Oaks was reclaimed from the lakeshore through pumping and draining by the New Orleans Levee Board and the Works Progress Administration in the 1930’s. The seawall that protects the area from the waters of Lake Ponchartrain and the recreational areas along the lakefront were also constructed during this effort (Ibid. 2007).
Lake Oaks was opened for development in 1964 and is bounded by Elysian Fields Avenue, Music Street and New York Street (GNOCDC 2007a). Homes in Lake Oaks are generally one- and two-storey slab homes on smaller lots. The median year of construction for homes in Lake Oaks is 1967 (U.S. Bureau of the Census 2000: SF3). Lake Oaks had extremely high occupancy and home-ownership rates in 2000 (Ibid. 2000). Of the 325 housing units recorded by the Census, 319, or 98% were occupied (Ibid. 2000). Of the 319 occupied housing units recorded by the Census, 303, or 95% were owner-occupied (Ibid. 2000). All the recorded housing units in the Lake Oaks area were single family, with the exception of a few multi-family developments, and the median value of owner-occupied units in Lake Oaks was $208,500 (Ibid. 2000).
Despite the proximity of Lake Oaks to the London Avenue and the Industrial Canal breaches, there was minimal flooding in the area following Hurricane Katrina because the neighborhood was developed on a man-made ridge. Damage assessments in Lake Oaks generally ranged between twenty and thirty percent, with some homes on the southern edge of the neighborhood assessed as having sustained forty to fifty percent damage (New Orleans City Planning
Commission 2006a). The majority of homes in Lake Oaks appear to be repaired, or under repair, and occupied as of October 2007.
Community facilities in the Lake Oaks area include: UNO, Ben Franklin High School, the Lakefront Arena, Lakeshore Park, Lake Oaks Park, Lutheran Church Missouri Synod, and the Chapel of the Holy Comforter Anglican Church. All of these community facilities have re-opened after Hurricane Katrina, with the exception of the Lakefront Arena, which is still being repaired. The Chapel of the Holy Comforter has become an important community facility in post-Katrina Gentilly, serving as a meeting place for various civic functions.
Milneburg
The Milneburg neighborhood is bounded by Elysian Fields Avenue to the west, Filmore Avenue to the south, Leon C. Simon Boulevard to the north and Peoples Avenue to the east. The area is primarily residential, with some commercial parcels located along Elysian Fields Avenue between Leon C. Simon Boulevard and Filmore Avenue, at the intersection of St. Roch and Prentiss Avenues, and Robert E. Lee Boulevard near Franklin Avenue. Institutional uses in the Milneburg neighborhood include the Milne Boys Home, St. Raphael School and Church, Marian Central Catholic Middle School, and Avery Alexander Elementary School.
Most of the Milneburg area was developed after World War II. The median year of construction for housing units in Milneburg is 1954(U.S. Bureau of the Census 2000: SF3). The majority of housing units in the Milneburg area are single family homes: 18.50% of the housing units in Milneburg are duplexes, and 5.08% are in multifamily developments (Ibid. 2000). Home ownership rates in Milneburg were high, 71.29% of homes were owner-occupied in 2000 (Ibid. 2000). The median value of a home in Milneburg in 2000 was $76,800(Ibid. 2000).
visual evidence (the presence of FEMA trailers, visible construction work) a minority of residents have returned to repair their homes. The majority of the houses in Milneburg were constructed on slab, which are difficult and expensive to raise to the new base flood elevation advisories. The City of New Orleans determined that the majority of the structures in Milneburg were more than 50% damaged. Structures determined to be more than 50% damaged are subject to the new base flood elevation guidelines. New elevation requirements, along with insurance settlement issues, and delays in receiving Road Home grants may be affecting the rate of recovery in the Milneburg area (New Orleans City Planning Commission 2006b).
Community facilities in the Milneburg neighborhood include the Milne Boys Home,
Miltenberger Playground, and a few churches and schools. The Milne Boys Home began in 1933 as a residential facility for troubled and needy boys under the jurisdiction of the City of New Orleans and the Milne Trust. In 1986 the Home discontinued its residential component, and exclusively offered after school, summer and other community programs for boys
(GNOCDC 2007b). The facility has not re-opened since Hurricane Katrina. Avery Alexander Elementary School, a New Orleans Public School, has not re-opened. Marian Central Catholic Middle School has not reopened. St. Raphael Catholic School and Church are under renovation and mass is being held in the gym as of August 2007.
St. Anthony
The St. Anthony neighborhood is bounded by Elysian Fields Avenue, Leon C. Simon Boulevard, Mirabeau Avenue and the London Avenue Canal. The neighborhood was named after St.
Anthony Avenue, which runs through the center of the community. St. Anthony Avenue has a wide median with green space and a bike/walking trail. Land use in St. Anthony is primarily residential. Commercial strips are located along Elysian Fields Avenue near the Leon C. Simon Boulevard and Filmore Avenue intersections. There is also a small commercial area located at Mirabeau and St. Anthony Avenues (New Orleans City Planning Commission 2006c).
The St. Anthony area developed between 1930’s and 1960’s. The median year of construction for housing units in the St. Anthony area is 1953 (U.S. Bureau of the Census 2000: SF3). The St. Anthony area had less single family housing than many other areas in Gentilly: 54.19% of housing units were single family, 32.11% were duplexes, and over 13% of the housing units in St. Anthony were in multifamily complexes (Ibid. 2000). Home ownership rates in St. Anthony were 60.04%, higher than the parish-wide figure of 46.50%, but much lower than most of the surrounding Gentilly neighborhoods. Median home value in St. Anthony was $75,050 in 2000 (U.S. Bureau of the Census 2000: SF3).
An important community facility located in St. Anthony is Our Lady of Lavang Catholic Church (Hoï Ñöùc Meï Lavang) which serves the Vietnamese Catholic community. Our Lady of Lavang was severely damaged in the storm, but has been repaired and reopened. There are three pocket parks in St. Anthony including Eddie Gatto Playground, Filmore Gardens/Dauterive Playspot and Donnelly Playground, which along with the walking trail along St. Anthony provide recreation space for the neighborhood (GNOCDC 2007c).
of water, and the area stayed flooded for several weeks. The City of New Orleans determined that the majority of the structures in St. Anthony were more than 50% damaged (New Orleans City Planning Commission 2006c). Structures determined to be more than 50% damaged are subject to the new base flood elevation guidelines.
As of September 2007, recovery in the St. Anthony neighborhood is slow. A few of the
commercial properties near Leon C. Simon Boulevard and Filmore Avenue have re-opened, and some new businesses have moved in, but many of the commercial structures in St. Anthony are vacant or have been razed. Residents have returned, but the majority of residential structures in the neighborhood remain untouched or gutted and boarded-up.
Filmore
The portion of the Filmore area included in the study area is bounded by the London Avenue Canal to the east, Paris Avenue to the west, Robert E. Lee Boulevard to the north and Virgil Boulevard to the south. This area is composed of the Vista Park and Mirabeau Gardens subdivisions. The majority of the Filmore area is residential, with a small commercial areas located on Robert E. Lee Boulevard at Paris Avenue and at the intersection of Paris and
Mirabeau Avenues. Francis Gregory Junior High School, which includes a large adjacent green space owned by the City of New Orleans, is located in Mirabeau Gardens as well as Mirabeau Park. Jean Gordon Elementary School and Pratt Park are located in Vista Park.
The median year of construction for housing units in Mirabeau Gardens and Vista Park is 1956 (U.S. Bureau of the Census 2000: SF3). The majority of housing units in the Filmore portion of the study area are single family, at 79.84% (Ibid. 2000). Multi-family housing complexes compose 20.16% of the total housing units in Mirabeau Gardens and Vista Park (Ibid. 2000). Homeownership rates were high in the Filmore portion of the study area in 2000, with 74.63% of housing units being owner-occupied (Ibid. 2000). Median home value in the portion of Filmore in the study area was $126,000 in 2000 (Ibid. 2000).
The Filmore area was severely damaged by extensive flooding caused by a breech on the western side of the London Avenue Canal. As of September 2007, some Filmore residents have returned and started repairs. As with many neighborhoods in Gentilly, the majority of structures were constructed on slab and have damage assessments greater than 50% (New Orleans City Planning Commission 2006d). None of the public schools located in the Filmore portion of the study area have re-opened, and the commercial area at Robert E. Lee and Paris Avenue remains closed.
Gentilly Terrace
Clematis Avenue between Gentilly Boulevard and I-610 in the Lower Gentilly and Edgewood Park subdivisions.
Institutional uses in Gentilly Terrace include: Brother Martin Catholic Junior High School, Capdau Junior High School, St. Joseph Central Catholic School, Stuart Bradley Elementary School, and Gentilly Terrace Creative Arts Elementary School. The New Orleans Baptist Theological Seminary is located just east of the study area boundary. The only designated green space in the Gentilly Terrace neighborhood is Union Playspot located at the intersection of St. Roch Avenue and Humanity Street. There are several churches in the Gentilly Terrace neighborhood including: First Church of Our Lord Jesus Christ, Gideon Christian Fellowship, St. Matthew’s Lutheran Church, and St. James Major Catholic Church.
There are several distinct housing styles throughout the Gentilly Terrace neighborhood.
Edgewood Park and Lower Gentilly are generally composed of smaller bungalows and cottages on piers. Within the Gentilly Terrace National Historic District, the architectural styles include: bungalow/craftsman, and colonial revival (Ibid. 2007). Closer to Filmore Avenue many homes are mid-twentieth century slab homes.
The median year of construction for homes in the Gentilly Terrace neighborhood is between 1947 and 1948, although the majority of structures in the Gentilly Terrace Historic District were constructed in the 1930’s (U.S. Bureau of the Census 2000: SF3). Single-family homes
constitute 81.71% of the housing units in Gentilly Terrace, 13.71% are duplexes, and the
reminder are small multi-family complexes of nine units or less (Ibid. 2000). There is a high rate of home-ownership in Gentilly Terrace, with 69.55% owner-occupied housing units. Median housing value in Gentilly Terrace was $87,350 in 2000 (Ibid. 2000).
The Gentilly Terrace neighborhood did not flood as badly as many other areas of Gentilly, because it is centered on a natural ridge. Additionally, homes in the Gentilly Terrace Historic District are built on small hills. However, the area did receive significant storm damage, and the northern and southern limits of the neighborhood sustained floodwaters greater than eight feet. Gentilly Terrace is recovering, although some areas are recovering faster than others. The current occupancy rate in Gentilly Terrace may not be as high as Lake Oaks, but it is higher than Milneburg and St. Anthony. Some commercial properties at Elysian Fields and Gentilly
Boulevard have re-opened. Capdau Junior High School, Brother Martin Catholic Junior High School, and Gentilly Terrace Elementary School have reopened. Edward Hynes Charter School has re-opened at former site of St. James Major School on Gentilly Boulevard. Morton
Elementary School is currently operating on Gentilly Boulevard but will eventually move to a new location.
Dillard
Shopping Center. Once a vibrant commercial area that included a Gus Mayer department store, the Gentilly Shopping Center has gradually declined since the 1960’s. Prior to Hurricane Katrina, the area included Peaches, a locally-owned music store, two national chain drug stores, a national chain video store, various discount stores, a beauty supply store, two fast-food
restaurants, a bakery, and various other retail stores and office space.
Dillard University opened in 1930 and moved to its existing site in 1935. In 2003, Dillard University was listed on the National Register of Historic Places due to its significance in the areas of education and African-American history. Two-hundred and thirty (230) acres, 8 buildings and 1 structure are included in the National Historic District listing (Louisiana Department of Culture, Recreation and Tourism, Division of Historic Preservation 2007b).
There are two large cemeteries in the Dillard Area, Mount Olivet Cemetery and Mausoleum, located on Norman Mayer Avenue, and Hebrew Rest Cemetery, located along Elysian Fields Avenue north of Gentilly Boulevard. Norman Mayer Public Library, located near the
intersection of Elysian Fields and Gentilly Boulevard on Foy Street serves the entire Gentilly area. A United States Post Office is located near the intersection of Elysian Fields Avenue and Gentilly Boulevard on Caton Street. Perry Roehm Park and baseball field is located in the southern area of the Sugar Hill neighborhood. The entrance to Dillard University along Gentilly Boulevard between Norman Mayer Avenue and Virgil Boulevard is maintained as landscaped green space.
The median year of construction for housing units in Dillard is 1954-1955 (U.S. Bureau of the Census 2000: SF3). The majority of homes in Dillard are single family (70.59%), however because of the large number of students residing in the area, 17.05% of housing units in Dillard are part of large multi-family complexes of fifty or more units (Ibid. 2000). Home-ownership rates in Dillard are higher than the parish-wide figure, 56.70% of housing units in Dillard are owner-occupied compared to 46.50% parish-wide (Ibid. 2000). Median housing value in Dillard in 2000 was $71,900 (Ibid. 2000).
Because the Dillard area is located on the Gentilly Ridge, damage in the area due to flooding was less than in surrounding areas. However, the area was significantly damaged and the northern and southern limits of the Dillard area experienced some flooding. Dillard University has re-opened, along with approximately 50% of the retail businesses in the Elysian Fields
Avenue/Gentilly Boulevard area. Norman Mayer Public Library sustained severe roof damage and will not re-open in its previous location. The U.S. Post Office has not re-opened, stating that current customer levels do not warrant re-opening the facility at this time.
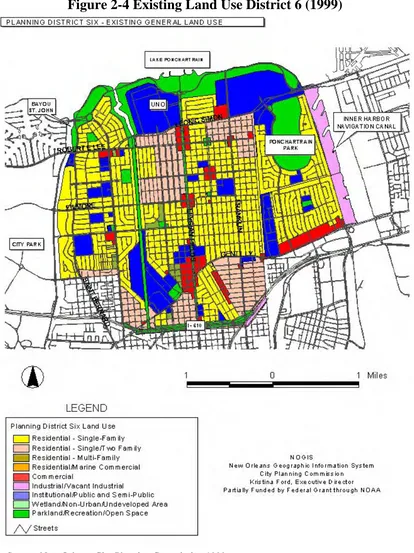
Figure 2-4 Existing Land Use District 6 (1999)
St. Roch
The boundaries of the St. Roch neighborhood included in this study are Benefit Street to the north, Florida Avenue and one block south of Florida Avenue (Treasure, Abundance,
Agriculture, Industry, Duels, and Hope Streets)/Elysian Fields Avenue to the west, St. Claude Avenue to the south, and Almonaster Boulevard/Peoples Avenue to the east. Originally called Faubourg Franklin, the St. Roch neighborhood is included in the New Marigny Historic District, which is roughly bounded by St. Claude Avenue, St. Bernard Avenue, Tonti, and St. Ferdinand Streets and I-10 (Louisiana Department of Culture, Recreation and Tourism, Division of Historic Preservation 2007c). Development in the area began in the 1830’s with the introduction of the Ponchartrian Railroad, and was generally complete by the 1920’s (GNOCDC 2007d). In the Antebellum Period, St. Roch was home to a large number of free people of color (Ibid. 2007). Historically, land uses in St. Roch were mixed, and included blacksmith shops, dairies and small farms (Ibid. 2007). Many jazz musicians lived in this area, as well as Creole and German
families (Ibid. 2007). The construction of I-10 and I-610 in the 1960’s caused portions of the neighborhood adjacent to the interstates to decline.
Land use in St. Roch is generally single- and two-family residential. Industrial uses exist along Florida Boulevard and I-10. Commercial parcels are located along St. Claude Avenue,
Almonaster Boulevard, Elysian Fields Avenue, and Florida Avenue.
There are several significant older structures in St. Roch, including St. Roch Market, Our Lady Star of the Sea and St. Roch Chapel and Cemetery. St. Roch Chapel and Cemetery is also culturally significant for its importance in the city’s Good Friday celebrations. St. Roch has several green spaces including the McCue Playground, Independence Square and the St. Roch Playground.
The median year of construction for housing units in St. Roch is 1949 (U.S. Bureau of the Census 2000: SF 3). The majority of housing units in St. Roch are in single-family structures (73.60%), 16.87% of structures are duplexes, and the rest are multi-family developments. Home-ownership rates in St. Roch are lower than the parish-wide statistic (46.50%), with
42.09% of occupied housing units occupied by their owners (Ibid. 2000). In 2000, 16.61% of the total housing units in St. Roch were vacant (Ibid. 2000). In St. Roch the median housing value in 2000 was $60,900 (Ibid. 2000).
The northwest portion of the St. Roch neighborhood experienced severe flooding following the levee failures, while the rest of the area received four feet of water or less. Relative to the complete destruction to the north and east, the considerable damage experienced in St. Roch is diminished, although approximately 32% of residential properties were deemed substantially damaged (New Orleans City Planning Commission 2006g).
needed. St. Roch Playground is currently serving as a FEMA trailer site. One of the three schools in St. Roch, Colton Junior High (now Colton Academy), has re-opened.
St. Claude
The portion of the St. Claude neighborhood included in the study area is bounded by St. Claude Avenue to the south, Law Street to the north, Franklin Avenue / Almonaster Boulevard to the west, and Montegut Street to the east. Land use in this portion of St. Claude is largely industrial. The Norfolk Southern Railroad and Oliver Yard are located in between St. Ferdinand/Press and Montegut Streets. Commercial uses line St. Claude and Franklin Avenues. Residential
development is located adjacent to the industrial and commercial corridors.
St. Claude was primarily swampland until the 1930’s, when the area was drained. The majority of residential development in St. Claude was complete by the 1950’s. The area between Franklin Avenue and Ferdinand Street is included in the Bywater Historic District. The Desire line, made famous by Tennessee Williams, traversed the St. Claude neighborhood until 1948. Prior to Katrina, feasibility and environmental studies were conducted for the potential return the Desire Streetcar to the area. Currently, these plans are indefinitely on hold.
The median year of construction for residences in the study area portion of St. Claude is 1950-1951 (U.S. Bureau of the Census 2000: SF3). The majority of residences, 71.39%, in this portion of St. Claude are single-family, and 20.07% are duplexes (Ibid 2000). Approximately 39.05% of the occupied housing units in this portion of St. Claude were owner-occupied (Ibid 2000). A high number of housing units in this portion of St. Claude were vacant in 2000, 22.17% (Ibid 2000). Median housing values for owner-occupied units in this portion of St. Claude is $56,400 (Ibid 2000).
In the southern portion of the St. Claude area, flood damages were minimized because water levels were at or below four feet and the majority of residences are raised three or four feet above grade (New Orleans City Planning Commission 2006h). In the northern portion of the
neighborhood, flood damage was more extensive, as the water reached depths of eight feet in some areas (Ibid 2006). Recovery is occurring along the St. Claude corridor, but there are fewer visual signs of occupancy and repairs in the southern portion of the neighborhood.
Bywater
The portion of the Bywater neighborhood included in the study area is bounded by St. Claude Avenue to the north, Franklin Avenue to the west, the Mississippi River to the south, and
Land uses in the Bywater are a mixture of residential, industrial, and commercial. Industrial uses are concentrated along the river and the railroad tracks. Commercial development is located along St. Claude Avenue, and less-intense neighborhood commercial uses are present throughout the neighborhood. The Bywater is home to the New Orleans Center for Creative Arts, a
professional arts secondary school, offering instruction in creative writing, dance, media arts, music, theatre arts, and visual arts.
The majority of residential structures in the Bywater were built prior to 1940 (U.S. Bureau of the Census 2000: SF3). The majority of residences in the Bywater are single family homes: 60.07% of residences of housing units consist of a single structure, and 19.14% are duplexes (Ibid. 2000). The majority of Bywater residents in 2000 were renters; 38.54% of occupied housing units were occupied by their owners(Ibid. 2000). In 2000, 18.83% of housing units in the Bywater were vacant (Ibid. 2000). The median value for owner-occupied housing units in the Bywater was $94,800 (Ibid. 2000).
Located on some of the highest ground in New Orleans, the Bywater did not flood subsequent to the levee failures. There was some damage in the Bywater due to winds; however, in
comparison to the surrounding areas, the damage sustained in the Bywater was minimal. The Bywater has recovered from the majority of the hurricane damage it sustained. The majority of residents have returned, repairs are completed or underway, and the majority of businesses and community facilities have re-opened. NOCCA has re-opened, but the Bywater Hospital remains closed.
Marigny
For the purposes of this study, the boundaries of the Faubourg Marigny are Esplanade Avenue to the west, St. Claude Avenue to the north, and Franklin Avenue of the east, the Mississippi River to the south. This area, which is part of the Faubourg Marigny National Historic District, is also referred to as the Marigny Triangle. The Faubourg Marigny was added to the National Register in 1974 for its significance in architecture and engineering (Louisiana Department of Culture, Recreation and Tourism, Division of Historic Preservation 2007f). The architectural styles in the Marigny include: Italianate, Greek Revival, Creole cottages, Victorian, among others (Ibid. 2007).
The majority of land uses in the Marigny are residential. Frenchman Street is a mixed-use corridor with restaurants, night clubs, bars, coffee shops, bed and breakfasts and other
commercial uses located along side residences. Less-intense neighborhood commercial uses are located throughout the Marigny, and more intense commercial uses are located along Rampart Street and Elysian Fields Avenue. Washington Square Park is a major recreational facility in the neighborhood.
The Faubourg Marigny sustained wind damage from Hurricane Katrina, but did not experience flooding due to its location on the high ground adjacent to the Mississippi River. Businesses and residents returned quickly to the Marigny, and little visual evidence of hurricane damage remains in the neighborhood.
Figure 2-5 presents the existing land uses in Planning District 7 (St. Roch, St. Claude, Marigny, and Bywater) in 1999.
Figure 2-5 Existing Land Use District 7 (1999)
Seventh Ward
For the purposes of this study, the Seventh Ward neighborhood is defined as the area bounded by St. Claude Avenue/Rampart Street to the south, one block south of Florida Avenue (Treasure, Abundance, Agriculture, Industry, Duels, and Hope Streets) to the northeast, N. Broad Avenue to the northwest, Elysian Fields Avenue to the east, and Esplanade Avenue to the west. In the Antebellum period, the Seventh Ward was primarily populated by free people of color
(GNOCDC 2007e). From the mid-nineteenth century until the mid-twentieth century, one of the most successful African-American business districts in the country was located in the Seventh Ward and neighboring Tremè (Ibid. 2007).
The prosperous business district along Claiborne Avenue in the Seventh Ward was destroyed for the construction of I-10. Rows of live oak trees were removed, and the neighborhood was divided by the interstate facility. The neighborhood steeply declined following the construction of the interstate.
The Seventh Ward was home to several New Orleans jazz musicians from the early twentieth century to the present. Social aid and pleasure clubs are an important component of Seventh Ward culture (Ibid. 2007). The Autocrat Club offers weekly Friday fish fries and Saturday dances. Hunters Field in the Seventh Ward is a traditional Super Sunday meeting place for Mardi Gras Indian tribes, and the area is home to the Seventh Ward Hunters. Corpus Christi Catholic Parish, established in 1915 in the Seventh Ward, is the largest African-American Catholic parish in the United States (Ibid. 2007).
Land use in the Seventh Ward is primarily one- and two-family residential. Commercial corridors are located along Claiborne Avenue, St. Bernard Avenue, and Rampart Street. The southern portion of the Seventh Ward neighborhood, between St. Bernard Avenue, Elysian Fields Avenue, Rampart Street, and Claiborne Avenue, is part of the Marigny Historic District. Portions of the Seventh Ward adjacent to the Esplanade Ridge National Historic District are locally designated as the Esplanade Ridge Historic District (Ibid. 2007).
St. Augustine High School is located in the Seventh Ward. The Marching One Hundred,
St. Augustine’s marching band, is a favorite at Mardi Gras parades. Other schools in the Seventh Ward area include: Epiphany Academy, Jones Elementary, McDonough #42 Elementary,
McDonough #35 Senior High School, Tureaud Elementary, and Corpus Christi Catholic School. Parks in the Seventh Ward include: A.P. Tureaud Park and Hardin Park. The Nora Navra
Branch of the New Orleans Public Library is located in the Seventh Ward. St. Martin Manor, a housing development for the elderly owned and operated by the New Orleans Archdiocese, is located in the Seventh Ward.
16.16% of all housing units were vacant (Ibid. 2000). Median housing unit value in the Seventh Ward was $65,800 in 2000 (Ibid. 2000).
The northeast portion of the Seventh Ward sustained significant damage due to flooding. The majority of the southern and western portions of the Seventh Ward were not flooded, but there was extensive damage due to winds, fire, and vandalism throughout the neighborhood (New Orleans City Planning Commission 2006i). A number of Seventh Ward residents have returned, but the neighborhood has not recovered. St. Augustine, McDonough #35, and Tureaud Elementary have re-opened; the rest of the schools in the Seventh Ward remain closed. Hardin Park is currently used for FEMA trailers. The Nora Navra Branch of the New Orleans Public Library and St. Martin Manor remain closed. However, the Autocrat Club has resumed hosting weekly fish fries and dances.
Figure 2-6 Existing Land Use District 2 (1999)
French Quarter
The portion of the French Quarter included in the study area is bounded by Esplanade Avenue to the east, the Mississippi River to the south, N. Rampart Street to the north, and St. Phillip Street to the west. This area is part of the Vieux Carre Historic District, added to the National Register of Historic Places in 1966 (Louisiana Department of Culture, Recreation and Tourism, Division of Historic Preservation 2007f). There are several buildings in the French Quarter that are listed individually on the Nation Register, including the following buildings that are within the limits of the study area: the French Market (Old Vegetable Market), Gallier House, Lafitte's
Blacksmith Shop, LeCarpentier-Beauregard-Keyes House, Madame John's Legacy, Old Ursuline Convent, Jean Louis Rabassa House (also known as McDonough No. 18 School Annex), and the U.S. Mint, New Orleans Branch (Ibid. 2007).
The French Quarter is the original part of the City of New Orleans, founded in 1718 by Jean Baptiste le Moyne, sieur de Bienville (GNCDC 2007f). The French Quarter is a tourist
destination and includes restaurants, bars, nightclubs, art galleries, antique stores and other retail establishments and attractions (Ibid. 2007). Land use in the French Quarter is primarily
commercial, although the portion included in the study area is largely residential. Along commercial corridors, such as Decatur and Royal Streets, buildings often contain commercial uses on the bottom floor and residences on upper floors.
The majority of existing structures in the French Quarter were constructed after 1794, when fire destroyed most of the original French settlement. Duplexes are typical in the French Quarter: 55.00% of housing units in the portion included in the study area contain two units (U.S. Buresu of the Census 2000: SF3). A minority of housing units are single-family, at 20.71% (Ibid. 2000). Residences containing between three and nine units compose 42.26% of the total housing units, and the remaining portion is composed of multi-family residences containing ten units or more (Ibid. 2000). Most residents of the French Quarter rent, 66.51% of occupied housing units are rented (Ibid. 2000). Median housing value in the French Quarter is $346,000 (Ibid. 2000).
The French Quarter experienced damaging winds that destroyed property, particularly through damage to roofing systems. The majority of damage in the French Quarter has been economic: the commercial establishments in the French Quarter depend on tourism, and tourism levels have not recovered. The majority of businesses in the French Quarter are open; however, many are operating with smaller staffs, and profits have not recovered to pre-Katrina levels.