Print ISSN: 2383-451X Online ISSN: 2383-4501 Web Page: https://jpoll.ut.ac.ir, Email: [email protected]
Risk Assessment and Mitigation Measures on the Heavy Metal
Polluted Water and Sediment of the Kolleru Lake in Andhra
Pradesh, India
Das Sharma, S.
Formerly at CSIR–National Geophysical Research Institute, Uppal Road, Hyderabad – 500007, India
Received: 09.08.2018 Accepted: 22.11.2018
ABSTRACT: The Kolleru Lake is a famous Ramsar wetland of international significance. In this study heavy metal contents in water and sediment samples are reported. It is found that certain potentially toxic metal ions like chromium (4.580 µg/L), copper (120 µg/L), manganese (1313 µg/L) and zinc (1.257 µg/L) are present in variable quantities in the lake water. When normalized with respect to concentration of each element in clean surface waters, the normalized ratio is found to be highly heterogeneous (chromium=4.580, copper=0.33.3, manganese=0.0720.8, zinc= negligible to 2.8). At several places, the normalized ratio is greater than 1, indicating anthropogenic input. The concentration of iron (420 µg/L) in water, however, is less compared to the clean surface waters. Chemical analyses and quality assessment of Kolleru Lake sediments have been carried out through estimation of four pollution indices, which include enrichment factor (EF), geoaccumulation index (Igeo),
contamination factor (CF) and pollution load index (PLI). Evaluation of these contamination indices with respect to average sediment composition of Taylor & McLennan (2001) confirmed that the Kolleru Lake sediment is polluted with a number of heavy metals that include cobalt (EF=2, Igeo=0.64, CF=2.4) , chromium (EF=1.5,
Igeo=0.18, CF=1.7), copper (EF=1.6, Igeo=0.29, CF=1.9), manganese (EF=1.3, Igeo=0,
CF=1.4), vanadium (EF=1.5, Igeo=0.19, CF=1.7) and zinc (EF=1.5, Igeo=0, CF=1.5). The
level of contamination, however, is minor to moderate and is in good agreement with the heavy metal chemistry of the lake water. Based on these results some measures for environmental rehabilitation of the lake and its surroundings have been proposed.
Keywords: Kolleru Lake; Ramsar wetland; toxic element; pollution indices; ecosystem.
INTRODUCTION
Lakes provide livelihood to many people across the globe. In developing countries, more than 60 million people rely on lakes for their income (FAO, 2015). However, pollution of Lake Ecosystem and its surroundings due to anthropogenic activities has become a major global issue in many parts of the world. The Anzali
*
Corresponding Author Email: [email protected]
the sediment (Hargalani et al., 2014). The Bamdezh wetland in Iran is another habitat, which represents a good food source for aquatic ecosystem, besides attracting migratory birds. Geochemical studies conducted on the sediments of this wetland indicate that the level of pollution due to anthropogenic activities vary significantly in different parts of the wetland, which range from unpolluted through moderately polluted to strongly polluted (Vaezi et al., 2015a). In a recent study Koff et al. (2016)
have demonstrated the use of
paleolimnology as a potential tool to ascertain vital information from sediments, which in turn, allows a historical reconstruction. The extent of the effect of anthropogenic pollutants or other environmental stressors can be pinpointed so that adequate insight for eutrophication assessment can be gained. Preservation, restoration and management of water bodies can therefore be planned in a better way (Koff et al., 2016). In another significant study, Vaezi et al. (2015b) analyzed sediment samples from the Petrochemical Special Economic Zone of Mahshahr Bay, Persian Gulf. They recorded high concentration of trace metals in the sediments, whose origin was entirely geogenic. Therefore they cautioned that the assessment of pollution hazard on aquatic bodies in such geological set up should not be conducted through conventional approaches.
In India, the dependency on lakes for livelihood is also seen in different parts as evidenced from the explosion of agricultural and livestock farming, fishery industries and tourism around many lakes of the country (Zutshi & Khan, 1988; Gupta et al., 2001; Dahdouh-Guebas et al., 2006; Iwasaki & Shaw, 2009). All these Indian lakes are subjected to human-induced adverse impacts, which are undesirable. The Kolleru Lake is one of the largest natural freshwater lakes in India located in the southern state of Andhra
Pradesh. During August 2002 the lake has been designated as a wetland of international importance (see Wikipedia for List of Ramsar sites in India) under the International Ramsar Convention. Wetlands are of considerable economic importance, as they nourish diverse biota and are natural habitat for a large variety of resident and migratory birds. Naturally, the Kolleru Lake was also a ―paradise of birds‖ and used to be a place of tourist attraction. However, during the past two and half decades the lake habitat has degraded
significantly owing to various
anthropogenic origin of metals in the
Kolleru Lake sediments. The
concentrations of Zn, Cu and Pb in different species of fishes were also found to be very high in the following order: gills > liver > muscle. Based on these results they concluded that the Kolleru Lake fishes are contaminated with metals. Hence it is advisable not to use them for human consumption (Chandra Shekar et al., 2003). Subsequent study was carried out by Mastan (2014) on the heavy metal concentrations of cadmium, zinc, copper, chromium, lead and mercury in various tissues of Labeo rohita and Channa striatus and in the water samples. These samples were collected during 2009-2010. The results indicated that the concentrations of heavy metals in different organs of fishes vary. While L. rohita followed the order liver > kidney > gills > muscles, in the case of C. striatus, the order was liver > kidney > gills > muscle. Based on the obtained results, Mastan (2014) concluded that the concentrations of heavy metals are within the maximum permissible levels for drinking water and fish. Rao et al. (2004) processed the IRS-ID LISS-III multi-band digital image data of the Kolleru Lake region using various image enhancement techniques. Their study revealed that more than 50% of the original lake was lost due to high sedimentation rate, and these elevated portions of lake areas were subsequently occupied by local residents for aquaculture and agriculture. The rest of the lake also did not show any stretch of clear water, and it is either covered by weed or dried out by reclamation. In a recent study on characterization of water chemistry of the Kolleru Lake in conjunction with its sediment 13C and 18O compositions, Das Sharma & Sujatha (2016) documented hazardous effect of saline water intrusion into the lake. This poses a serious threat to the lake ecosystem. Three major contributors for seawater intrusion into the
lake have been identified. These are: (i) prevalence of lake‘s dry condition originating from excessive groundwater exploitation for agriculture and other purposes surrounding the lake areas, (ii) reduced inflow and outflow of freshwater into the lake due to piling up of huge sediments and residues that drain into the lake, and (iii) proximity of the lake (~35 km inland) to the Bay of Bengal (Das Sharma & Sujatha, 2016). We also
documented highly heterogeneous
distribution of certain potentially toxic metal ions like chromium, copper, manganese and zinc in the lake waters. Indiscriminate disposal of domestic and industrial effluents in and around the lake perhaps are responsible for the presence of these toxic heavy metals (Das Sharma & Sujatha, 2016). Based on these results, several remedial measures were proposed by us to revive the lake ecosystem. One of the measures was to restore free flow of water in the lake. Therefore it was recommended to clean up the lake bed at a regular interval so that a deep lake bed is ensured. This, in turn, would facilitate recharge of large volumes of freshwater into the lake during the rainy seasons. In this context it is important to note that the lake and its surroundings receive an average annual rainfall in excess of 1000 mm of which ~60% is received during south-west monsoon period lasting from mid June to mid October (ISRO, 2011).
soil may become contaminated. This is highly undesirable. Furthermore, it is also important to note that sediments play a crucial role in water quality. They remove elemental pollutants from the water; however, the pollutant elements that have accumulated in the sediments may diffuse back into the surface waters or penetrate into the underground waters. Therefore, the sediments may become ‗‗reservoirs‘‘ for toxic and heavy metals, created from anthropogenic activities (Huy et al., 2002). As a follow up study, in this work I therefore report major and trace element (mostly heavy metal) concentrations in sediments of the Kolleru Lake. These sediment samples were collected along with the water samples from the same locations, and the trace element contents in water samples were reported earlier (Das Sharma & Sujatha, 2016). The contamination level in sediments is estimated using geochemical indices such as metal enrichment factor (EFmetal), geoaccumulation indices (Igeo), contamination factor (CF) and pollution load index (PLI). An assessment is then made to evaluate the extent of anthropogenic contribution on the measured parameters.
MATERIALS AND METHODS
In view of international significance of the area (a Ramsar site), a brief account of the study area is presented first. The Kolleru Lake, located between the latitudes 16 32ʹ and 16 47ʹ N and longitudes 81 05ʹ and 81 27ʹ E, is the largest natural freshwater lake in the southern state of Andhra Pradesh. The lake lies between the deltas of two main rivers, viz., the Godavari and the Krishna and it is approximately 35 km inland from the present day shoreline (Fig. 1). There are three main streams that drain into the lake. These streams are known as the Budimeru, the Thammileru and the Ramileru. The lake finally drains itself into the Bay of Bengal through the Upputeru
river (see also Rao et al., 2004; Das Sharma & Sujatha, 2016). It is a shallow freshwater body with a natural spread of ~674 km2. However, its areal extent goes up to ~954 km2 during the rainy seasons when highest floods are recorded in the area. On the other hand, during dry seasons the areal extent comes down to as low as ~66 km2. It is significant to note that the lake also serves as a natural flood-balancing reservoir for the two major rivers the Godavari and the Krishna. Fluvio-marine deposits (sand, silt and clay) characterize the lake surroundings from all sides. The nearest rock formations occur about 10 km away from the lake. The geological formations include khondalite, Gondwana, Deccan traps and tertiary sediments (Amaraneni, 1997; Das Sharma & Sujatha, 2016). Various types of macrophytes such as water hyacynth (Eichhornia crassipes), elephant grass (Pennisetum purpureum), Salvania sp., Ipomea aquatica and many others have invaded the lake. It has also been documented that prolific use of fertilizers and pesticides, discharges from fish pond, disposal of domestic wastes and sewage, and discharge of industrial effluents and agricultural runoff carrying inorganic nutrients have severely affected and altered the ecological character of the lake ecosystem (Azeez et al., 2011).
Eighteen sampling points were selected to cover the lake area (Fig. 1). Uniform sampling could not be carried out due to inaccessibility of some of the locations. The water samples were collected during summer of 2013 following standard procedure (USEPA, 1983). Polypropylene bottles (1 litre) for sample collection were soaked in 5% HNO3 for 24 h followed by
Fig. 1. Map showing Kolleru Lake. Two prominent towns close to the lake, viz., Eluru and Kaikaluru together with various anthropogenic inputs surrounding the lake area are shown (modified after Amaraneni & Pillala, 2001). Eighteen sampling points for water and surface sediments are marked by open circles. The horizontal scale (5 km) displayed in the figure corresponds to 0.045. The geographical location of the lake (study area) in the state of Andhra Pradesh, India is marked in the inset.
in the field. The pH electrode was calibrated with pH 4 and pH 9.2 buffer solutions. The samples were then acidified with 5 ml HNO3 to prevent the adsorption
of heavy metals onto the bottle walls and transported to the laboratory. Until use, preservation of these water samples was done following the recommendations of USEPA (1983). The heavy metal analyses were done in the laboratory within 2 to 3 weeks of the sample collection. The concentrations of cations such as Fe, Mn, Cr, Cu and Zn were determined by ICP-OES (model Optima 4300 DV) using the standard procedure (see APHA, 1995; Das Sharma & Sujatha, 2016).
The sediment samples were collected along with water samples from the same locations as that of the water samples. These sediments are primarily alluvium and made up of fine particles of silt, clay and relatively coarse grained sand.
in each cup and pressed under a hydraulic press at 20 tons pressure to get a pellet (Rao & Govil, 1995). The major and trace element concentrations were measured on the sediment samples using a Philips PW-2440 fully automated microprocessor-controlled, 168-position automatic PW
2540 vrc sample changer X-ray
fluorescence spectrometer. Suitable software ‗Super Q‘ was used to define dead-time correction and inter element matrix-effects. International sediment reference materials from the US Geological Survey and Canadian Geological Survey (LKSD 1, TILL 1 and TILL 3) were used to prepare the calibration curves for trace elements (for details of XRF procedure, see Rao & Govil, 1995; Krishna et al., 2007). During the course of XRF analyses, the QA/QC plan was strictly adhered to using international sediment reference material, thereby ensuring quality data.
Four pollution indices are estimated for the purpose of environmental risk assessment. These indices are: enrichment factor (EF), index of geoaccumulation (Igeo), contamination factor (CF), and pollution load index (PLI). A brief account of these parameters is presented in Appendix-A.
RESULTS AND DISCUSSION
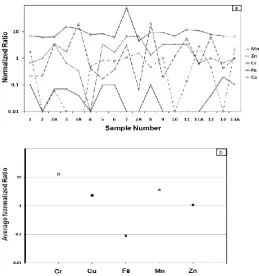
The water samples from Kolleru Lake are near neutral to alkaline (pH varying from 6.8 to 8.8). The total dissolved solids (TDS) in these waters are variable ranging from 1006 to 5285 mg/L, indicating that they belong to brackish water type, which has typical TDS contents of ~1000 mg/L or more (Freeze & Cherry, 1979). The range, average and standard deviation of the concentrations of a few selected trace metals in the water samples of the Kolleru Lake are presented in Table-1. The normalized concentration ratio of these metals is presented in Fig. 2a. The normalization has been carried out with respect to the median values of
concentration of these toxic elements that
were reported for clean and
uncontaminated surface waters (data from Langmuir, 1997). Values in excess of 1 indicate enrichment and those below 1 specify depletion. It can be seen from Fig. 2a that Cr is enriched and Fe is depleted, while the other elements like Cu, Mn and Zn show both enrichment as well as depletion at various locations (see Figs. 1 and 2a).
Figure 2a points to the fact that the distribution of the analyzed elements in water of the lake is highly heterogeneous; indicating that both free flow and internal mixing of water in the lake is obstructed. Furthermore, the observed heterogeneous distribution could be due to the presence of various types of macrophytes such as water hyacynth (Eichhornia crassipes), elephant grass (Pennisetum purpureum), Salvania sp., Ipomea aquatica and many others, some of which have the potential to purify water from various toxic metals (see also Das Sharma & Sujatha, 2016). To cite an example, the toxic metal removal potential of water hyacinth was evaluated by Stephenson et al. (1980). It was found by these researchers that water hyacinths can be used as remediator plants for several toxic metals like Cd, Co, Cr, Cu, Fe, Pb etc. Likewise, Dhote & Dixit (2009) reviewed the role of macrophytes in order to improve the water quality by preferentially scavenging different heavy metals. In view of the above, it is inferred
that the observed heavy metal
high, whereas the level of Zn is marginally high. Although with the available data it is difficult to point out the exact source/sources and assess the relative contribution of each source for the observed high concentration of toxic heavy elements in the lake water, it is certain that unchecked anthropogenic activities in and around the Kolleru Lake area are responsible for the degradation of its water quality (cf. Das Sharma & Sujatha, 2016).
In view of the phytoremediation potential of various species discussed here, it is relevant to ask whether these species in the lake ecosystem need to be maintained or they should be eliminated. As proposed in our previous study, it is stressed that after the phytoextraction processes, these species need to be disposed off safely during the initial stages of restoration phase of the lake (see also Das Sharma & Sujatha, 2016).
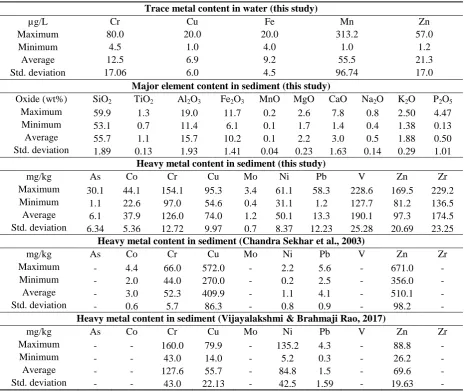
Table 1. Range, average and standard deviation of 5 selected trace metal concentrations in water samples collected from the Kolleru Lake in Andhra Pradesh. Similar data on 10 major elements and 10 heavy metals pertaining to the surface sediments of the Kolleru Lake are also presented. For comparison, range, average and standard deviation on heavy metal contents in sediment reported earlier by Chandra Sekhar et al. (2003) and Vijayalakshmi & Brahmaji Rao (2017) are also included in the table.
Trace metal content in water (this study)
µg/L Cr Cu Fe Mn Zn
Maximum 80.0 20.0 20.0 313.2 57.0
Minimum 4.5 1.0 4.0 1.0 1.2
Average 12.5 6.9 9.2 55.5 21.3
Std. deviation 17.06 6.0 4.5 96.74 17.0
Major element content in sediment (this study)
Oxide (wt%) SiO2 TiO2 Al2O3 Fe2O3 MnO MgO CaO Na2O K2O P2O5
Maximum 59.9 1.3 19.0 11.7 0.2 2.6 7.8 0.8 2.50 4.47
Minimum 53.1 0.7 11.4 6.1 0.1 1.7 1.4 0.4 1.38 0.13
Average 55.7 1.1 15.7 10.2 0.1 2.2 3.0 0.5 1.88 0.50
Std. deviation 1.89 0.13 1.93 1.41 0.04 0.23 1.63 0.14 0.29 1.01
Heavy metal content in sediment (this study)
mg/kg As Co Cr Cu Mo Ni Pb V Zn Zr
Maximum 30.1 44.1 154.1 95.3 3.4 61.1 58.3 228.6 169.5 229.2
Minimum 1.1 22.6 97.0 54.6 0.4 31.1 1.2 127.7 81.2 136.5
Average 6.1 37.9 126.0 74.0 1.2 50.1 13.3 190.1 97.3 174.5
Std. deviation 6.34 5.36 12.72 9.97 0.7 8.37 12.23 25.28 20.69 23.25
Heavy metal content in sediment (Chandra Sekhar et al., 2003)
mg/kg As Co Cr Cu Mo Ni Pb V Zn Zr
Maximum - 4.4 66.0 572.0 - 2.2 5.6 - 671.0 -
Minimum - 2.0 44.0 270.0 - 0.2 2.5 - 356.0 -
Average - 3.0 52.3 409.9 - 1.1 4.1 - 510.1 -
Std. deviation - 0.6 5.7 86.3 - 0.8 0.9 - 98.2 -
Heavy metal content in sediment (Vijayalakshmi & Brahmaji Rao, 2017)
mg/kg As Co Cr Cu Mo Ni Pb V Zn Zr
Maximum - - 160.0 79.9 - 135.2 4.3 - 88.8 -
Minimum - - 43.0 14.0 - 5.2 0.3 - 26.2 -
Average - - 127.6 55.7 - 84.8 1.5 - 69.6 -
Fig. 2. Plot showing heavy metal contaminated water chemistry of the Kolleru Lake. The normalized and average normalized ratios of some toxic trace metals in the water samples of the Kolleru Lake are plotted for (a) individual sampling site and (b) the entire lake, respectively. Note that values greater than 1 indicate enrichment and those lower than 1 specify depletion (for normalization, data from Langmuir, 1997 is used).
The range, average concentration and standard deviation corresponding to each major and trace element analyzed in this study pertaining to 18 sediment samples are presented in Table1. It is important to mention here that of all the sediments, sample number 8 is highly anomalous. In that it shows the maximum concentrations for As, Cr, Mo and Pb. Four other elemental concentrations (viz. Co, Cu, Ni and V) for this sample are also high (more than 0.8 times of the maximum value). Such high values perhaps reflect point source contamination and could originate from localized anomaly due to illicit dumping/discharge of contaminants.
It has been documented that the abundance of heavy metals in sediments normally follows the order as: Fe > Mn > Zn > Cu > Pb > Cr > Ni, which corresponds to the natural progressive concentration of heavy metals in sediments (Turekian & Wedepohl, 1961). Almost similar ranking
Table1. It can be noted from Table1 that while the average abundances of Cr, Ni, Co and Pb of Kolleru Lake sediments exhibit considerable increase, those of Zn and Cu show depletion when compared with the data of Chandra Shekar et al. (2003). Therefore the present study points out that the average abundances of Cr, Ni, Co and Pb in the Kolleru Lake sediments have enhanced significantly with time, whereas those of Zn and Cu reduced considerably. Recent data on Zn and Cu reported by Vijayalakshmi & Brahmaji Rao (2017) for Kolleru Lake sediments also exhibit lower average abundances, whereas those of Cr and Ni show higher average concentrations (see Table1). The results obtained in the present study are therefore in good agreement with those of Vijayalakshmi & Brahmaji Rao (2017) (see Table1).
In the present study total metal concentration was measured by XRF method. However, it is now well established fact that in order to evaluate the possible toxicity or risk of environmental pollution due to heavy metals present in sediments, the types of association between metals and the sediment must be assessed. This can be undertaken by adopting sequential extraction techniques (e.g., Tessier et al., 1979).Therefore in order to understand the abrupt drop in the average abundances of Cu and Zn as documented in the present study, reference can once again be made about the study of Chandra Shekar et al. (2003), who employed sequential extraction of metals from sediments. Based on the extractable contents of metals in sediments using sequential extraction scheme, these researchers argued that all metals were mainly associated with the oxidizable (organic matter bound) fraction and residual fraction as indicated by the partitioning patterns for Zn, Cd, Cu, Pb, Cr, Ni and Co in sediment samples. Such observation also allowed them to predict the mobility of metals in sediments and thereby their entry into human food chain. According to the results obtained by them, four metals
(Zn, Cd, Cu and Pb) are dominantly associated with the fraction which is mobile (exchangeable and carbonate bound). In other words, the bioavailability of these metals is more to aquatic life. The abrupt reduction in the average abundances of Zn and Cu in Kolleru Lake sediments reported in the present study may possibly be attributed to their bioavailability to aquatic life. The increase in the average abundances of Cr, Ni, Co and Pb with time is unambiguously a reflection of continued anthropogenic activities in the vicinity of the lake.
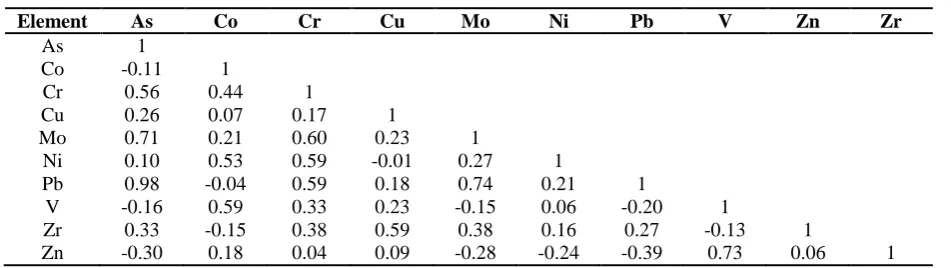
Table 2. Correlation matrix of different heavy metals in Kolleru Lake sediments.
Element As Co Cr Cu Mo Ni Pb V Zn Zr
As 1
Co -0.11 1
Cr 0.56 0.44 1
Cu 0.26 0.07 0.17 1
Mo 0.71 0.21 0.60 0.23 1
Ni 0.10 0.53 0.59 -0.01 0.27 1
Pb 0.98 -0.04 0.59 0.18 0.74 0.21 1
V -0.16 0.59 0.33 0.23 -0.15 0.06 -0.20 1
Zr 0.33 -0.15 0.38 0.59 0.38 0.16 0.27 -0.13 1
Zn -0.30 0.18 0.04 0.09 -0.28 -0.24 -0.39 0.73 0.06 1
Lake sediments can act as sink for a large number of contaminants that can be stored in the bed sediments. If the environmental conditions change within the sedimentary column, these sediments can become the source of pollution. In view of all these, four pollution indices have been estimated for the purpose of environmental risk assessment of the Kolleru Lake sediments. It is to be borne in mind that for the estimation of various pollution indices, the choice of an appropriate background assumes extreme importance. Different researchers have made use of compositions of various background references for the estimation of pollution indices (Förstner & Müller, 1973; Sinex & Helz, 1981; Salomon & Förstner, 1984; Chakravarty & Patgiri, 2009; Perunović et al, 2015; Poh & Tahir, 2017). These background references include (i) average shale (Turekian & Wedepohl, 1961), (ii) composition of the average continental crust (Taylor, 1964; Rudnick & Gao, 2003), (iii) composition of world soil baseline reference (Ure & Berrow, 1982), (iv) soil in relatively unpolluted areas and borehole sediment composition as a standard (Perunović et al., 2015), and (v) composition of world surface rock average (Martin & Meybeck, 1979).
In the present study in order to choose a suitable background, an ACNK diagram (Nesbitt & Young, 1984) corresponding to 18 sediment samples collected in this study from the Kolleru Lake is considered. Since degradation of feldspar and concomitant formation of clay minerals are the dominant processes during chemical weathering,
elements such as Ca, Na and K that are labile get removed easily from the feldspar during weathering. Therefore the abundance of these elements with respect to resistant elements can be used as a measure to deduce the extent of chemical weathering (Nesbitt & Young, 1984). The most intensely weathered samples plot in the top corner of the diagram, reflecting preponderance of Al-silicates. As plagioclase is more susceptible to weathering than K-feldspar, Ca and Na are leached preferentially over K, so that the slope of the weathering trend becomes sub-parallel to the A–CN boundary (see Nesbitt & Young, 1989). Figure 3 shows the ACNK diagram of Kolleru Lake sediments along with the compositions of average continental crust (Taylor, 1964) and average sediment (Taylor & McLennan, 2001). It can be seen that both the chosen backgrounds do represent well the weathering trend of the Kolleru Lake sediments, which is sub-parallel to the A-CN boundary. This diagram (Fig. 3) therefore forms the basis of choosing the suitable backgrounds (viz. average continental crust and/or average sediment) for this study in order to assess the environmental risk of the Kolleru Lake sediments.
also been considered in the present study (see Table3). Compositions of all these have been used as references in this study
for the estimation of enrichment factor, geoaccumulation index, contamination factor and pollution load index etc.
Fig. 3. ACNK diagram for the Kolleru Lake sediments. The compositions of average crustal rock (Taylor, 1964) and average sediment (Taylor & McLennan, 2001) are also plotted in the diagram. The line sub-parallel to the A-CN join indicates the predicted weathering trend (Nesbitt & Young, 1989). Note that most of the sediment samples from Kolleru Lake plot along the predicted trend originating from average crustal rock or average sediment. This diagram therefore forms the basis for selection of suitable background in the present study for estimation of different pollution indices (see text for details).
Table 3. Average values of major element and heavy metal concentrations of various rock materials used as background. Assessment of metal pollution on surface sediments of Kolleru Lake was made by estimating enrichment factor, geoaccumulation index, contamination factor and pollution load index etc (see Table4 and text).
Major elements
(wt%) Si Ti Al Fe Mn Mg Ca Na K P
Average crustal rock
(Taylor, 1964) 28.15 0.57 8.23 5.63 0.095 2.33 4.15 2.36 2.09 0.105 Average sediment
(Taylor & McLennan, 2001)
30.0 0.45 7.1 4.0 0.068 1.85 6.40 1.25 2.35 0.0665
World surface rock average (Martin & Meybeck, 1979)
- 0.38 6.93 3.59 0.072 - - - - -
Heavy metals
mg/kg As Co Cr Cu Mo Ni Pb V Zn Zr
Average crustal rock
(Taylor, 1964) 1.8 25 100 55 1.5 75 12.5 135 70 165
Average sediment (Taylor & McLennan, 2001)
- 16 74 40 - 40 17 110 65 210
World surface rock average (Martin & Meybeck, 1979)
The average EF values of measured trace metals relative to the concentrations of background elements used in this study for the Kolleru Lake sediments are presented in Table4. If 1<EFmetal<5, then the contamination level is not very significant and it only means minimal to moderate metal accumulation at the sampling sites relative to the background (Sutherland, 2000). Using this criterion it can be inferred that the Kolleru Lake sediment is not much contaminated with the studied metals (EF< 5). However, there are some metals which show slight enrichment as indicated by their
EF >1 value (see Table4). When average crustal rock is considered as the background (Taylor, 1964), the mean values of EF>1 are exhibited by As, Co, Cr, Cu, Pb, V, Zn and Zr. Using average sediment compositions as the background (Taylor & McLennan, 2001), the metals which are characterized by average EF of more than 1 are Co, Cr, Cu, Mn, Ni, V and Zn etc. For world surface rock (Martin & Meybeck, 1979) as background, the metals which show minor enrichment are Cr, Cu and Mn (see Table4). The estimated average
Table 4. Estimated average values of enrichment factors, geoaccumulation indices, contamination factors and pollution load index for various toxic elements present in the Kolleru Lake sediments. It is important to note that according to Müller (1969) instruction, wherever and whenever a negative value is obtained for geoaccumulation index, it should be replaced by zero. The choice of average crustal rock and average sediment as background references is justified based on weathering trend of Kolleru Lake sediments in the ACNK diagram. In addition, a third background reference, world surface rock, is also chosen for estimation of the pollution indices (see text for details).
ACR= Average crustal rock (Taylor, 1964) AS= Average sediment (Taylor & McLennan, 2001)
WSR= World surface rock average (Martin & Meybeck, 1979)
Considering aluminium as immobile element, average enrichment factors (EF) for various toxic elements
Background taken
as EFAs EFCo EFCr EFCu EFMn EFMo EFNi EFPb EFV EFZn EFZr
ACR 3.3 1.5 1.3 1.4 1.0 0.8 0.7 1.1 1.4 1.4 1.1
AS - 2.0 1.5 1.6 1.3 - 1.1 - 1.5 1.3 0.7
WSR - - 1.1 2.0 1.2 - 0.9 0.6 - 0.7 -
Average geoaccumulation indices ( Imetalgeo ) for various toxic elements Background taken
as I
As
geo ICogeo ICrgeo ICugeo IMngeo IMogeo INigeo IPbgeo IVgeo IZngeo IZrgeo
ACR 1.05 0.0 0.0 0.0 0.0 0.0 0.0 0.0 0.0 0.0 0.0
AS - 0.64 0.18 0.29 0.0 - 0.0 0.0 0.19 0.0 0.0
WSR - - 0.0 0.61 0.0 - 0.0 0.0 - 0.0 -
Average contamination factors (CF) for various toxic elements
Background taken
as CFAs CFCo CFCr CFCu CFMn CFMo CFNi CFPb CFV CFZn CFZr
ACR 3.4 1.5 1.3 1.3 0.7 1.0 0.7 1.1 1.4 1.4 1.1
AS - 2.4 1.7 1.9 1.4 - 1.3 - 1.7 1.5 0.8
WSR - - 1.3 2.3 1.4 - 1.0 0.7 - 0.8 -
Pollution Load Index (PLI) based on equation (4). CF values for different backgrounds have been used. PLI (based on average CFAs,CFCo, CFCr, CFCu, CFPb CFV, CFZn, and CFZr with ACR as background) 1.45
PLI (based on average CFCo, CFCr, CFCu, CFMn CFNi, CFV, and CFZn with AS as background) 1.66
geoaccumulation indices (Imetalgeo) of various trace metals in the sediments of the Kolleru Lake are also presented in Table4.Taking average crustal rock composition as the background (Taylor, 1964), it can be seen that with the exception of arsenic, the average Imetalgeo values for all the studied trace metals are characterized by Imetalgeo=0, indicating mostly unpolluted sediment quality. This is in contrast with our previous observation where trace metals such as As, Co, Cr, Cu, Pb, V, Zn and Zr in Kolleru Lake sediments are characterized by average EF values of >1, indicating minor to moderate enrichment. Therefore Imetalgeo values have been estimated using compositions of average sediment (Taylor & McLennan, 2001) as well as world surface rock average (Martin & Meybeck,
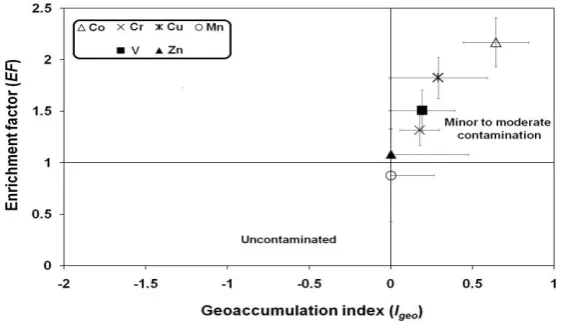
1979) as backgrounds. It can be seen that the estimated Imetalgeo values for at least four elements, viz., Co, Cr, Cu and V are characterized by moderate positive values and are in conformity with the estimated average EF values of these trace metals (see Table4 and Fig. 4). It may also be pointed out that both average EFAs and IAsgeovalues are more than one (3.3 and 1.05, respectively; see Table4) when composition of the average continental crust is taken as the background. However, it is believed that such an observation has nothing to do with arsenic contamination of Kolleru Lake sediments and it may be an artefact of extremely low content of arsenic (1.8 mg/kg) in the average crustal rock.
Fig. 4. Average enrichment factor plotted against average geoaccumulation index with respect to average sediment as the background. Concentrations of various toxic metals are considered in the present study to assess the risk associated with the sediment quality of the Kolleru Lake. The horizontal and vertical error bars indicate the standard deviations on average values corresponding to each point. At least four elements (viz. Co, Cr, Cu and V) present in the Kolleru Lake sediments are characterized by average EF> 1 and average Igeo> 0, indicating minor to moderate contamination. It may be noted that
according to Müller (1969) instruction, wherever and whenever a negative value is obtained for geoaccumulation index, it should be replaced by zero (Mn and Zn).
The pollution load index (PLI) was proposed by Tomlinson et al. (1980). This parameter provides a measure to assess the sediment quality over an area if the average contamination factor (CF) is considered. For example, if PLI value is zero then the quality of the sediment is considered to be perfect. On the other hand, if this parameter is close
average contamination factors (CF) for Kolleru Lake sediments are estimated for various toxic elements using compositions of average continental crust (Taylor, 1964), average sediment (Taylor & McLennan, 2001) and world surface rock average (Martin & Meybeck, 1979) as backgrounds (see Table4). Using these average CF values, PLI in sediments of Kolleru Lake has been calculated. In the computation of PLI, average CF values of only those toxic metals are used for which CFmetalaverage >1. These
PLI values corresponding to various backgrounds are presented in Table4. It can be seen that all the values are greater than 1.0, indicating initiation of deterioration of the study area. Toxic metals such as Co, Cr, Cu, Mn, V and Zn are of major concern. It is also important to note that the results on PLI are in conformity with those of average EFmetal and Imetalgeo values presented above (see also Table4 and Fig. 4).
Summarizing the results obtained from EFmetal, Imetalgeo, CFmetal and PLI (Table4 and Fig. 4), the following inferences can be drawn: (i) the average concentrations of some heavy metals (Co, Cr, Cu, Mn, V and Zn) in the Kolleru Lake sediments are higher than the background values, (ii) these results are also consistent with the dissolved heavy metal contents in water samples of the Kolleru Lake that were collected from the same location along with the sediments, (iii) the average contents of all other heavy metals are low relative to the background and they do not pose any threat to the lake ecosystem (see Table4), (iv) the choice of background is extremely important to assess the extent of metal pollution in the sediment, and (v) the use of ACNK diagram in conjunction with concentrations of average sediments (Taylor & McLennan, 2001) and/or world surface rock average (Martin & Meybeck, 1979) as backgrounds are found to yield the most consistent results pertaining to enrichment factors, geoaccumulation
indices, contamination factors for the Kolleru Lake sediments.
The bioavailability of any toxic trace metal present in the sediment depends upon the chemical form and concentration of the metal (Kwon et al., 2001). Toxic trace metals in sediments with higher labile fractions are potential sources for mobility and bioavailability in the aquatic ecosystems (Mohiuddin et al., 2010). Chandra Sekhar et al. (2003) carried out a study on the bioaccumulation of sediment-bound heavy metals by some edible fishes of the Kolleru Lake. These researchers concluded that large fractions of Zn, Cd and Cu were associated with mobile fraction of sediment and therefore these metals showed greater bioaccumulation in fish. They further suggested that the fishes of Kolleru Lake are contaminated and are not suitable for human consumption.
Based on the results obtained in our previous study (Das Sharma & Sujatha,
2016), several measures were
the site to the lake and ecology of the area. Coming to the second question, it is envisaged that since the degree of contamination due to presence of toxic metals like Co, Cr, Cu, V and Zn range from minor to moderate (see Table4), phytoremediation of these heavy metals appears to be the most suitable option for several reasons as highlighted below.
(i)Phytoremediation is an appropriate technique if the level of contamination is low;
(ii) More than 400 plant species are presently known (Lasat, 2000; Schmidt, 2003) which have the natural tendency to accumulate very high metal concentrations;
(iii)It is an extremely cost-effective method (Garbisu & Alkorta, 2001) compared to the other remedial processes;
(iv) The method poses little imminent risk to human health or the environment;
(v)It offers a green and environmentally friendly technique and hence likely to be accepted by everyone.
With the above-cited advantages of phytoremediation, it is also significant to note that the method is simple, and it uses living green plants for removal, degradation or containment of contaminants in soils, sludges, sediments, surface water and groundwater (Cunningham & Ow, 1996; Helmisaari et al., 2007). As a follow-up action of the phytoremediation process, it is recommended that the domestic sewage and the industrial effluents originating from various anthropogenic activities (sugar factories, distilleries, tanneries, agrochemical establishments, paper mills and rice mills etc.) need to be treated on a regular basis with proper monitoring so that the heavy metal pollution of the lake sediments and waters is avoided to a great extent.
CONCLUSIONS
The results obtained in this study indicate
that the lake water is contaminated to variable degrees with certain heavy metals. These metals are chromium, copper, manganese and zinc. An assessment of sediment quality through several pollution indices (e. g., enrichment factor, geoaccumulation index, contamination factor and pollution load index) also corroborate the contamination of lake sediments with heavy metals like Co, Cr, Cu, Mn, V and Zn. The observed heavy metal contents in lake water and sediment have increased with time when compared to the one and half decade old data. Therefore these metals owe their origin to diverse nature of industrial effluents that enter the lake through different channels, besides domestic sewage and agricultural runoff. The extent of sediment contamination, however, is in its initial stage ranging from minor to moderate. These results are expected to be of significant help to future researchers in order to evaluate the relative availability of these elements to biological communities and their impact on reactions and transformations. It is satisfying that the Government of Andhra Pradesh has been trying its best for the restoration of this fragile ecosystem using various measures. However, concerted efforts are needed on local and regional scales to promote mass awareness program and save the lake from its impending disaster. This should be followed by restoration measures where research organizations, industries, government and private agencies can join and work together in harmony.
APPENDIX-A
Characterization of the extent of anthropogenic contamination is often carried out by estimating enrichment factor (EF), which provides the enrichment ratio. The EF values can be estimated using the
equation EF =
[(Cmetal/Cx)sample]/[(Cmetal/Cx)background],
immobile elements (both major and trace) have been considered by different researchers. The major immobile elements include aluminium (Chatterjee et al., 2007), iron and titanium (Zhang et al., 2007). Immobile trace metals like Sc and Zr have also been used in the estimation of EF (e. g., Blaser et al., 2000). In the present study, aluminium is chosen as immobile metal for the estimation of EF.
The geoaccumulation index (Igeo) was defined by Müller (1969) to determine the metal contamination in sediments and is expressed as Igeo = log2[ (Cn)/(1.5 × Bn)], where Cn is the measured concentration in the sample for the metal n and Bn is the background value (in shale) for the metal n. The factor 1.5 is used to account for the possible variations of background data originating from lithological variations.
Contamination factor is estimated to ascertain the level of contamination (Häkanson, 1980) and is expressed as CF = (Conc. of metal X)sample/(Conc. of metal
X)background
The pollution load index was proposed by Tomlinson et al. (1980). The pollution load index is calculated according to the equation PLI = [CF1× CF2 × CF3 ... × CFn]1/n, where n is the number of analyzed metals and CFn is the contamination factor of metal n (see equation on CF). In other words, PLI is the nth root of the product of n contamination factors (CF values).
Acknowledgements
I am thankful to Dr. A. R. Karbassi and two anonymous reviewers for critically reviewing the original submission and suggesting improvements.
REFERENCES
Amaraneni, S. R. (1997). Studies on pollution problems of Kolleru Lake with special reference to pesticides, polycyclic aromatic hydrocarbons and heavy metals. unpublished Ph.D. Thesis, Andhra University, Vishakapatnam, India.
Amaraneni, S. R. and Pillala, R. R. (2000). Environmental impact of aquaculture on Kolleru lake. Indian J. Environ. Toxicol., 10(1), 1–4.
Amaraneni, S. R. and Pillala, R. R. (2001). Concentration of pesticide residue in tissues of fish from Kolleru lake, India. Environ. Toxicol., 16(6),
550–556.
Amira, W. and Leghouchi, E. (2018). Assessment of heavy metal pollution in sediments and their bioaccumulation in Phragmites australis from Nil river (Jijel-Algeria). Global NEST Journal, 20.
Retrieved Sept. 15, 2018 from
https://journal.gnest.org/sites/default/files/Submissi ons/gnest_02488/gnest_02488_proof.pdf
APHA (1995). Standard methods for the examination of water and wastewater. 19th edition, American Public Health Association, Washington, D. C.
Azeez, P. A., Ashok Kumar, S., Choudhury, B. C., Sastry, V. N. V. K., Upadhyay, S., Reddy K. M. and Rao, K. K. (2011). Report on the proposal for downsizing the Kolleru Wildlife Sanctuary (+5 to +3 feet contour). Submitted to the Ministry of Environment and Forests, Government of India.
Retrieved Nov. 18, 2017 from
www.thehindu.com/multimedia/.../Kolleru Report9 pri 549380a.pdf .
Blaser, P., Zimmermann, S., Luster, J. and Shotyk, W. (2000). Critical examination of trace element enrichments and depletions in soils: As, Cr, Cu, Ni, Pb, and Zn in Swiss Forest Soils. Sci. Tot. Environ., 249(1-3), 257–280.
Chakravarty, M. and Patgiri, A. D. (2009). Metal Pollution Assessment in Sediments of the Dikrong River, N.E. India. J. Human Ecol., 27(1), 63–67.
Chandra Sekhar, K., Chary, N. S., Kamala, C. T., Raj, D. S. and Rao, A. S. (2003). Fractionation studies and bioaccumulation of sediment-bound heavy metals in Kolleru lake by edible fish. Environ. Intl., 29(7), 1001–1008.
Chatterjee, M., Silva, F. E. V. and Sarkar, S. K. (2007). Distribution and possible source of trace elements in the sediment cores of a tropical macrotidal estuary and their ecotoxicological significance. Environ. Intl., 33(3), 346–356.
Cunningham, S. D. and Ow, D. W. (1996). Promises and prospects of phytoremediation. Plant Physiol., 110(3), 715–719.
Das Sharma, S. and Sujatha, D. (2016). Characterization of the water chemistry, sediment 13C and 18O compositions of Kolleru Lake—a
Ramsar wetland in Andhra Pradesh, India. Environ. Monit. Assess., 188(7), 409.
Dhote, S. and Dixit, S. (2009). Water quality improvement through macrophytes—a review. Environ. Monit. Assess., 152(1-4), 149–153.
Esmaeilzadeh, M., Karbassi, A. R. and Moattar, F. (2016). Assessment of metal pollution in the Anzali Wetland sediments using chemical partitioning method and pollution indices. Acta Oceanol. Sinica, 35(10), 28– 36.
FAO (2015). Lakes and rivers key to livelihoods of millions. Food and Agriculture Organization of the United Nations. Retrieved Sept. 14, 2018 from http://www.fao.org/news/story/en/item/276122/icode/
Förstner, U. and Müller, G. (1973). Heavy metal accumulation in river sediments: a response to environmental pollution. Geoforum, 4(2), 53–61.
Freeze, R. A. and Cherry, J. A. (1979). Groundwater, Prentice Hall Inc., New Jersey, pp. 604.
Garbisu, C. and Alkorta, I. (2001). Phytoextraction: a cost-effective plant-based technology for the removal of metals from the environment. Bioresource Technol., 77(3), 229– 236.
Gupta, S. C., Rathore, G. S. and Mathura, G. C. D. (2001). Hydro-chemistry of Udaipur lakes. Indian J. Environ. Health, 43(1), 38–44.
Häkanson, L. (1980). An ecological risk index for aquatic pollution control: a sedimento-logical approach. Water Res., 14(8), 975–1001.
Hargalani, F. Z., Karbassi, A., Monavari, S. M. Azar, P. A. (2014). A novel pollution index based on the bioavailability of elements: a study on Anzali wetland bed sediments. Environmental Monitoring and Assessment, 186(4), 2329–2348.
Helmisaari, H. S., Salemaa, M., Derome, J., Kiikkilö, O., Uhlig, C. and Nieminen, T. M. (2007). Remediation of heavy metal contaminated forest soil using recycled organic matter and native woody plants. J. Environ. Quality, 36(4), 1145–1153.
Huy, N. Q., Luyen, T. V., Phe, T. M. and Mai, N. V. (2002) .Toxic elements and heavy metals in sediments in Tham Luong Canal, Ho Chi Minh City, Vietnam. Environ. Geol., 43, 836–841.
ISRO (2011). National Wetland Atlas: Andhra Pradesh. Space Applications Centre, Indian Space Research Organization, Ahmedabad, India.
Iwasaki, S. and Shaw, R. (2009). Linking human security to natural resources: Perspective from a
fishery resource allocation system in Chilika lagoon, India. Sustain. Sci., 4(2), 281–292.
Karupadam, R. J., Sarin, R. and Ajaneyulu, Y. (2003). Distribution of trace metals and organic matter in the sediments of Godavary estuary of Kakinada Bay, East coast of India. Water, Air, Soil Pollut., 150, 299– 305.
Koff, T., Vandel, E., Marzecová, A., Avi, E. and Mikomägi, A. (2016). Assessment of the effect of anthropogenic pollution on the ecology of small shallow lakes using the palaeolimnological approach. Estonian J. Earth Sci., 65(4), 221–233.
Krishna, A. K., Murthy, N. N. and Govil, P. K. (2007). Multielement Analysis of Soils by Wavelength-Dispersive X-ray Fluorescence Spectrometry. Atomic Spectroscopy, 28(6), 202– 214.
Kumar, B., Shah, R. and Mukherjee, D. (2011). Geochemical distribution of heavy metals in sediments from sewage fed fish ponds from Kolkata Wetlands, India. Chem. Speciat. Bioavail., 23(1), 24–32.
Kwon, Y. T., Lee, C. W. and Ahn, B. Y. (2001). Sedimentation pattern and sediments bioavailability in a wastewater discharging area by sequential metal analysis. Microchem. J., 68 (2–3), 135–141.
Langmuir, D. (1997). Aqueous Environmental Geochemistry, Prentice Hall, New Jersey, pp. 600.
Lasat, M. M. (2000).Phytoextraction of metals from contaminated soil: a review of plant/soil/metal interaction and assessment of pertinent agronomic issues. J.Hazard.Subst. Res., 2, 5-1–5-25.
Martin, J. M. and Meybeck, M. (1979). Elemental mass balance of materials carried by major world rivers. Marine Chem., 7(3), 173–206.
Mastan, S. A. (2014). Heavy metals concentration in various tissues of two freshwater fishes, Labeo rohita and Channa striatus. African J. Environ. Sci. Tech., 8(2), 166–170.
Mohiuddin, K.M., Zakir, H.M., Otomo, K., Sharmin, S. and Shikazono, N. (2010). Geochemical distribution of trace metal pollutants in water and sediments of downstream of an urban river. Intl. J. Environ. Sci. Tech., 7 (1), 17–28.
Müller, G. (1969). Index of geoaccumulation in sediments of the Rhine River. Geol. J., 2(3), 108–118.
Nesbitt, H. W. and Young, G. M. (1984). Prediction of some weathering trends of plutonic and volcanic rocks based on thermodynamic and kinetic considerations. Geochim. Cosmochim. Acta, 48(7), 1523–1534.
Pollution is licensed under a "Creative Commons Attribution 4.0 International (CC-BY 4.0)" Perunović, T., Stojanović, K., Kašanin-Grubin, M.,
Šajnović, ., Simić, V., Jovančićević, B. and Brčeski, I. (2015). Geochemical investigation as a tool in the determination of the potential hazard for soil contamination (Kremna Basin, Serbia). J. Serbian Chem. Soc., 80(8) 1087–1099.
Poh, S. C. and Tahir, N. M. (2017). The common pitfall of using enrichment factor in assessing soil metal pollution. Malaysian J. Anal. Sci., 21(1), 52–59.
Rao, K. N., Krishna, G. M. and Hema Malini, B. (2004). ‗Kolleru lake‘ is vanishing – a revelation through digital processing of IRS-1D LISS-III sensor data. Curr. Sci., 86(9), 1312–1316.
Rao, T. G. and Govil, P.K. (1995). Merits of using barium as a heavy absorber in major element analysis of rock samples by XRF: new data on ASK-1 and ASK-2 reference samples. Analyst, 120(5), 1279 –1282.
Rudnick, R. L. and Gao, S. (2003). Composition of the continental crust. (In R. L. Rudnick (Ed.), Treatise in Geochemistry, v. 3, pp. 1-64, Elsevier, Amsterdam).
Salomons, W. and Förstner, U. (1984). Metals in the Hydrocycle. Springer-Verlag, pp. 349.
Schmidt, U. (2003). Enhancing phytoextraction: the effect of chemical soil manipulation on mobility, plant accumulation and leaching of heavy metals. J. Environ. Quality, 32(6), 1939–1954.
Sinex, S.A. and Helz, G.R. (1981). Regional geochemistry of trace elements in Chesapeake Bay sediments. Environ. Geol., 3(6), 315–323.
Stephenson, M., Turner, G., Pope, P., Knight, A. and Tchobanoglous, G. (1980). The use and potential of aquatic species for wastewater treatment. Publ. No. 65, California State Water Resources Control Board, Sacramento, CA.
Sutherland, R. A. (2000). Bed sediment-associated trace metals in an urban stream, Oahu, Hawaii. Environ. Geol., 39(6), 611–627.
Taylor, S. R. (1964). Abundance of chemical elements in the continental crust: a new table. Geochim. Cosmochim. Acta, 28(8), 1273–1285.
Taylor, S. R. and McLennan, S. M. (2001). Chemical Composition and Element Distribution in the Earth‘s Crust. (In Encyclopedia of Physical Sciences and Technology, v. 2, 697–719, Academic Press).
Tessier, A., Cambell, P. G. C. and Bission, M. (1979). Sequential extraction procedure for the
speciation of particulate trace metals. Anal. Chem., 51, 844– 851.
Tomlinson, D. C., Wilson, J. G., Harris, C. R. and Jeffrey, D. W. (1980). Problems in the assessment of heavy-metal levels in estuaries and the formation of a pollution index. Helgoland Marine Res., 33(1-4), 566– 575.
Turekian, K. K. and Wedepohl, K. H. (1961), Distribution of the elements in some major units of the earth‘s crust. Bull. Geol. Soc. Am., 72(2), 175–192. Ure, A. M. and Berrow, M. L. (1982). The elemental constituents of soils. (In Bowen, H. J. M. (Ed.), Environmental Chemistry, v. 2, pp. 94 – 204, The Royal Society of Chemistry).
USEPA (1983). Methods for Chemical Analysis of Water and Wastes. EPA-600/4-79-020, Cincinnati, Ohio, USA.
Vaezi, A. R., Karbassi, A. R., Valavi, S. and Ganjali, M. R. (2015a). Ecological risk assessment of metals contamination in the sediment of the Bamdezh wetland, Iran. Intl. J. Environ. Sci. Tech., 12(3), 951–958.
Vaezi, A. R., Karbassi, A. R. and Fakhraee, M. (2015b). Assessing the trace metal pollution in the sediments of Mahshahr Bay, Persian Gulf, via a novel pollution index. Environ. Monit. Assess., 187(10), 613.
Vaezi, A. R., Karbassi, A. R., Habibzadeh, S. K., Heidari, M. and ValikhaniSamani, A. R. (2016). Heavy metal contamination and risk assessment in the riverine sediment. Indian J. Geo-Marine Sci., 45 (8), 1017–1023.
Vijayalakshmi, B. B. R. G. and Brahmaji Rao, P. (2017). Assessment of Heavy Metal distribution of Water and Sediments in Kolleru Lake, A.P. IOSR J. Pharm. Biol. Sci., 12(4), 40–46.
Zhang, C., Qiao, Q., Piper, J.D.A. and Huang, B. (2011). Assessment of heavy metal pollution from a Fe-smelting plant in urban river sediments using environmental magnetic and geochemical methods. Environ. Pollut., 159, 3057–3070.
Zhang, L. P., Ye, X. and Feng, H. (2007). Heavy metal contamination in Western Xiamen Bay sediments and its vicinity, China. Mar. Pollut. Bull., 54(7), 974–982.