ECONOMICS AND MARKETING
The Impacts of U.S. Cotton Programs on the World Market:
An Analysis of Brazilian WTO Petition
Suwen Pan*, Samarendu Mohanty, Don Ethridge, and Mohamadou Fadiga
S. Pan, S. Mohanaty, D. Ethridge, and M. Fadiga, Department of Agricultural and Applied Economics, Texas Tech
University, Lubbock, TX 79409 *Corresponding author: [email protected]
ABSTRACT
This manuscript analyzed the effects of the elimination of U.S. cotton subsidy programs on the world cotton market using a partial equilib-rium model of the world fiber market. Removal of U.S. programs would increase world cotton prices by approximately 2% in the initial years; however, the impacts are mitigated after a few years after program elimination as the major cotton producing and exporting countries expand their production. Overall, the results indicate that U.S. cotton production and export would decline by an average of 4.5% and 5.0%, respectively. At the same time, Brazil and Australia would expand their cotton acreage and increase exports by about 2%, and 1%, respectively. Unlike Brazil and Australia, Africa is unlikely to take advantage of the reduction in U.S. cotton exports, with less than 1% increase in their exports.
T
he impact of commodity programs on the world market has been subject to much debate in recent years. These debates stem from a desire by the international community to create a freer trading environment, which requires a reduction of the effects of distorting policies by exporting and importing countries. When the Farm Security and Rural Investment Act of 2002 became law, the program came under scrutiny because provisions, such as the countercyclical payments, have the potential to stimulate production (Sumner, 2003).In the case of cotton, this was the basis of the ar-gument that led Brazil with the support of Australia and the West and Central African (WCA) countries to file a petition challenging the U.S. cotton pro-grams at the September 2003 meeting of the WTO settlement body. Brazil alleged that U.S. cotton
subsidies, such as marketing loans, export cred-its, commodity certificates, direct payments, and counter-cyclical payments, were depressing world prices and were injurious to Brazilian farmers. The WCA countries of Benin, Burkina Faso, Mali, and Chad also claimed they were losing export earnings of US $1 billion a year (including both direct and indirect costs) as a result of subsidies by the United States and the European Union (BBMC, 2003). The WCA countries argued that their cotton production increased from 0.89 to 1.5 million tonnes (metric tons; Mg) and exports increased from 0.6 to 1.1 Mg between 1992/93 and 2002/03, but their export rev-enues declined during the same period due to lower prices. Although a combination of factors, includ-ing a sluggish world economy, higher yields, and lower polyester prices, played a role in lower cotton prices worldwide, the WCA countries perceived U.S. subsidies as the main reason for their export earning losses (BBMC, 2003). Despite mixed find-ings from recent studies, the WTO issued a ruling in April 2004 stating that the USA had violated its WTO obligations by granting excessive subsidies to its cotton growers between 1999 and 2002, which depressed prices at the expense of growers from Brazil and other countries.
The cotton subsidy issue has been investigated and debated since it was first proposed by Brazil on 27 Sept. 2002 (ICAC, 2002; Sumner, 2003; Tiller et al., 2003; Goreux, 2004). The International Cotton Advisory Committee (ICAC, 2002) estimated the effects of the U.S. cotton subsidy on the international cotton price using three different models: the ICAC and FAO Supply model, the ICAC World Textile De-mand Model, and the ICAC Price Model. The supply model was used to estimate production levels without subsidies during the period 1999/00 to 2001/02. The lower supplies were fed into the ICAC price model to get the price increases of 6 cents (10.5%), 12 cents (28.7%), and 22 cents (43.95%) in 1999/00, 2000/01, and 2001/02, respectively.
price model to conclude that a lower level of demand would lessen the initial impact by 1 cent (1.75%) in 1999/00, 2 cents (4.78%) in 2000/01, and 6 cents (11.99%) in 2001/02. In this study, the supply and demand effects do not simultaneously determine equilibrium price. In addition, supply changes in the rest of the world due to higher prices are not taken into account in this model. Watkins (2002) used the ICAC results to estimate that sub-Saharan exporters lost $302 million in 2001 as a direct consequence of the U.S. cotton subsidies.
More recently, Sumner (2003) quantified the effects of U.S. cotton subsidies using an econo-metric simulation model based on key supply and demand elasticities from the Food and Agricultural Policy Research Institute (FAPRI) policy simulation model. The model used by Sumner is different from the actual FAPRI model, especially in how subsi-dies were incorporated into the supply equation (USTR, 2003). The results suggested that during the marketing years 1999 to 2002, the USA would have exported an average of 41.2% less cotton, and the world cotton price would have increased by 12.6% without domestic and export programs for cotton. For the marketing years 2003 to 2007, the world cotton price would have increased by 10.8% with the removal of U.S. cotton subsidies. The study offered an explanation of the various cotton programs and how they were treated in the model; however, it is difficult to verify the accuracy of the results without a discussion of the structure of the FAPRI world cotton model used for the analysis. The model also does not allow for inter-fiber sub-stitution between cotton and man-made fibers at the mill level, which resulted in the over estimation of the effects of the U.S. cotton programs. The amount of the over estimation depends on mill demand elasticity estimates.
Apart from the above mentioned studies focusing on the effects of the U.S. cotton programs, few other studies have also attempted to measure the effects of complete removal of domestic subsidies for all com-modities and all countries. FAPRI (2002) measured the impacts of removal of all subsidies and tariffs using the FAPRI world crops and livestock model. The results indicated that removal of subsidies all over the world would lead to a 13% increase in average cotton price between 2001/02 and 2010/11. FAPRI results can not be accurately verified because the report does not contain information on model structure and parameter estimates. Recently,
Poo-nyth et al. (2004) estimated the long-term impacts of the complete elimination of domestic subsidies and tariffs and found that the world price of cotton would appreciate between 3.1% and 5.0%, based on different supply and demand elasticities. The study claimed that 66% of the distortions on world cotton market are from the U.S. subsidy.
The majority of the studies discussed above used either an existing model, such as FAPRI and GTAP, or developed a reduced form model using demand and supply elasticities borrowed from the other stud-ies to carry out the simulation. In addition, none of these studies allow inter-fiber substitution between cotton and man-made fibers at the mill level. Absence of proper linkage between cotton and man-made fiber would definitely overestimate or underestimate the policy effects.
The purpose of this study is to estimate the effects of the removal of the U.S. cotton programs on the world market, particularly on international cotton prices, using a partial equilibrium structural econometric model of the world fiber market de-veloped by Pan et al. (2004). Partial equilibrium structural policy simulation models have been ex-tensively used in the past for policy analysis (Fuller et al., 2002; koo, 2002; Meyer, 2002, Sumner, 2003; ICAC, 2002; Fabiosa et al., 2005). The partial equilibrium model used in this study contains three main characteristics that distinguish it from prior models. Unlike the past efforts, this model allows inter-fiber substitution between cotton and man-made fibers at the mill level and solves man-man-made fiber prices endogenously in the model. Secondly, major cotton producing and trading countries/re-gions are included in the model to avoid aggregation bias. For major countries, such as the United States, China, and India, regional supply responses within these countries are estimated in order to account for heterogeneity in growing conditions arising out of climatic differences and availability of water and other natural resources that influence the mix of crops in each of the regions. This is important be-cause elimination of U.S. cotton programs is likely to have varying effects on cotton producing regions and aggregate supply response may overestimate or underestimate the policy effects. Finally, this model was estimated using more up to date data and re-cent policies, such as Chinese WTO commitments, Agreement on Textile and Clothing (ATC).
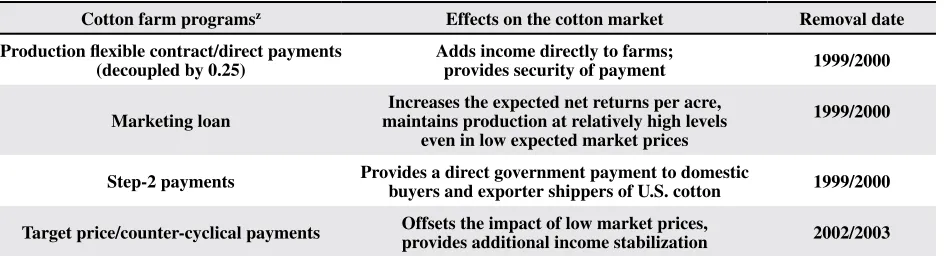
produc-tion flexibility contract payments/direct payments, counter-cyclical payments, step-2 payments, and marketing loan benefits, to a baseline that includes current farm programs (Table 1). Following the ap-proach used by Sumner (2003), we have assumed production flexibility contract (PFC) payments for the period 1997 to 2001, and direct payments from 2002 to 2007 to be 25% coupled, i.e. 25% of the per pound PFC or direct payments were added to the expected net returns. Similarly, counter cyclical payments (CCPs) were assumed to be 50% coupled. The domestic and export Step-2 payments enter the mill use and export equation as a subsidy which lowers the effective buying price for miller and exporters. Thus, removal of step-2 payments would reduce domestic mill use and exports. Both of these programs (marketing loan benefits and step 2 payments) were applied for the entire period (99/00 to 07/0). A brief description of each of the programs is provided.
Direct payments. Under the 2002 Farm Act, farmers and eligible landowners receive annual fixed payments. The amount of the direct payment is equal to the product of the payment rate, payment acres, and payment yield. The 2002 Farm Act sets the payment rate for upland cotton at 3.00 cents per kilogram (6.67 cents per pound) for crop years 2002 to 2007. Payment acreage is set at 85% of base acre-age. Payment yields for direct payments remain at levels specified by the 1996 Farm Act.
Counter-cyclical payments. Counter-cyclical income support payments (CCP) were developed to provide a counter-cyclical income safety net to replace most ad hoc market loan assistant payments that were provided to farmers during 1998 to 2001. Payments are based on historical production and are not tied to current production. CCP are available for covered commodities whenever the effective price is less than the target price. The payment amount is
equal to the product of the payment rate, the payment acres (85% of base acres), and the payment yield. Counter-cyclical payments are available to contract holders whenever the target price for a program crop is greater than the effective price. The effective price is equal to the sum of 1) the higher of the national average farm price for the marketing year, or the national loan rate for the commodity and 2) the di-rect payment rate for the commodity. The payment amount for a farmer is the product of the payment rate, the payment acres, and the payment yield.The upland cotton target price is 33.66 cents per kilogram (72.4 cents per pound) for the duration of the farm bill. The payment for an individual cotton farmer is determined as follows:
Payment ratecotton = (target price)cotton – (direct
payment rate)cotton – (higher of commodity price or
loan rate)cotton
CCPcotton = ([Base acres]cotton x 0.85) x (payment
yield)cotton x (payment rate)cotton
Marketing assistance loan and loan deficiency payment programs. The Farm Service Agency (FSA) administers commodity loan programs with marketing loan provisions for upland cotton through the Commodity Credit Corporation (CCC). CCC loan programs allow producers of designated crops to receive a loan from the government at a com-modity-specific loan rate per unit of production by pledging production as loan collateral. After harvest, a farmer may obtain a loan for all or part of the new production. These loans may be repaid in three ways: at the loan rate plus interest costs (CCC interest cost of borrowing from the U.S. Treasury plus 1%); by forfeiting the pledged crop to the CCC at loan ma-turity; or at the alternative loan repayment rate. The marketing loan rate for upland cotton is 23.59 cents per kilogram (52 cents per pound) for 2002-2007.
Table 1. Brief description of cotton programs in the United States
Cotton farm programsz Effects on the cotton market Removal date Production flexible contract/direct payments
(decoupled by 0.25) Adds income directly to farms; provides security of payment 1999/2000
Marketing loan maintains production at relatively high levels Increases the expected net returns per acre, even in low expected market prices
1999/2000
Step-2 payments Provides a direct government payment to domestic buyers and exporter shippers of U.S. cotton 1999/2000
Target price/counter-cyclical payments Offsets the impact of low market prices, provides additional income stabilization 2002/2003
Step 2 payments.
Step 2 payments, sometimes
referred to as the “user marketing certificate
pro-gram,” are made to U.S. cotton users and
export-ers when U.S. prices are higher than world prices.
They are intended to bridge the price gap and
keep U.S. cotton competitive.
Step 2 payments are issued to exporters and domestic mill users of upland cotton in a week following a consecutive 4-wk period when the lowest U.S.-northern Europe price quotation exceeds the northern Europe price quotation by more than 0.57 cents per kilogram (1.25 cents per pound), and the AWP does not exceed 134% of the U.S. loan rate. Payments are made in cash or certificates to do-mestic users on documented raw cotton consumption, and to exporters on documented export shipments, at a payment rate equal to the difference between the U.S.-northern Europe price and the U.S.-northern Europe price during the fourth week of the period, minus 0.57 cents per kilogram (1.25 cents per pound) (the threshold). The 2002 Farm Act delayed the 1.25-cent threshold until 1 Aug. 2006. Consequently, Step 2 payment calculations for the 2002 to 2005 marketing years are based on the difference between the U.S.-northern Europe price and the northern Europe price.Conceptual framework. A graphic representa-tion of the effects of the U.S. cotton programs on the world market is shown in Figure 1. note that trans-portation cost effects are ignored for simplicity. Panel A presents the domestic cotton supply and demand in the United States. U.S. cotton programs include the marketing loan program, direct payments, counter-cy-clical payments that use a target price, and marketing certificates through step 2 payments. The loan rate
acts as a minimum guaranteed price for farmers, so farmers do not respond to market price if it is below the loan rate, causing the supply curve to be vertical at the loan rate level (PLR). The loan rate does not act
as a floor for the market because marketing loan and LDP payment subsidies absorb the difference between the loan rate and the world price, allowing the market price to fall to a level (Pw) to clear the market. The net
effects of these programs are to expand cotton exports from free market level of LM to OQ.
In panel C, rest of the world (ROW) excess demand is shown separately for China and others. The Chinese market is separated from the rest of the world because of the relative importance of Chinese trade and policies on the world market. As part of its WTO commitments, China has established a tariff-rate-quota (TRQ) for cotton imports. In-quota import levels are set to rise from 740,000 metric tons in 2002 to 890,000 metric tons in 2004 with a tariff of 1%. The out-of-quota tariff, which was 76% above 780,000 metric tons in 2002, is scheduled to drop to 67% above 820,000 metric tons in 2003, 58% above 860,000 metric tons in 2004, 49% above 890,000 metric tons in 2005, and 40% above 890,000 metric tons in 2006 (USDA-FAS, 2002). The presence of a TRQ makes the Chinese import demand discontinuous at the quota level. The vertical line seg-ment BC on Chinese excess demand represents the level of the TRQ, below and beyond for which there is a demand response by Chinese importers.
Panel B displays the world market equilibrium with excess supply derived from the United States and excess demand from the rest of the world. The United States faces a kinked rest of the world excess
Price Price
PLR
Pw1
Pd
Dd
Sd
O
(A) United States (B) World market (C) Rest of the world
L
K
B
C
S
Q
L
M
Xc Xs
EDrow EDchi EDrow-chi
QTRQ
ESus
PD = Pw
demand function due to the presence of TRQ in China and the rest of the world faces a kinked U.S. excess supply function because of the marketing loan program in the United States.
With the representation in Figure 1, removal of the U.S. cotton subsidy programs would decrease U.S. ex-ports from OQto LM and raise the world price from Pw
to Pw1. Cotton production response in the United States
returns to the original supply function rather than the kinked supply function induced by policy payments. This results in upward shift of the origination of the excess supply function from S to k in panel B.
If the representation of markets depicted in Figure 1 is reasonably accurate (e.g., if PLR is above
world price, the U.S. is a dominant exporter in a “free trade” world, etc.), then expected effects of eliminating U.S. support programs are to increase world price, decrease U.S. production and exports, increase ROW production and excess supply, and decrease global trade and consumption of cotton. The conceptual analysis does not, and cannot, reveal the magnitude of these expected effects. The magnitudes are determined by the various supply and demand elasticities in these markets. This justifies the fol-lowing model and empirical analysis.
MATERIALS AND METHODS
A partial equilibrium world fiber model (Pan et al., 2004) was used to estimate the effects of U.S. cotton programs on the world market. The unique characteristics of this model compared with others include incorporation of regional supply response of cotton, substitutability between cotton and competing fibers, and linkage between raw fiber and textile sec-tors. The model includes 24 major cotton importers and exporters: (1) Asia (China, India, Pakistan, Tai-wan, South korea, Japan and Other Asia); (2) Africa (Egypt and Other Africa); (3) north America (Mexico, United States, and Canada); (4) Latin America (Brazil, Argentina, and Other Latin America); (5) Oceania (Australia); (6) Middle East (Turkey and Other Middle East); (6) Former Soviet Union (Uzbekistan, Russia, and other former Soviet Union countries); (7) Europe (European Union, Central and Eastern Europe, and Other Western Europe).
As shown in Figure 2, the representative country model includes supply, demand, ending stock, and market equilibrium for cotton and man-made fibers. Cotton production was modeled by estimating sepa-rate acreage and yield equations. Similarly, man-made
Cellulosic Production Cellulosic Utilization
Cellulosic Capacity World Cellulosic
Price Cellulosic
Price Cotton Market
Equilibrium Cotton
Imports
Beginning Stock Cotton Ending Stock Cotton
Production ConsumptionCotton
Domestic Cotton Price Cotton
Area Harvested Yield
Cotton Exports
Finished Products Production
Finished Products Consumption Finished Products
Trade Synthetic
Production Man-madeFiber Production Synthetic
Utilization
Synthetic Capacity World Synthetics
Price
Synthetics
Price Competing fiber prices enter the consumption equations with cross prices weighted by consumption to create a cross price index.
Manmade Fiber
Mill Use Mill UseWool Cotton
Mill Use
A-Index A-Index
Manmade Fiber Trade
fiber supply was estimated by modeling capacity and utilization separately. Following Coleman and Thig-pen (1991), cotton demand was estimated following a two-step process. In the first step, total textile fiber consumption was estimated and in the second step al-locations among various fibers, such as cotton, wool, and polyester (representing man-made fibers), were estimated based on relative prices. Cotton A-index and polyester prices were endogenously solved in the model by equalizing world exports and imports.
The U.S. model includes regional acreage and yield response with cotton production divided into four regions: Delta, Southeast, West, and Southwest (irrigated and non-irrigated). On the demand side, U.S. textile consumption was disaggregated into apparel, floor covering, home textiles, and others following Meyer (2002). Similarly, Chinese and Indian cotton supply responses were estimated in a regional framework. The Chinese cotton-produc-ing area was segregated into four regions in order to account for heterogeneity in growing conditions arising out of climatic differences and availability of water and other natural resources that influence the mix of crops in each of the regions. The four regions include the Xinjiang, the Yellow River Valley, the Yangtze River Valley, and the rest-of-China. Due to the domestic policy distortion in the cotton market, both U.S. farm price and Chinese procurement price
were endogenously solved. For other countries, domestic prices were transmitted by A-index. The transmission rate is as high as 0.97 for Brazil, and as low as 0.41 for Africa.
The data set used in this study was compiled from various sources, including Food and Agricultural Policy Institute (FAPRI, 2004) for the historical and projected macro variables (real GDP, exchange rate, population, and GDP deflator); Production, Supply & Demand (PS&D) database of the Foreign Agricultural Service (FAS), U.S. Department of Agriculture for cotton acreage, yield, production, mill use, ending stocks, and trade; Cotton and Wool Situation and Outlook Yearbook (USDA-ERS, 1995-2004)for U.S. cotton price, polyester price, and other fiber prices; Food and Agriculture Organization (FAO) World Fiber Consumption Survey and Fiber Organon (Fiber Organon, 1980-2004) for the fiber mill consumption and man-made fiber production data; and Chinese Statistics Yearbook (nSBC, 1980-2004a), China Industrial Economic Statistical Yearbook (nSBC, 1980-2004b),andChinese Rural Statistical Yearbook (nSBC, 1980-2004c) for Chinesetextile price index and food price index, cotton price, man-made fiber, and trade of textile and man-made fibers.
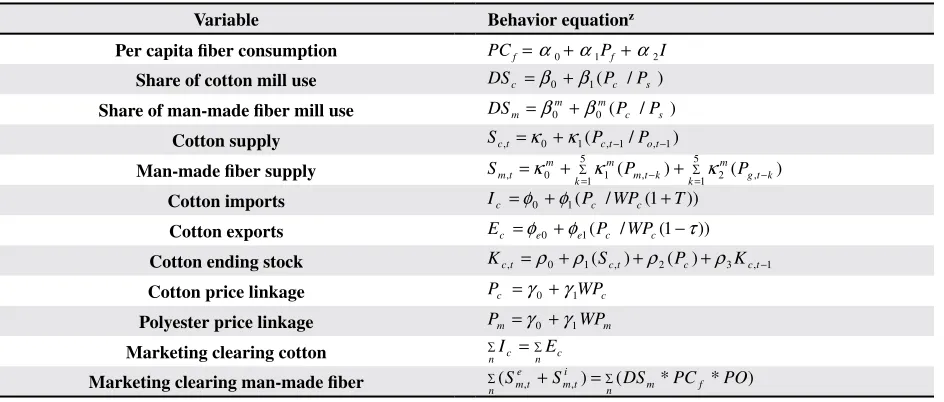
A stylized model specification for a represen-tative country is presented in Table 2. The model specifies per capita fiber consumption as a function
Table 2. Standard specifications of behavioral equations
Variable Behavior equationz
Per capita fiber consumption Share of cotton mill use Share of man-made fiber mill use
Cotton supply Man-made fiber supply
Cotton imports Cotton exports Cotton ending stock Cotton price linkage Polyester price linkage Marketing clearing cotton Marketing clearing man-made fiber
of the fiber price and per capita income. In the second stage, total fiber production was allocated among various fibers based on relative prices. In the sup-ply side, cotton acreage generally was specified as a function of own and competing crop expected net returns or prices, and cotton yield was dependent on cotton price and time trend to capture technological change. Expected net return (EnR) in the United States was calculated as follows:
EnR = E[EPit]*E[Yit]-cost of production,
where E[Yit] is the expected yield determined by the
historic relationship between yield and time trend. Following Britt (2002), the expected market price (E[EPit]) was calculated as follows:
EPit = PFit*RPit+lag(PMit)*Pnit, ,
where PFit is effective support price for upland
cotton, RPit is program participation rate indicating
the percentage of acreage complying with the farm program, PMit was the marketing year average
farm price for upland cotton, Pnit was program
participation rate indicating the percentage of acreage not complying with the farm program. The PFit were determined as follows:
PFit = W*(PSit+0.5*GPit)+0.25*DPit,
where PSit = LRit if LRit ≥ lag(PMit); else PSi t
= lag(PMit). LRit was the loan rate, GPit was the
deficiency payment rate per pound from 1974 to 1995 and counter cyclical payments from 2002, DPit
was the direct payments from 1996, and w represents the percentage of planted acreage on which a complying producer could receive support. Since loan deficiency payments are based on the adjusted world price, it would have been more accurate to use it in calculating the effective world price rather than farm price; however, the model does not endogenously solve for adjusted world price, which makes it difficult to include it in the effective price calculation. high correlation between the adjusted world price and farm price (0.95 for 1986 to 2004) makes the farm price an acceptable alternative to use in the expected net return calculation.
Following Meyer (2002), man-made fibers production was modeled separately as capacity and utilization. The capacity equation was specified as a function of man-made fibers and crude oil prices over the past five years, whereas utilization rate was dependent on more recent prices of man-made fibers and crude oil prices. Exports and imports equations
were specified as function of domestic and interna-tional prices. For import equations, internainterna-tional prices were calculated by converting world price in domestic currency equivalent after adding appropriate tariffs. Similarly, for export equations, international prices were calculated by converting world representative price into domestic currency equivalent. Finally, the ending stock equation was specified as domestic cot-ton price, cotcot-ton production, and beginning stock. For more information on parameter estimates and diagnostic statistics, please see World Fiber Model Documentation by Pan et al. (2004).
Table 3 contains income elasticities for the per capita textile consumption equations and own and cross price elasticities for cotton mill demand equations. Income elasticities range from 0.11 to 0.69, and are lowest for South korea and highest for China. Most of the emerging markets, such as China, India, Brazil, and Mexico, have income elasticities higher than 0.5. At the mill level, cotton was very responsive to its own price in most of the Asian and African countries/regions.
Table 3. Elasticity of income from textile consumption and elasticity of price from cotton mill use for major coun-triesz
Countries Income elasticityfor textile Price elasticity Cotton Polyester
US 0.15 -0.24 0.07
Australia 0.13 -0.05 0.00
South Korea 0.11 -0.57 0.24
Taiwan 0.11 -0.50 0.35
Japan 0.14 -0.57 0.37
EU-15 0.12 -0.39 0.15
Mexico 0.58 -0.27 0.10
Brazil 0.53 -0.15 0.12
China 0.69 -0.57 0.16
India 0.56 -0.44 0.10
Pakistan 0.52 -0.28 0.18
Africa 0.55 -0.74 0.24
World 0.30 -0.28 0.15
z Calculated by authors.
long-run acreage response elasticities range from 0.21 to 1.15, with the highest in Australia. The relatively large elasticities for Mexico, Australia, and Brazil re-flect greater flexibility and choice in alternative crops production (Coleman and Thigpen, 1991).
deficiency payments, and Step 2 payments. For the simulation, all of the five U.S. cotton programs were eliminated starting from 1999/00, while the rest of the world was allowed to react to the resulting price signals. The effects of program eliminations were measured by comparing supply, demand, and trade indicators before and after elimination of these programs.
RESULTS
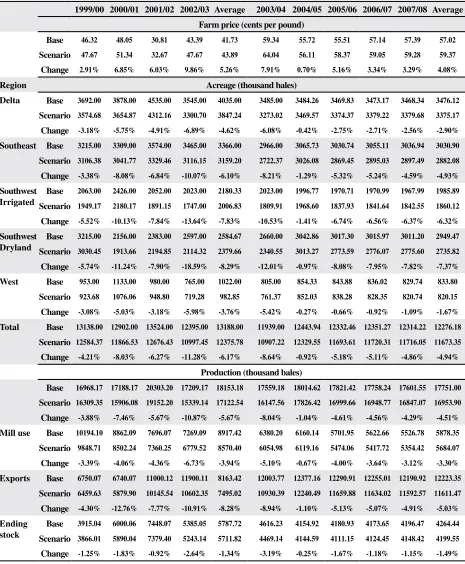
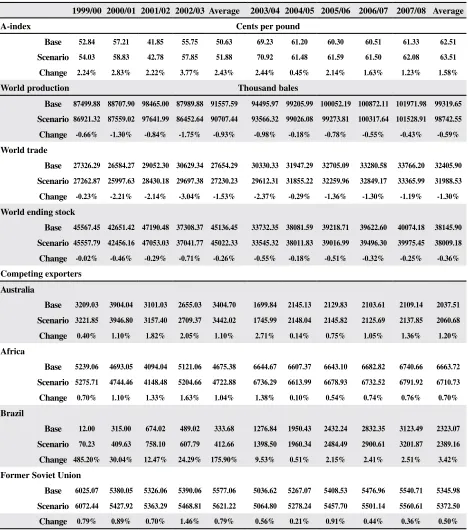
Simulation results are reported in Tables 5 through 7. Table 5 shows effects of U.S. program elimination on U.S. farm price, acreage, production, mill use, and exports. For the historical period between 1999/00 to 2002/03, U.S. cotton producers on average would have produced 5.67% less than actual production. Among regions, the Southwest non-irrigated and irrigated had the biggest drop in cotton acreage followed by South-east and the Delta regions. Lower production raised the domestic price by 5.26% on average with highest increase in 2002/03. higher domestic price and lower production lowered U.S. cotton exports by an average of 8.28% during the same period. The average world price of cotton (represented by Cotlook A-Index price) during the period 1999/00 to 2002/03 would have been 2.43% higher with a range between 2.22% and 3.77% (Table 6). Among the exporting countries, Brazil gained the most in percentage followed by Australia and Africa. The effects of the U.S. cotton programs on world price were found to be similar to Poonyth et al. (2004) and Tokarick (2003) but significantly lower than Sumner (2003) and ICAC (2002). For example, Sumner (2003) reported that the world price of cotton on average would have been 12.55% higher without U.S. cotton programs compared with 2.43% in this study during the period 1999/00 to 2002/03.
For the period between 2003/04 and 2007/08, the effects of the removal of U.S. cotton programs were similar but smaller in magnitude. In the absence of cotton programs, the world price of cotton in 2003/04 would have been 2.44% higher because of 8% less production in the United States in response to the low market price in 2002/03 (Tables 5 & 6). But U.S. production in 2004/05 would have been more or less the same as the baseline level (17.8 million bales com-pared with 18 million bales in the baseline) because of strong market prices in 2003/04. Farmers in the U.S. would have produced 17.8 million bales compared with the baseline production of 18.0 million bales in 2004/05 because of strong market prices in 2003/04. Farmers responded to weaker market prices in 2005/06
Table 4. Cotton price transmission and supply elasticityz
Countries Regions Domestic –price wrt A-index
Acreage response
Short-run Long- run
USA Delta 0.18
Southeast 0.16
Southwest
Irrigated 0.31
Southwest
Dryland 0.37
West 0.42
Australia 0.93 0.52 1.15
Brazil 0.97 0.50 0.74
China Yellow River 0.11 0.21 Yantze
River 0.10 0.22
Southwest 0.11 0.30
Africa 0.41 0.11 0.58
India 0.75
North 0.12 0.23
West 0.12 0.23
South 0.16 0.17
Eu-15 0.96 0.44 1.05
Mexico 0.87 0.54 0.91
Pakistan 0.53 0.13 0.26
Argentina 0.76 0.24 0.48
Former Soviet
Union 0.79 0.25 0.28
z Calculated by authors.
Table 5. Effects of the elimination of U.S. cotton programs on the U.S. cotton market
1999/00 2000/01 2001/02 2002/03 Average 2003/04 2004/05 2005/06 2006/07 2007/08 Average Farm price (cents per pound)
Base 46.32 48.05 30.81 43.39 41.73 59.34 55.72 55.51 57.14 57.39 57.02
Scenario 47.67 51.34 32.67 47.67 43.89 64.04 56.11 58.37 59.05 59.28 59.37
Change 2.91% 6.85% 6.03% 9.86% 5.26% 7.91% 0.70% 5.16% 3.34% 3.29% 4.08%
Region Acreage (thousand bales)
Delta Base 3692.00 3878.00 4535.00 3545.00 4035.00 3485.00 3484.26 3469.83 3473.17 3468.34 3476.12
Scenario 3574.68 3654.87 4312.16 3300.70 3847.24 3273.02 3469.57 3374.37 3379.22 3379.68 3375.17
Change -3.18% -5.75% -4.91% -6.89% -4.62% -6.08% -0.42% -2.75% -2.71% -2.56% -2.90%
Southeast Base 3215.00 3309.00 3574.00 3465.00 3366.00 2966.00 3065.73 3030.74 3055.11 3036.94 3030.90
Scenario 3106.38 3041.77 3329.46 3116.15 3159.20 2722.37 3026.08 2869.45 2895.03 2897.49 2882.08
Change -3.38% -8.08% -6.84% -10.07% -6.10% -8.21% -1.29% -5.32% -5.24% -4.59% -4.93%
Southwest Base 2063.00 2426.00 2052.00 2023.00 2180.33 2023.00 1996.77 1970.71 1970.99 1967.99 1985.89
Irrigated Scenario 1949.17 2180.17 1891.15 1747.00 2006.83 1809.91 1968.60 1837.93 1841.64 1842.55 1860.12
Change -5.52% -10.13% -7.84% -13.64% -7.83% -10.53% -1.41% -6.74% -6.56% -6.37% -6.32%
Southwest Base 3215.00 2156.00 2383.00 2597.00 2584.67 2660.00 3042.86 3017.30 3015.97 3011.20 2949.47
Dryland Scenario 3030.45 1913.66 2194.85 2114.32 2379.66 2340.55 3013.27 2773.59 2776.07 2775.60 2735.82
Change -5.74% -11.24% -7.90% -18.59% -8.29% -12.01% -0.97% -8.08% -7.95% -7.82% -7.37%
West Base 953.00 1133.00 980.00 765.00 1022.00 805.00 854.33 843.88 836.02 829.74 833.80
Scenario 923.68 1076.06 948.80 719.28 982.85 761.37 852.03 838.28 828.35 820.74 820.15
Change -3.08% -5.03% -3.18% -5.98% -3.76% -5.42% -0.27% -0.66% -0.92% -1.09% -1.67%
Total Base 13138.00 12902.00 13524.00 12395.00 13188.00 11939.00 12443.94 12332.46 12351.27 12314.22 12276.18
Scenario 12584.37 11866.53 12676.43 10997.45 12375.78 10907.22 12329.55 11693.61 11720.31 11716.05 11673.35
Change -4.21% -8.03% -6.27% -11.28% -6.17% -8.64% -0.92% -5.18% -5.11% -4.86% -4.94%
Production (thousand bales)
Base 16968.17 17188.17 20303.20 17209.17 18153.18 17559.18 18014.62 17821.42 17758.24 17601.55 17751.00
Scenario 16309.35 15906.08 19152.20 15339.14 17122.54 16147.56 17826.42 16999.66 16948.77 16847.07 16953.90
Change -3.88% -7.46% -5.67% -10.87% -5.67% -8.04% -1.04% -4.61% -4.56% -4.29% -4.51%
Mill use Base 10194.10 8862.09 7696.07 7269.09 8917.42 6380.20 6160.14 5701.95 5622.66 5526.78 5878.35
Scenario 9848.71 8502.24 7360.25 6779.52 8570.40 6054.98 6119.16 5474.06 5417.72 5354.42 5684.07
Change -3.39% -4.06% -4.36% -6.73% -3.94% -5.10% -0.67% -4.00% -3.64% -3.12% -3.30%
Exports Base 6750.07 6740.07 11000.12 11900.11 8163.42 12003.77 12377.16 12290.91 12255.01 12190.92 12223.35
Scenario 6459.63 5879.90 10145.54 10602.35 7495.02 10930.39 12240.49 11659.88 11634.02 11592.57 11611.47
Change -4.30% -12.76% -7.77% -10.91% -8.28% -8.94% -1.10% -5.13% -5.07% -4.91% -5.03%
Ending Base 3915.04 6000.06 7448.07 5385.05 5787.72 4616.23 4154.92 4180.93 4173.65 4196.47 4264.44
stock Scenario 3866.01 5890.04 7379.40 5243.14 5711.82 4469.14 4144.59 4111.15 4124.45 4148.42 4199.55 Change -1.25% -1.83% -0.92% -2.64% -1.34% -3.19% -0.25% -1.67% -1.18% -1.15% -1.49% and reduced cotton acreage by more than 5% relative
to the baseline level. Similar to the earlier results, the Southwest region had the biggest drop in cotton acre-age followed by Southeast and Delta regions. Within the Southwest, non-irrigated acreage was estimated to decline by 8% in 2005/06 compared with a 6.7%
Cotton A-index price was estimated to rise by more than 2% in 2005/06 due to lower exports of 631,030 bales (5.13%) from the United States (Table 6). The decrease in U.S. exports reflects the net change in U.S. production, consumption, and inventories. Foreign producers responded to these higher prices by expanding their cotton production and exports starting from 2006/07. Brazil was the
Table 6.Effects of elimination of U.S. cotton programs on world cotton market
1999/00 2000/01 2001/02 2002/03 Average 2003/04 2004/05 2005/06 2006/07 2007/08 Average
A-index Cents per pound
Base 52.84 57.21 41.85 55.75 50.63 69.23 61.20 60.30 60.51 61.33 62.51
Scenario 54.03 58.83 42.78 57.85 51.88 70.92 61.48 61.59 61.50 62.08 63.51
Change 2.24% 2.83% 2.22% 3.77% 2.43% 2.44% 0.45% 2.14% 1.63% 1.23% 1.58%
World production Thousand bales
Base 87499.88 88707.90 98465.00 87989.88 91557.59 94495.97 99205.99 100052.19 100872.11 101971.98 99319.65
Scenario 86921.32 87559.02 97641.99 86452.64 90707.44 93566.32 99026.08 99273.81 100317.64 101528.91 98742.55
Change -0.66% -1.30% -0.84% -1.75% -0.93% -0.98% -0.18% -0.78% -0.55% -0.43% -0.59%
World trade
Base 27326.29 26584.27 29052.30 30629.34 27654.29 30330.33 31947.29 32705.09 33280.58 33766.20 32405.90
Scenario 27262.87 25997.63 28430.18 29697.38 27230.23 29612.31 31855.22 32259.96 32849.17 33365.99 31988.53
Change -0.23% -2.21% -2.14% -3.04% -1.53% -2.37% -0.29% -1.36% -1.30% -1.19% -1.30%
World ending stock
Base 45567.45 42651.42 47190.48 37308.37 45136.45 33732.35 38081.59 39218.71 39622.60 40074.18 38145.90
Scenario 45557.79 42456.16 47053.03 37041.77 45022.33 33545.32 38011.83 39016.99 39496.30 39975.45 38009.18
Change -0.02% -0.46% -0.29% -0.71% -0.26% -0.55% -0.18% -0.51% -0.32% -0.25% -0.36%
Competing exporters Australia
Base 3209.03 3904.04 3101.03 2655.03 3404.70 1699.84 2145.13 2129.83 2103.61 2109.14 2037.51
Scenario 3221.85 3946.80 3157.40 2709.37 3442.02 1745.99 2148.04 2145.82 2125.69 2137.85 2060.68
Change 0.40% 1.10% 1.82% 2.05% 1.10% 2.71% 0.14% 0.75% 1.05% 1.36% 1.20%
Africa
Base 5239.06 4693.05 4094.04 5121.06 4675.38 6644.67 6607.37 6643.10 6682.82 6740.66 6663.72
Scenario 5275.71 4744.46 4148.48 5204.66 4722.88 6736.29 6613.99 6678.93 6732.52 6791.92 6710.73
Change 0.70% 1.10% 1.33% 1.63% 1.04% 1.38% 0.10% 0.54% 0.74% 0.76% 0.70%
Brazil
Base 12.00 315.00 674.02 489.02 333.68 1276.84 1950.43 2432.24 2832.35 3123.49 2323.07
Scenario 70.23 409.63 758.10 607.79 412.66 1398.50 1960.34 2484.49 2900.61 3201.87 2389.16
Change 485.20% 30.04% 12.47% 24.29% 175.90% 9.53% 0.51% 2.15% 2.41% 2.51% 3.42%
Former Soviet Union
Base 6025.07 5380.05 5326.06 5390.06 5577.06 5036.62 5267.07 5408.53 5476.96 5540.71 5345.98
Scenario 6072.44 5427.92 5363.29 5468.81 5621.22 5064.80 5278.24 5457.70 5501.14 5560.61 5372.50
Table 7. Gains and losses in exports for main exporting countries after elimination of U.S. cotton programs Export gains and losses (thousand dollars)
1999/00 2000/01 2001/02 2002/03 Average 2003/04 2004/05 2005/06 2006/07 2007/08 Average United States
Base 1712033 1850875.67 2209708.00 3184477.00 1924205.30 3988901.31 3636095.58 3557414.87 3559344.96 3588686.36 3666088.62 Scenario 1675149 1660354.70 2083347.00 2944156.00 1806283.32 3720706.98 3612242.89 3447000.22 3434225.41 3454626.98 3533760.50
Change -2.15% -10.29% -5.72% -7.55% -6.06% -6.72% -0.66% -3.10% -3.52% -3.74% -3.55%
Brazil
Base 3043.98 86502.49 135397.80 130863.40 74981.42 424297.85 572987.46 703973.43 822628.11 919473.70 688672.11 Scenario 18213.16 115671.34 155673.20 168776.10 96519.24 476050.61 578506.93 734488.46 856227.02 954168.00 719888.20
Change 498.33% 33.72% 14.97% 28.97% 182.34% 12.20% 0.96% 4.33% 4.08% 3.77% 2.81%
Australia
Base 813913.70 1072079.40 622936.40 710487.80 836309.83 564864.27 630183.55 616445.74 610972.68 620875.10 608668.27 Scenario 835508.60 1114489.00 648359.60 752361.90 866119.07 594334.93 633899.03 634367.45 627477.16 637088.02 625433.32
Change 2.65% 3.96% 4.08% 5.89% 3.56% 5.22% 0.59% 2.91% 2.70% 2.61% 2.81%
Africa
Base 1328793.00 1288748.10 822412.7 1370399.00 1146651.25 2208051.61 1941077.64 1922742.50 1940959.3 1984273.70 1999420.94 Scenario 1368128.00 1339730.20 851873.3 1445277.00 1186577.14 2293034.62 1951827.39 1974484.50 1987361.00 2024015.30 2046144.56
Change 2.96% 3.96% 3.58% 5.46% 3.50% 3.85% 0.55% 2.69% 2.39% 2.00% 2.30%
Former Soviet Union
Base 1528150.00 1477405.40 1069901.00 1442383.00 1358485.21 1673688.393 1547331.548 1565416.40 1590729.80 1631040.80 1601641.40 Scenario 1574741.00 1532725.80 1101329.00 1518629.00 1402931.84 1724060.337 1557639.425 1613453.40 1623872.20 1657082.30 1635221.53
Change 3.05% 3.74% 2.94% 5.29% 3.24% 3.01% 0.67% 3.07% 2.08% 1.60% 1.98% By the end of the analysis period, world
cot-ton price changes relative to the baseline decreased from the second-year highs. Adjustment by U.S. competitors, who increased production, took away most of the price increase. For example, the increase in A-index price relative to the baseline was 1.23% in 2007/08 compared with 2.26% in 2005/06. Simi-larly, the increase in U.S. farm price due to program elimination mitigated over time (5.16% in 2005/06 to 3.29% in 2007/08).
In the initial year, world cotton trade declined by approximately 450,000 bales (1.36%) from the baseline level. The trade effects were somewhat mitigated towards the later period. By the end of the projection period, the decline in trade was 1.19%. Similarly, the decline in world cotton production was estimated to be 778,000 bales in 2005/06 compared with 443,000 bales in 2007/08.
Table 7 presents projected gains in export earn-ings by major exporters due to the elimination of U.S. cotton programs. On average, Brazil gained
$30 to 35 million per year (3.77% to 4.33%) in ad-ditional export earnings. Similarly, Australian export revenue was projected to rise by $16 to $18 million per year (2.61% to 2.91%). African countries appear to gain on average 47 million dollars per year. These estimates are much smaller than those in the Oxfam study (Watkins, 2002; Goreux, 2004).
SUMMARY AND CONCLUSIONS
This study analyzed the impacts of eliminating U.S. cotton programs on the world cotton market through time using a partial equilibrium world fiber model that allows substitution among various fibers, such as cotton, man-made fibers, and wool, at the mill level and endogenizes man-made fiber prices by modeling its supply component. The analysis examined changes in U.S. and global cotton produc-tion, consumpproduc-tion, trade, and prices from 1999/00 through 2008/09, allowing market adjustments to “settle out” from the initial adjustment of eliminat-ing U.S. programs.
Overall, the results showed much smaller impacts of the U.S. cotton programs on the world market than previously reported by ICAC (2002) and Sumner (2003). The results from this study indicated that the elimination of U.S. cotton programs would initially increase world cotton price by an average of 2%, but the price effect, ceteris paribus, would fade away in a few years due to supply response from other major cotton producing countries. The analysis also showed some effects, though limited, of the elimination of these programs on cotton exports for various countries and regions. Brazil was the main beneficiary, followed by Australia, Africa, and the Former Soviet Union.
The conclusions from this study are that sev-eral countries, notably Brazil and Australia, would gain by elimination of U.S. cotton programs, with the gains being relatively small. The primary ef-fect would be to shift acreage and production out of the United States to a few other countries, and the long-run impact on global prices, if any, would be small. There would likely be a small decline in global trade in cotton.
This analysis was conducted assuming a continu-ation of U.S. farm programs for competing crops and no changes in commodity programs or trade policies of other countries. If other U.S. crop programs were eliminated with cotton, it is likely that the effects on U.S. cotton production would be somewhat moder-ated. Also, an elimination of trade restrictions and/or alteration of commodity programs by other countries would also impact the global trading system. This study analyzed the effects of unilateral elimination of the U.S. cotton program, leaving all other programs and policies in place.
REFERENCES
Benin, Burkina Faso, Mali, and Chad (BBMC). 2003. Poverty reduction: sectoral initiative in favor of cotton. World Trade Organization (WTO), Geneva, Switzerland. Britt, M., 2002. Producer supply responsible for cotton in
the United States. M.S. thesis, Texas Tech University, Lubbock.
Coleman, J. and M. E. Thigpen. 1991. An Econometric model of the world cotton and non-cellulosic fibers markets. World Bank staff commodity Working Paper, World Bank, Washington, DC.
Fabiosa,J., J. Beghin, S. de Cara, A. Elobeid, C. Fang, M. Isek, h. Matthey, A. Saak, P. Westhoff, D.S. Brown, B. Willott, D. Madison, S. Meyer, and J. kruse. 2005. The Doha round of the World Trade Organization and ag-ricultural markets liberalization: impacts on developing economies. Rev. Agric. Econ. 27(3):317-335.
Fiber Organon. 1980-2004. Fiber Economic Bureau, Arling-ton, VA.
Food and Agricultural Policy Institute (FAPRI). 2002. The Doha round of the world trade organization: appraising further liberalization of the agricultural markets. Work-ing Paper 02-WP 317, Center for Agricultural and Rural Development, Iowa State University, Ames. Available online at http://www.card.iastate.edu/publications/DBS/ PDFFiles/02wp317.pdf
Food and Agricultural Policy Research Institute (FAPRI). 2004 . U.S. and world agricultural outlook. CARD Staff Report 1-04. Iowa State University, Ames.
Fuller, F., J. Beghin, J. Fabiosa, S. Mohanty, C. Fang, and P. kaus. 2002. Accession of the Czech Republic, hungary, and Poland to the European Union: impacts on agricul-tural markets. World Economy 25:407-427.
Goreux, L. 2004. Cotton after Cancun. Mimeo, Organization for Economic Co-operation and Development (OECD), Paris. Available online at http://www.oecd.org/datao-ecd/38/48/30751318.pdf
International Cotton Advisory Committee (ICAC). 2002. Pro-duction and trade policies: affecting the cotton industry. International Cotton Advisory Committee, Washington, DC.
koo, W.W. 2002. Alternative U.S. and EU sugar trade liberal-ization policies and their implications. Rev. Agric. Econ. 24(2):336-352.
national Statistics Bureau of China (nSBC). 1980-2004a. Chinese statistical yearbook, Beijing, China. national Statistics Bureau of China (nSBC). 1980-2004b.
China industrial economic statistical yearbook, Beijing, China.
national Statistics Bureau of China (nSBC). 1980-2004c. Chinese rural statistical yearbook, Beijing, China. Pan, S, S. Mohanty, D. Ethridge, M. Fadiga. 2004. Structural
models of the United States and the rest-of-the-world natural fiber market. CER # 04-03, Cotton Economics Research Institute, Dep. Agric. Applied Econ., Texas Tech Univ., Lubbock.
Poonyth, D., A. Sarris, R. Sharma, and S. Shui. 2004. The impact of domestic and trade policies on the world cot-ton market. FAO Commodity and Trade Policy Research Working Paper no.8, Food and Agriculture Organization, Rome, Italy. Available online at ftp://ftp.fao.org/docrep/ fao/007/j2731e/j2731e00.pdf.
Sumner, D. A. 2003. A quantitative simulation analysis of the impacts of U.S. cotton subsidies on cotton prices and quantities. Mimeo, Dep. Agric. and Resource Econ., Univ. California, Davis. Available online at http://www. mre.gov.br/portugues/ministerio/sitios_secretaria/cgc/ analisequantitativa.pdf
Tiller, k., J. harwood, and D. Schaffer. 2003. U.S. cotton subsidies under fire: would subsidy elimination really help farmers worldwide? Working Paper, Agricultural Policy Analysis Center, Dep. Agric. Econ., Univ. Tennes-see, knoxville.
Tokarick, S. 2003. Measuring the impact of distortions in agricultural trade in partial and general equilibrium. IMF Working Paper 03/110, International Monetary Fund, Washington, DC. Available online at http://www.imf. org/external/pubs/ft/wp/2003/wp03110.pdf
USDA-Economic Research Service (ERS).1995-2004. Cot-ton and wool situation and outlook yearbook. USDA-ERS,Washington, D.C. Available online at http://usda. mannlib.cornell.edu/usda/current/CWS-yearbook/CWS-yearbook-11-29-2005.pdf
USDA- Foreign Agriculture Service (FAS). 2002. China, people republic of cotton and products annual. USDA-FAS, Washington, DC. Available online at http://www. fas.usda.gov/gainfiles/200206/145683722.pdf United States Trade Representative (USTR). 2003.
Cotton-subsidies on upland cotton (WT/DS267). Executive Summary of the Closing Statement of the United States of America at the Second Session of the First Meeting of the Panel with the Parties. 20 Oct. 2003. Office of the USTR, Washington, DC. Available online at http://www. ustr.gov/assets/Trade_Agreements/Monitoring_Enforce-ment/Dispute_Settlement/WTO/Dispute_Settlement_ Listings/asset_upload_file644_5598.pdf?ht=