Patron: Her Majesty The Queen Rothamsted Research Harpenden, Herts, AL5 2JQ
Telephone: +44 (0)1582 763133 Web: http://www.rothamsted.ac.uk/
Rothamsted Repository Download
A - Papers appearing in refereed journals
Russell, E. J. and Appleyard, A. 1915. The atmosphere of the soil: its
composition and the causes of variation. The Journal of Agricultural
Science. 7 (1), pp. 1-48.
The publisher's version can be accessed at:
•
https://dx.doi.org/10.1017/S0021859600002410
The output can be accessed at:
https://repository.rothamsted.ac.uk/item/8w40w/the-atmosphere-of-the-soil-its-composition-and-the-causes-of-variation
.
© Cambridge University Press (CUP).
VOLUME
VII MARCH, 1915
PARTI
THE ATMOSPHERE OF THE SOIL: ITS
COMPOSI-TION AND THE CAUSES OF VARIACOMPOSI-TION.
BY EDWARD JOHN RUSSELL AND ALFRED APPLEYARD.
(Rothamsted Experimental Station.)
(With 17 Text-figures.]
Introduction.
THE remarkable relationships existing between the microorganisms of the soil and the growth of plants have given rise to numerous researches on the bacteria, fungi, and more recently the protozoa of the soil, and considerable knowledge has now been obtained of the organisms present in normal soils. The earlier investigations were necessarily confined largely to methods of isolation, descriptions of the organisms found and studies of their behaviour in certain culture solutions, but sufficient of this preliminary work has been done to enable us to attack the real problem and try to obtain a picture of the life in the soil as it actually is. For this purpose it is necessary to know the relative abundance of the various organisms, to find out which are active and which inert, and to discover what the active forms are doing and what is their mode of life. Before the bacteriological and zoological work can be fully interpreted, however, it is necessary to discover the conditions under which life in the soil goes on, and in the series of papers, of which this is the first, it is proposed to deal with the air supply, water supply, and temperature of our own soils and by comparison with other investigations to see how far the observed relationships hold generally.
2 The Atmosphere of the Soil
air is commonly not more than 10 to 20 per cent, of the volume of the soil. The pores appear to be continuous and seem to maintain fairly complete communication between the various layers of the soil; in some places the communication is made more effective by the presence of cracks and burrows.
The soil atmosphere is the air present in these pores. Its biological significance lies in the fact that it is the air surrounding the soil organisms and the roots of plants, and is either in actual contact with them or is separated from them only by a thin film.of water or colloidal matter. It is obviously part of the ordinary atmosphere but its com-position is influenced by two causes: oxygen is absorbed and carbon dioxide produced by the inhabitants of the soil; while on the other hand, diffusion and other processes of gaseous interchange are constantly replacing it with ordinary atmospheric air, thus eliminating any differences in composition brought about by biochemical or other changes. As a net result the composition of the soil air at any moment is determined by the difference of velocity with which these two
processes take place.
Unfortunately the mechanism of gaseous interchange in the soil is not sufficiently well known to enable us to ascertain the speed at which it goes on and so to discover the rate of production of carbon dioxide, a quantity of great importance in the study of the biochemical changes in the soil, but we have obtained evidence that our curves are mainly determined by the production and not by the loss of carbon dioxide from the soil. In any case for our present purpose of discovering the conditions under which life goes on in the soil it is mainly necessary to know the resultant of the various actions concerned.
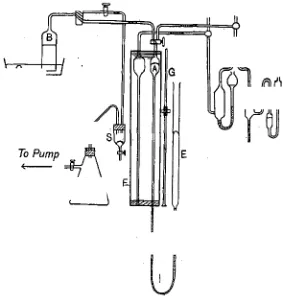
Preliminary determinations showed that it is not difficult to draw a sample of gas from the soil, that is fairly representative of the soil air and is uncontaminated by atmospheric air. In our experiments the depth selected has been 6 inches, this being right in the region where the soil changes take place, besides being convenient for working. But as a matter of fact no great difference in composition was found on going somewhat deeper: thus the following results (Table I) were obtained at 6 and 18 inches respectively.
E. J. RUSSELL AND A. APPLEYARD 3
TABLE I. Comparison of composition of soil air taken from a depth of 6 and 18 in. in the soil. 30 January 1914. Percentage by volume.
Grassland, Greatfield
Arable land, Broadbalk (dunged plot) . .
Arable land, Broadbalk (nnmanured plot)
CO,
6 ' deep
1-46
0-34
0-34
18' deep
1-64
0-50
0-45
o,
6* deep
18-44
20-52
20-32
18* deep
17-87
20-33
20-35
Unlike atmospheric air, however, the soil air is not constant in com-position but changes somewhat from day to day and even on the same day at different spots in the field; nevertheless the values fall within fairly narrow limits.
There are two kinds of variation in composition; the local daily ones just referred to, and the greater variations produced by season, treatment, etc.: the latter may be so great as to mask altogether the local fluctuations. In our experiments the greatest factor of all was the effect of season. Whatever the history of the soil its atmosphere in spring and to a less extent in autumn was characterised by high amounts of carbon dioxide indicating rapid biochemical changes at these seasons of the year, while in summer and winter the amounts were much lower. The efEect is complex and includes at least two others each of which was found to be very potent: the temperature during the period December to June, and moistness of the soil during part of the summer months. (Figs. 7 and 8.)
In addition there is the possibility that a certain amount of partial sterilisation has taken place during the winter and during the dry summer, leading to considerable bacterial activity immediately con-ditions become favourable once more.
This seasonal effect dominates all the others and impresses on all
the curves the same general type seen in Figs. 1-61. Other factors,
such as manuring, cropping, etc., simply raise or lower the whole curve according as they give rise to more or less carbon dioxide; in par-ticular the effect of the crop proved to be considerably less than was anticipated.
4 The Atmosphere of the Soil
attributable to differences in composition of the soil1, especially the distribution of organic matter, organisms, plant roots and passages such as cracks, burrows of earthworms, etc.; to daily changes in tempera-ture and moistempera-ture content of the soil, or to any cause that would facilitate interchange between the soil air and the atmosphere. These local and daily fluctuations lie between relatively narrow limits, and by taking a mean of a number of samples it is not difficult to arrive at a value that approximately expresses the composition of the soil air at the time. Some of these values are given in Table II.
TABLE I I . Mean composition of soil air from various
Rotharnsted plots. Percentage by volume. '
Arable land manured (farmyard manure) and cropped
Broadbalk wheat 1 Summer Plot 2 1 Winter
Arable land unmanured and cropped Broadbalk wheat (Summer
Plot 3 "(Winter
Arable land unmanured and cropped Hoos wheat Summer
Winter
Arable land unmanured and cropped Hoos fallow Summer
Winter
Mean of all the arable soils
Pasture land. Winter
Atmospheric air
co
8. 0-23 0-37
019 0-21
0-28 0-20
012 0-08
0-25±0-l
1-57
0-03
o,
20-74 20-31
20-82 20-42
20-65 20-71
20-84 20-78
20-6±0-2
1802
20-97
N,
79-03 79-32
78-99 79-37
79-07 79-09
7904 79-14
79-2±0-2
80-04
79;00
The column labelled nitrogen is simply the residual gas after the carbon dioxide and oxygen have been removed in the analytical process and it includes other gases just as in the case of atmospheric air. Sir James Dewar kindly examined some of the samples for hydrogen, but found only quantities of the same order as in the atmosphere, while our own tests have failed to reveal appreciable quantities either of
1
E. J. RUSSELL AND A. APPLEYARD 5
methane or any other combustible gas. We may therefore safely assume that the residual gas is practically all nitrogen.
This then represents the ordinary composition of the air filling the pores of the soil at a depth of 6 inches, the layer within which most of the important soil changes go on. As already pointed out it is very similar to ordinary atmospheric air but there are three important differences which may have much greater effects than would at first be expected:
1. The amount of carbon dioxide though low in the absolute, is nevertheless about ten or more times as high as in atmospheric air.
2. The amount of moisture present in the soil air is greater than in atmospheric air and is usually nearer the saturation point.
3. The soil air is still, there being much less opportunity for actual movement than in the atmosphere.
It is outside our present subject to discuss the effects of these characteristics and we need only indicate a few ways in which they may be expected to act.
There is considerable evidence that microorganisms are very sensitive to the medium in which they are placed, and the relatively high proportion of carbon dioxide in the soil atmosphere is likely to affect their activity. It is therefore necessary to take this factor into account before applying to the soil any deductions from bacteriological investigations made in the laboratory under ordinary atmospheric conditions.
In consequence of its stillness and its intimate contact with the moist soil particles, the soil air is likely to be saturated or nearly saturated with water vapour, and this condition is known to be favourable for organisms and to reduce the need for free liquid water. The effect of the extreme stillness of the air, however, cannot be gauged; physiologists recognise that movement in the air is necessary for the comfort and well being of humans, and we should no doubt find the soil atmosphere intolerable from this cause alone, but it is difficult to form any estimate of its effect on microorganisms.
6
The Atmosphere of the Soil
The total amount of gas given up is not great; its characteristic feature is the absence of oxygen (except in small quantities) and the high proportion of carbon dioxide.
Some of the samples obtained had the composition shown in Table III.
TABLE I I I . Composition of gas held absorbed by soil.
Percentage by volume.
Pasture soil
Soil covered with vegetation (Broadbalk wilderness)
Rich garden soil
Arable soil Broadbalk dunged plot
Broadbalk unmanured
Weight of soil
used, grins
352
400
468
extract!
—
497
Per-centage
of Moisture
28
22
20
id later
24
16
Approximate volume of gas removed in successive extractions
1st 30 c.c. 2nd 30 3rd 22
1st 30 c.c. 2nd 30 3rd 15
1st 30 c.c. 2nd 30 3rd 15 ( 4th 30 | 5th 30
1st 30 c.c. 2nd 30 3rd 15
1st 30 c.c. 2nd 25
Percentage com-position of gas
CO,
520 84-8 991
19-3 57-0 98-7
89-5 99-3 94-4 96-8 92-3
10-8 57-9 98-4
6-3 40-2
o,
0-7 0-2 0-2
5-5 2-6 0-2
0-2 0 0 0 0 0 0 0 0
4-4 1-8 0 0
15-1 9-7
47-3 15-0 0-7
75-2 40-4 11
10-3 0-7 0-6 3 1 7-6
84-8 40-3 1-6
78-6 5 0 1
It will be observed that the composition varies with the pressure, and that the first samples withdrawn contain more oxygen than the last: the final samples are almost pure carbon dioxide.
The volume of gas obtainable depends on the amount of moisture in the soil as it is brought in from the field, and decreased as the soil becomes dryer; from which we may infer that the gas is partly dissolved in the soil moisture, though part may be dissolved in other soil con-stituents.
8 The Atmosphere of the Soil
that had not recently been manured having the following mean composition:
Carbon dioxide 0-9 per cent, by volume Oxygen 19-6
Nitrogen 79-5
It is clear that the method gives rather high results for carbon dioxide because atmospheric air was found to contain 0-04 per cent, instead of 0-03 per cent. The air from a recently manured soil contained much more carbon dioxide—up to 10 per cent.—while the oxygen fell
as low as 10 per cent.1: but as these are the only two out of the 36
they have been omitted from the general mean.
Boussingault and L6wy did not continue their analyses over any prolonged period, nor did they study the effect of conditions such as temperature, moisture content, etc., on the composition of the soil atmosphere. These problems were investigated in Germany and the
work was the outcome of the discovery by Pettenkofer2 of a simple
and rapid method of estimating carbon dioxide which he successfully applied in determining the amount of carbon dioxide in the air of the
Munich soils3. This new method was much more rapid than the older
one of Boussingault, enabling many determinations to be made and not requiring great skill in manipulation. Hence a number of workers took it up and a succession of papers on the subject appeared in Wollny's Journal4 also published from Munich.
It is unnecessary to review all the papers in detail: especially as this has already been done by Fodor5, Wollny6, and Letts and Blake7. Moreover, later work has shown that the results are about 30 per cent,
too high8. For comparative purposes, however, the method serves
1
We cannot help t.hinVing there must have been some mistake here; in our experience the oxygen falls -very low only in waterlogged soils (p. 32).
1
Letts and Blake {Proc. Roy. Soc. Dublin, 1900, 9,116) have shown that the principle of the method had already been used by Dalton and his pupils, but this work seems to have been unknown to Pettenkofer.
• M. von Pettenkofer, ' Ueber den Kohlensauregohalt der Grundluft im Gerollboden von Miinchen in verscbiedenen Tiefen und zu verschiedenen Zeiten,' Zeitsch. f. Biologie, 1871, 7, 395-417; and 1873, 9, 250-257.
• Forschungen auf dem Qebiete der Agrikultur-Physik, 1878-1898.
s
J. Fodor, Hygienische Vntersuchungen fiber Luft, Boden und Wasser, Braunschweig, 1881.
• E. Wollny, Die Zersetzung der orgavischen Stoffe, 1897.
7
E. A. Letts and R. F. Blake, ' The carbonic anhydride of the atmosphere,' Proc.
Roy. Soc. Dublin 1900, 9, 107-270, especially pp. 214 el seq.
E. J. RUSSELL AND A. APPLEYARD 9
sufficiently well. Successive workers showed that the amount of carbon dioxide in the soil air increased with the amount of organic matter, the water content, and the temperature of the soil. On one point, however, there was considerable disagreement which has survived to our own day: the effect of a growing crop on the production of carbon
dioxide in the soil. F. Ebermayer1 found less carbon dioxide in the
soil of a wood than in a fallow soil. Moller2 in one experiment found more carbon dioxide when a crop of grass was growing, in another less, but the conditions were not strictly comparable. In a better experiment
Wollny8 found that the effect depended on the season: in summer the
cropped land (grass) was poorer in carbon dioxide than the fallow land while in winter it was richer. Of the various papers published during this early period this one by Wollny is of rather special interest because
it contains numerous CO2 values obtained between May and September
which show an early summer minimum and late summer (end of August) maximum just like ours do. Numerous determinations were also made by Fodor at depths of 1, 2 and 4 metres below the surface of the soil
and these showed a maximum percentage of CO2 in July and a minimum
in January or March4. No spring maximum was observed.
The earlier workers ascribed the formation of carbon dioxide to the decomposition of the organic matter and generally assumed that the process was the purely chemical " eremacausis" pictured by Liebig. But it was gradually recognised that soil contained numbers of
micro-organisms and in 1880 Wollny5 adopting the method of Schloesing and
1 Ebermayer, ' Mitteilungen uber den Kohlensauregehalt der Waldluft nnd des
Waldbodens im Vergleioh zu einer nioht bewaldeten Flache,' Forsch. auf dem Qebiele der
Agrik.-Physik, 1878, 1, 158-161.
* Joseph Moller, ' Ueber die freie Kohlensaure im Boden,' ibid. 1879, 2, 329-338.
* E. Wollny, ' Untersuohungen fiber den Einfluss der Pflanzendeoke und der Beschat-tung auf dem Kohlensauregehalt der Bodenluft,' ibid. 1880, 3, 1-15.
4 Fodor, loc. cit. pp. 126 et stq. 6
' Untersuohungen uber den Kohlensauregehalt der Bodenluft,' Landw. Versuchs. Stal. 1880, 25, 373-391.
An earlier reference to the possible significance of microorganisms in producing the carbon dioxide of the soil occurs in a paper by Joseph Moller,' Ueber die freie Kohlensaure im Boden' (Mitt, aus dem forstlichen Versuchswesen Oesterreichs, 1878, Heft. 2, 121-148). After showing that the amount of carbon dioxide is increased by additions.of organic matter he goes on to state that the lower organisms and organic residues brought in from the air are of considerable importance in this connection.
We have been unable to see the original paper, but in the long abstract in WoUny's
Forschungen no reference is made to any experiments and it does not appear that this
10 The Atmosphere of the Soil
Miintz demonstrated that these were the active agents, the proof being that, in presence of chloroform, soil produces only a fraction of the amount of carbon dioxide formed in untreated soil. This was
con-firmed by Ddherain and Demoussy1. From that time it has been
generally recognised that the carbon dioxide is mainly produced by the organisms of the soil.
The application of the Pettenkofer method had thus carried the problem a long way, and had given considerable information about the origin and fluctuations of the carbon dioxide in the soil air, but it gave no information at all about the oxygen, and the idea gradually became fixed that the soil atmosphere was deficient in oxygen, a view that was strengthened by the well-known benefits of "aerating" the soil.
Boussingault and LeVy had indeed shown that the percentage of oxygen in the soil air was almost the same as that in the atmosphere, but their results were overlooked. As a matter of fact they rather contributed to the growth of the idea, for in their paper they laid chief stress on the fact that soil air contained 22 times as much carbon dioxide as ordinary air, and did not emphasise its close similarity in oxygen content.
With the introduction of improved methods of gas analysis it became possible to obtain still further refinements in the study of the
soil atmosphere. Schloesing^k2 was one of the first to apply the new
methods and although his investigation was not very extensive it sufficed to demonstrate the incorrectness of the current conception that the soil air was necessarily deficient in oxygen.
In 1880 Hempel published his book describing a fairly accurate form of gas analysis apparatus which is as easy to use as Pettenkofer's and readily allows of the examination of large numbers of samples of air taken from the soil. It was adopted by Erich Lau in a series of analyses
of the air from the soil at Rostock3, one sample a month being taken
from a sand, a loam, and a peat soil. The general result is that the soil air closely resembles ordinary air in its oxygen content, but that it contains about six times as much carbon dioxide; the actual mean values obtained at a depth of 15 cm. were, in percentages by volume:
1
Ann. Agron. 22, 305.
s
Th. Sohloesing^fc, 'Sur Patmosphfere confines dans le sol,' Compt. Send, 1889,109, . 618-20, 673-76.
E. J. RUSSELL AND A. APPLEYARD
11
Carbon dioxide Oxygen Nitrogen
Sand
Oil * 20-79 79-10
Loam
0-U [ 20-69 79-17
Peat
0-43 20-35 79-22
Sandy soil, dunged
Cropped with potatoes
0-57 20-22 79-21
Fallow
018 20-73 79-29
The minimum amounts of carbon dioxide (0-04, 0-05 and 0-12 per cent, in the sand, loam, and peat respectively) were found in February, the maximum (0*18, 0-31, and 0-81 per cent.) in July and August: no spring maximum was observed, but this might easily have been missed in the five weeks that elapsed between the taking of the May and the June samples. Some of the plots were planted and some not: the former contained more carbon dioxide than the latter, even in the summer; a result directly opposite to that obtained by Wollny.
Jodidi and Wells adopted Orsat's simpler form of the apparatus, and made a great number of analyses of the soil air from certain plots at Ames, Iowa, over the period April to August, 1910. The mean of all the results showed that at a depth- of 7 inches the percentage of oxygen is 20'51, of carbon dioxide 025, and of nitrogen 79-24.
These various results are set out in Table IV and taken in conjunction with our own (Table VI) they establish beyond any reasonable doubt the close similarity between the soil air and the atmospheric air so far as oxygen and nitrogen content are concerned.
TABLE IV. Mean composition of soil air.
Percentage by volume of:
Oxygen
20-6±0-2 20-4±0-2 20-6±0-2
Nitrogen
79-2±0-2 79-4±0-2 79-2±0-2
Carbon dioxide
0-2±0-l 0-2±0-2 0-25±0-l
Locality
Rostock, Germany Ames, Iowa Rothamsted
Investigators
Erich Lau Jodidi and Wells Appleyard and Russell
Date
1906 1911 1913-14
12 The Atmosphere of the Soil •
The significance of the fluctuations in composition in the soil air.
As already stated the composition of the soil air at any moment is a resultant effect, being the difference between the rate at which the carbon dioxide is produced in the soil and that at which it is lost. At first sight it might appear that the composition must therefore be largely accidental but we have been able to show that it is not, and that the great fluctuations as distinct from the minor ones (p. 33) are regulated mainly by the rate of production of carbon dioxide in the soil. The method consists in finding some other substance in the soil which is produced in the same manner as the CO2, but lost in a different way.
If the curve showing the fluctuations of this substance is like the curve for CO2 it follows that the fluctuations are largely governed by the rate
of production and therefore that the curves given in Pigs. 1-5 are essentially production curves. If on the other hand the fluctuations do not resemble those of CO2 it follows that the curves are not essentially
production curves but that their shape is due to a fortuitous balance of losses and gains.
The required substance is found in the nitrates of the soil which, like the carbon dioxide, are produced in the decomposition of the soil organic matter by bacteria but which are lost in a wholly different manner. Carbon dioxide is lost by gaseous diffusion, a process which proceeds most rapidly in dry conditions when the pores of the soil are most widely open: and least rapidly in wet conditions when the pores are more or less closed. The nitrates, on the other hand, suffer least loss under dry conditions and most loss in wet weather.
Determinations were therefore made of the amount of nitrate present in each plot on every occasion when samples of gas were drawn for analysis, and the values are plotted in the curves: unfortunately the necessity for this was not seen when the investigation first began so that no values were obtained during the first four months.
Inspection of the curves shows that they are all of the same type: there is some displacement in point of time but no difference in character.
It follows then that the character of the fluctuations of CO2 content
Feb
. Mar
.
Fig
.
Apr
. Ma
y
Jun
e Jul
y
An?
. Sept
. Oct
. Nov
. Dec
. Jan
. Feb
. Mar
. Apr
. Ma
y
Jun
e Jul
y
Aug
. Sept
.
1.
Curve
s showin
g
percentag
e o
f CO
, an
d
0
, i
n
soi
l air
. an
d
bacteria
l number
s (million
s pe
r gram)
,
an
d
nitrat
e (part
s pe
r million
) i
n
Broadbal
k
unmanure
d
plot
.
0
0
2-2 2-0 > 8 1-6 V 4
a I 3
0
i- «*
20
3 5 J § 1 5 3 0 3 10 . .3 2 5
I 2
0
"3 1 5 1 1 . 11 1 i
\
i V
1 1.191
'I 1 1 \ \ \
\ |CO , 1
y
/ 3 i 1 1. . >e r cent . • >r
1
• 1
'
i.
n
11
"
n
i _L 1 1 1Ot
V
^"
"
• s 7
">
—
\ \ \ V
^
^
\ / /
1
1
\
f\
\
r
h^CO, \ perc — »* • 191 4 \ \ \ •nf c \^ « \ \ \
I I \
r^—
f i 1
/ ' / >
V
p
% /\
\
y
s•X
'
y
•—^_ _ -' ' 2 2 2 1 « 0 2-0 20-8 1-8 20-6 i-6 20-4 1-4 20-2 , Feb . Mar . Apr . Ma y Jun e Jul y Aug . Sept . Oc t Nov . Dec . Jan . Feb . Mar . Apr . Ma y Jun e Jul y Aug . Sept . 0 , pe r cent . «i»11 a t/\ 17-P g. 2 . Curve s showin g percentag e o f CO. , an d o f O , i n soi l air , an d bacteria l number s (million s pe r gram ) an d nitrat e (part s pe r million ) i n Broadbal k dunge d plot . O a - 20-011-0&
I.
a, CDE. J. RUSSELL AND A. APPLEYARI>
15
o
<N
i
i
00
00 A
(O
% Carbon dioxide
T)- .(N O 00
A A A 6
% Oxygen
•* (N O 00
g ?2
0
8
.
I
S 10
s o
s,
2
0
1 1
5
i
10
2 5/
0
»
"1
N
,e
t ^
1-as
ni
t
\
-at
e
I 1
1 J.
i CO
A /\
\ \
-i
— /
•
\ s /
V
em.
K
;
V
^—
.—» ,
(
00
, pe
r
\ cent
. *•
y »•
2V
0
20-8
20-6
20'
4
20'
2 ^
9
20-0
«
< n> 9
19-8
19-6
0-6
19-4
19-2
"I
•2 §a
.
Jun
e Jul
y
Aug
. Sept
. Oc
t Nov
. Pec
. Jan
. Feb
. Mar
. Apr
. Ma
y
Jun
e Jul
y
Aug
. Sept
.
Whea
t 191
3
Fallo
w
191
4
Fig
. 4
, Curve
s showin
g
percentage
s o
f CO
2
an
d
O
8
i
n
soi
l ai
r o
f Hoo
s whea
t an
d
fallo
w
plots
,
(a
) Croppe
d
til
l Sept.
' 1913
, Fallo
w
durin
g
seaso
n
1913-14
.
19-0
0-0
ra
1
5
a
1
5
a
1
0
•n
5
"3
5
•3
o
y
/
/ 191
3
Jun
e
\
Jul
y
Aug
.
Fallo
w
/ ' rate
/
**_
•
Sept
.
I /
\
J
op
i
\
/
n Nov.
Dec
.
/
'A
1914
Jan
. Feb
.
Whea
t
Mar
.
O \ Na
s
erf
*
(/ Apr
.
\ \
\
nitra
t
Ma
y
/
e
f
June
/
/
/ \ Jul
y
/
/ num Aug
.
/ jers
•^
^
Sept
.
•21-3
21-0
20-8
20-6
20-4
9
20-2
20-0
19-8
19-6
19«
4
9
19-2
0'
2
§ a. o
'
19-0
0-0
^
i
Fig
. 5
. Curve
s showin
g
percentage
s o
f CO
, an
d
o
f 0
8
i
n
soi
l ai
r
o
f Hoo
s whea
t an
d
fallo
w
plots
.
(6
) Fallo
w
til
l Oct
. 1913
, croppe
d
durin
g
seaso
n
1913-14
9-0
. Air
a caespitos
a
Festuc
a ovin
a
Mar
. '1
3
Apr
. Ma
y
Jun
e Jul
y
Aug
. Sept
. Oct
. Nov
. Dec
. Jan
. '1
4
Feb
.
Fig
. 6
. Curve
s showin
g
percentage
s o
f CO
, an
d
o
f O
2
i
n
soi
l ai
r fro
m
Geeacroff
c field
unde
r patche
s o
f
Aira
caespitosa
an
d
o
f Festuca
ovina
respectively
.
O
E. J. RUSSELL AND A. APPLEYARD
19
The relationship of C02 to oxygen.
The oxygen curves are generally reciprocal to the CO2 curves,
i.e. the oxygen falls as the CO2 rises, and the agreement is sufficiently
close to justify the assumption that the oxygen is mainly used up in producing CO2. But the agreement is not absolute and the
discre-pancies are considerably beyond the limits of experimental error.
TABLE V. Relationship of C02 to oxygen at times of rapid
nitrification.
Plot
Broadbalk dunged
Broadbalk wilderness
Broadbalk unmanured
Hoos fallow
Hoos wheat
Period
Nov. 1913 Dec. „
Mar. 1914 April „
May „ June „
Nov. 1913 Deo. „
Deo. „ Jan. 1914
Nov. 1913 Deo. „
Mar. 1914 April „
Nov. 1913 Dec. „
Feb. 1914 May „
Nov. 1913 Dec. „
Mar. 1914 April „
COjin soil air
0/
/o
0-54 0-35
0-30 0-76
0-44 0-43
0-58
0-64
0-53 0-32
0-35 0-29
0-29 0-34
0-33 0-32
0-04 0-05
0 1 1 0 1 0
0-03 010
O8in
soil air
0/
/o
20-72 20-47
20-16 19-31
20-22 20-39
20-62 2017
2019
20-55
20-56 20-27
20-28 19-86
2106 20-57
20-85 20-73
20-90 20-76
20-75 20-58
Sum
21-26 20-82
20-46 20-07
20-66 20-82
21-20
20-81
20-72 20-87
20-91 20-56
20-67 2019
21-39 20-89
20-89 20-78
21-01 20-86
20-78 20-68
Fall in O8in
excess of rise inCOs
0-44
0-39
- 0 1 6
0-39
- 0 1 5
0-35
0-38
0-50
0 1 1
0-15
0 1 0
Increase in nitrate during
period, parts of N per
million
• 7
13
7
11 .
9
10
17
8
11
8
20
The Atmosphere of the Soil
At least two cases occur in which the oxygen decreases to a greater extent than the CO2 increases:
(1) At times of active nitrification. (2) After heavy rainfall.
In the first case the falling off of oxygen is partly at any rate the result of oxidations such as the production of nitrate which do not
yield a volume of CO2 equal to that of the oxygen absorbed, Table V
gives the results obtained for all the periods of rapid nitrate accumula-tion : in all except two the fall in oxygen is greater than the rise of C02.
The second case is seen in wet weather particularly in February, 1913 and 1914, but it reaches its maximum development on Geescroft during the period when the soil lies waterlogged; the oxygen then falls as low as 2"6 per cent, but the CO2 does not rise above 9-1 per cent.
There is no evidence of rapid biochemical change; it appears more probable that the CO2 is being dissolved in the soil water.
There are still other instances where the fall in oxygen precedes the rise in CO2: these are readily seen by inspecting the curves.
A third case presents more difficulty and has not yet been satis-factorily explained. Reference to the figures shows that several periods
occur when the oxygen and CO2 rise simultaneously: such are
May-June 1913 and April 1914 on Broadbalk unmanured plot (Fig. 1), February, April and November 1913 on Broadbalk dunged plot. (Fig. 2), March, April and October 1913 on Broadbalk wilderness
(Fig. 3), etc. The phenomena suggest an evolution of CO2 from the
water or colloids in the soil.
In general the oxygen falls below that present in atmospheric air
(20-97 per cent.) but in a few cases it exceeds this amount1. The
occurrence is so rare that we have been unable to make a satisfactory investigation, but we incline to the view that the additional oxygen comes dissolved in the rain (p. 23). The following are instances:
Hoos field wheat
Broadbalk wheat (dunged plot)
Geescroft
10 Nov. 1913
10 Nov. 1913
10 Nov. 1913
% co
20-69 0-10 019
O i l
0-19
%o
a2101 2110 21-71
2119
21-21
% N2
78-30 78-78 78-10
78-70
78-60
E. J. RUSSELL AND A. APPLEYARD
T H E CAUSES OF FLUCTUATIONS OF COMPOSITION OF SOIL A I R .
A. The variations due to season.
These fluctuations consist in a rise to a maximum CO2 content in
late spring, a fall to a minimum in summer, a rise to a second maximum in late autumn and a fall to a minimum in winter. The oxygen content varies in the inverse sense, reaching minimum values in spring and autumn and maximum values in summer and winter.
All the curves show the same general shape when plotted over the year; proving that the effect of season completely overrides the effect of various soil treatments. Field experiments alone do not enable us to disentangle all the factors, hut we took measurements for the purpose of discussing the effect of temperature and moisture content.
Effect of temperature. This can be studied from Fig. 7 where the
mean soil temperatures taken from the continuous recording soil
thermometer are plotted along with the C02 in the soil air from the
Broadbalk unmanured plot.
0-8
0-7
,0-6
a
10-5
10-4
0-3
0-2
0-1
0-0
Feb. M a r . A p r . M n j J u n e J u l j A u g . S o p L a A N o r . D e c J . i l . F e b . M»r.Apr. —«
13 1
1
1
I
I
i>
i
1
/ V
l \
\J
b'i
\s
//
&
N,
l
\
1
'
»
V
14y
i
j.
l\ 4
h
j
p /
^
\ \
M»jt Jura July Aug.Sapl 18°C
16 S
14 I
12 I
r
o°c
Rg. 7. Curves showing percentage of CO, in air of Bioadbalk unmanured plot and mean soil temperature (at 6" depth) for 24 hours previous to sampling.
Beginning with the middle of April, 1913, when soil temperatures were first taken, it is seen that the temperature curve runs closely
with the C02 curve up to the early part of May, they then part
company and show no more resemblance till November. From that time, however, up to early May, there is a close general resemblance but this ceases from then onwards Thus we can infer, that the
22
The Atmosphere of the Soil
It is clearly not the only factor for the parallelism is not complete: a rise in temperature in spring is more potent to increase the output
of CO2 than a similar rise later on. Thus the values for temperature
and CO2 in May and June no longer show the agreement obtained
earlier: the C02 maximum in May being above that in June while the
temperature maxima fall the other way. These differences in detail indicate that other factors are operating, but they do not weaken the main conclusion that from November to May the temperature determines
the rate of C02 production in the soil1.
The dunged plots and the wilderness show the same general relation-ships, but again there are differences in detail, the CO2 and temperature
curves parting company earlier in the summer than on the unmanured plot. The main obvious difference between the plots is that the crop is larger on the dunged plot and the wilderness than on the unmanured plot, and the bearing of this factor will become evident later on.
From June to November, however, the temperature is not the main factor for the curves show no kind of similarity.
Effect of Moisture. A comparison of moisture content and CO2
content is made in Fig. 8. The moisture determinations only began in June 1913, so that the curve does not run as long as that for
tempera-ture but it shows no connection with the CO2 curves except during a
few months in summer. The moisture is low during June, July and
August of 1913 when the CO2 is falling: it rises in September and
October when the CO2 first falls and then rises, it is steadily high from
November to March 1914 during which- the CO2 first falls and then
rises; it falls in April while the CO2 rises and falls low during summer
when the CO2 also is low.
Thus moisture does not have nearly so marked an effect as tempera-ture, and it only shows any relationship to the C02 during the summer
months July to September.
The extreme case of water logged soil is dealt with on p. 32.
1
The failure to find on some of the plots a maximum CO8 content in May 1914 of
the same order as the value obtained in 1913 may be attributed to the fact that quite unwittingly we allowed a favourable temperature period to pass without taking any samples. We made determinations on May IS and again on May 25, but during the interval there came a rise in temperature which we missed.
May 1914
Soil temperature at depths of 6 in. °C.
15th
15-5
16th
151 17th
161
18th
17-3
ISth
16-9
20th
17-9
21st
190
22nd
2 0 0
23rd
161
24th
E. J. RUSSELL AND A. APPLBYARD
23
Rainfall. If instead of taking the percentage of moisture, we plot
rainfall for the week preceding the date of sampling, we obtain a
somewhat closer relationship with the C02 curves (Fig. 9). The May
maximum (1913) is seen to coincide with a period of high rainfall: the
£ &
V
f
$»,
W
\
io£
Feb. Mar. Apr.May June July Aug.Sept Oot. Nov. Dec. Jan. Feb. Mar. Apr.Maj-JuneJuly Aug.SepL
Fig. 8. Curves showing percentage of C02 in air of Broadbalk unmanured plot
and soil moisture to a depth of 9'.'.
0-8
0-7
0-6
!0-5
•• 0 - 4
^0-3
0-2
0-1
0-0 \
\ ',
s .
'13
ti
|
I
1
J
,11 / •11/
N I
\j
—'1 s
\
%:
\ * 1 \
N,
V
N
\
\ \
1 ••//
Mar. 12lli tl
1
1 14
(
/
A
1
y
i n .
HI
-4J8-'/[''•
>
i
>
i
I
/
/
A /"« 1 '
I
w
V
1 1
\
1 *
?1
1
1-6'
1-4
1-2
0-8g
0-4
0-2
0-0
Full. Mar.Apr.M8jJum.JuljAuf.Sept.0cl. N - Dn-.J«n. Feb.Mar.Apr.MuyJuni.JiilyAug.Sept.w
Fig. 9. Curves showing percentage of C0a in air of Broadbalk unmanured plot,
and rainfall for seven days preceding day of sampling.
24 The Atmosphere of the Soil
to come into play. In the first place the rain does not immediately distribute itself throughout the soil but produces a more or less saturated layer which seals the surface and prevents the escape of CO2 from the
soil air. Further, rain appears to be nearly saturated with dissolved oxygen. We have already seen that the dissolved atmosphere in the soil tends to lose oxygen more rapidly than to gain it and in consequence is largely anaerobic. A large fall of rain bringing with it oxygen in solution affords the possibility of partially renewing the dissolved atmosphere and giving the organisms a new lease of activity. In time, however, the oxygen is used up and the activity falls off even though the moisture remains constant. This effect is probably most marked when the soil is dry and the new dissolved atmosphere can most completely replace the old one. We could find no determinations of the amount of dissolved oxygen in rain water but a number of analyses of stream waters have been made by the Sewage Commission, and they show that on an average about ten parts per million by weight of dissolved oxygen is present. If we suppose that rain contains approxi-mately the same amount then 1 inch of rain brings down 2Jlbs. of oxygen per acre; this if converted into CO2 would add 0-8 to the normal
0-2 per cent, by volume and make the total up to 1 per cent. In addition the rain itself brings down a certain amount of CO2, but not
much, and considerably less than the amount of oxygen.
Relation between soil air and atmospheric air. The experiments
described in this section show that CO2 is produced at maximum rates
in spring and in autumn and at minimum rates in summer and winter. As it is constantly escaping from the soil into the atmosphere we should naturally expect to find that the CO2 in the atmospheric air also reaches
maximum amounts in spring and autumn, minimum amounts in summer and winter.
Systematic determinations of the amount of CO2 in atmospheric air
are not numerous, but those made prior to 1899 were collected by Letts
and Blake in their paper already quoted1. A statistical examination
of the data shows that, as far as they can be relied upon, they indicate an increase in atmospheric CO2 during the period March-May, a falling
off during the period May to August, and a rise during the period October to January. Thus a very close agreement is obtained with our soil results;
E . J . EUSSELL AND A. APPLEYARD
25
B. The effect of organic matter.
Fig; 10 shows the comparison between two plots in Broadbalk wheat field one of which is unmanured while the other receives every September a dressing of 14 tons of farmyard manure. The comparison is only strict during the winter period September to March or April whenfhe
2-0
V5
8vo
10-8
<30-6
0-4
0-2
0-0
\
V
/
-? 1
in
j/
/ <i<" 1
'13T
1
J
/•t
•ui
1
J-hi
j
1
,-Feb. Mar. Apr. May June Jul.vAug.SopL Oct. Nov. Dec Jan. ,-Feb. Mar. Apr. May June July Aug.Sept
Pig. 10. Comparison of COa content of unmanured plot with plot receiving .
farmyard manure, Broadbalk field.
crop is BO small t h a t i t can safely be neglected; from May on t o h a r v e s t time complication arises from the fact that the dunged plot carries a-dense crop while the unmanured plot does not. During winter the air from the dunged plot consistently contains the larger quantity of C02;
we can carry the strict comparison from March onwards by taking the fallow part of the dunged plot and the unmanured fallow on Hoos field, which closely resembles the unmanured plot in Broadbalk:
Bunged fallow (Broadbalk) .. Unmanured fallow
(Hoos)
May 15
0-22
0-10
May 25
0-32 0-07
June 10
017
008
June 12
0-36
007
June 13
0-36
010
July 7
0-36
0-08
July 27
0-35
009
26
The Atmosphere of the Soil
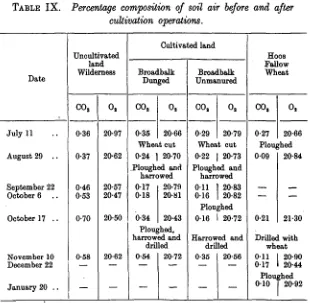
The persistence of this increase is its chief characteristic, and during most of the year it does not assume very great dimensions nor does it alter the shape of the curve relative to the unmanured land. The actual percentages of C02 during the month before and the month after
ploughing in are as follows:
September 22 October 6
„ 17
Dunged plot before ploughing in
0-17 018 0-34
Unmanured plot
O i l 0-16 016
November 10 December 9 12
Dunged plot after ploughing in
0-54 0-35 0-34
Unmanured plot
0-35 0-29 0-25
Considerably larger differences however were observed during the
spring both in COa and oxygen in 1913 and in oxygen in 1914.
C. The effect of a growing crop.
As already pointed out (p. 9) there has been considerable
disagree-ment as to the relative amounts of CO2 in the air of cropped and of
uncropped soils. Critical examination of the older work shows that much of the discussion was irrelevant because the conditions in the various experiments were not comparable. A cropped plot differs in physical state, moisture content, temperature, etc. from uncropped land and when the case is pushed to an extreme and a comparison is instituted between grass land and arable land there arises a further complication due to the difference in organic matter content of the two soils.
The usual method has been to set up a comparison between cropped and fallow portions of the same plot. We have done this in two fields. Figs. 4 and 5 and Table VI give the detailed results and Fig. 11 a simpler comparison for the Hoos wheat and fallow plots. These are made to alternate each year: the land has been unmanured since 1851 and now yields a small crop averaging 16 bushels of wheat per acre. All through the period of active growth (June to August) the cropped plot is the richer in CO2 and it maintains its superiority even after the crop is
cut and right up to the time when the land is ploughed. Then the
CO2 sinks to a low level and remains low throughout the period of
E. J. RUSSELL AND A. APPLEYARD
27
be got into a tilth for the seeding and it speedily becomes compact and less favourable to gaseous diffusion.
During the current year the top half of Broadbalk field has been fallowed and a comparison was made between the fallow and the
June July Aug.Sept Oct. Nov. Dec. Jan. Feb. Mar. Apr. May June July Aug.Sept.
Fig. 11. Curves showing percentage of CO2 in air of Hoos wheat and fallow plots.
cropped portions of the dunged plot. Here the conditions are different from those in Hoos field; the soil contains considerably more organic matter and does not become very compact: the difference in physical condition between the cropped and fallow portions therefore is not nearly so marked (although it still exists) and a stricter comparison is possible. Moreover the crop (which was fairly dense) did not apparently affect the temperature of the soil, and from May to July practically
no differences were observed1. The moisture content, however, was
affected, the percentage of water being:
Fallow portion Cropped portion
June 12
18 19
July 7
20 17
July 27
12
9 per cent, of water
1
The actual readings (6* depth) were
Fallow portion
May 15
12°
May 25
11°
June 10
12°
June 12
12°
June 13
14°
July 7
15°
July 27
28
The Atmosphere of the Soil
Thus the soil conditions are still not entirely comparable but on the whole they are more so than on Hoos field. The percentages of COe in the soil air were:
May 15 May 25 June 10 June 12 j June 13 July 7 July 27
Fallow portion Cropped portion
0-22 0-61
0-32 0-32
017 0-35
0-36 0-48
0-36 0-42
0-36 0-48
0-35 0-30
Now the crop was considerable (304 bushels per acre), yet the increase in C02 over that in the fallow plot is not only no greater than in Hoos
field but it is not usually (except on May 15) much larger than the error of experiment. Hence it appears that the effect of the growing crop in increasing the amount of CO2 in the soil air is not great.
We can make the comparison in a different way so as to reduce in another direction the differences in physical state between the plots. The Broadbalk dunged and unmanured cropped plots both receive similar cultivations and treatment apart from manuring: both are equally exposed to the consolidating effect of the weather though the unmanured land does actually become the more closely packed. The dunged land possesses a large quantity of organic matter and carries
a dense crop, both conditions favourable for a high percentage of CO2
in soil air, yet as a matter of fact this high percentage is not obtained, and in summer when one would expect the maximum differences from the unmanured plot there is practically no difference at all1.
1
On the following occasions the unmanured plot gave a higher CO8 oontent than the
dunged plot in Broadbalk field:
Unmanured plot Bunged plot Unmanured plot Dunged plot Unmanured plot Dunged plot Unmanured plot Dunged plot Unmanured plot Dunged plot
Date
3 June 1913 29 April 1914 25 May 1914
13 June 1914 • 27 July 1914
Mean composition of soil air
%co
80-50 0-42 0-81 0-65 0-42
0-32 0-50 0-42 0-35 0-30
20-77 20-56 19-98 20-08
19-80 20-38
Moisture
Per cent, in soil
7 11 11 16 11 13 15 19 5 9
Temperature °C.
Air
22
10
10
.21.
14
Soil
18 15
12'
l l
E. J. RUSSELL AND A. APPLEYARD
29
Determinations of the amount of C02 in the soil air of grass land
are given in Table VII. The results show that more CO2 is usually
present than in arable land and the oxygen content is lower. But no strict comparison with arable land can be made because of the great
TABLE VII. Composition of soil air of grassland. Percentage by volume.
A. Pasture used for grazing.
Date
Nov. 6,1912 .. „ 14 „ .. „ 20 „ .. „ 21 , , 2 2 Deo. 2, 1913 Jan. 30, 1914
Jan. 30,1914,18 in. deep CO, 101 1-59 1-99 1-35 1-90 3-34 1-46 1-64 18-72 18-12 — — — 1618 18-44 17-87 N. 80-27 80-29 — — — 71-48 80-10 80-49 Date
Dec. 19, 1912 Jan. 13, 1913 Jan. 24 „ . Feb. 11 „ Feb.; 26 „
CO, 1-5 0-7 31 0-7 2-0
B.
o,
15-8 16-6 6-2 190 16-4under Fesluca oviva
Mai-. 13, 1913 April 14 , April 24 , May 2 May 13 , June 3 , July 11 , Aug. 29 , Sept. 22 , Oct. 6 Oot. 17 , Nov. 10 , Deo. 9 , Deo. 22 , Jan.. 8, IS Jan. 20 , Jan. 30 , Feb. 12 ,
14 3-9 4-5 9-1 5-4 7-6 1-6 0-7 0-4 0-7 0-8 0-5 1 0 2-5 1-2 1 0 1-8 130 9-2 2-6 9 0 8-6 19-7 20-5 20-5 20-3 20-3 20-6 19-7 16-2 190 — 190 • 14-2 Geescroft Wilderness. N2 82-7 82-7 90-7 80-3 81-6 831 86-3 88-3 85-6 83-8 78-7 78-8 79-1 79-0 78-9 78-9 79-3 81-3 79-7 — 80-0 84-0
co
8o
sunder Aira caespilosa
1 1 — 1-3 3-9 3 0 1 0 0-6 0-4 0-8 0-9 1-2 0-9 2-5 2-2 — 0-9 1-6 19-4 — 191 10-6 14-6 2 0 0 20-5 20-5 20-2 20-1 19-4 19-8 16-4 16-7 — 19-5 14-8 79-5 — 79-6 85-5 82-5 7 9 0 78-0 791 790 79-0 79-4 79-3 79-1 81-1 79-6 83-6 Bacterial numbers, millions per gram g Q n 17 14 10 10 17 13 8 13
30
The AtmospJwre of the Soil
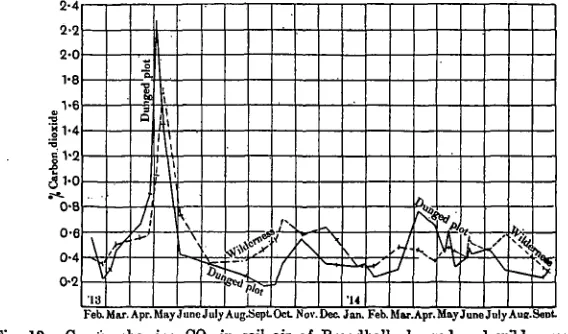
difference in amount and composition of the organic matter present in the soil. The closest comparison we can set up is between two of the Broadbalk plots: an arable plot receiving 14 tons of dung annually and carrying each year a good crop of wheat, and an adjacent plot known as the wilderness which has remained undisturbed since 1882 and now carries a dense growth of grasses, clovers, weeds, etc., only
young trees and bushes being removed. The percentages of CO2 in the
soil air are plotted in Fig. 12. There is no great difference between the two curves. In April and early May the dunged plot contains more
C02, from September to early January it contains less, but during
these months it has been ploughed up and left loosely exposed to the atmosphere for a time prior to seeding. But the differences rarely
2-4
2-2
2-0
1-8
11-4 |V 2
31-0
* 0-8
0-6
0-4
0-2
Feb.Mar. Apr.MayJuneJulyAug.Sept-Oct. Nov.
Fig. 12. Curves showing C02 in soil air of
\
\
13
y
j
[
m
D
u
/
/
ft'
.'1;
V \ \
4* <
(
\
s
-A,
'14
4
\j f)
i
s% /
\
Dec. Jan. Feb.Mar.Apr.MayJuneJulyAutr.SeDt.
Broadbalk dunged and wilderness plots.
exceed 0-3 per cent. When therefore the soil conditions are comparable both as to the state of packing and to the amount of organic matter the difference between grass and arable land is less than might be expected. The result is all the more significant when it is remembered
that the air of the unmanured plot is as rich in C02 during summer
as the air of the dunged plot.
Taking them as a whole, these observations indicate that a growing
crop per se has no very marked effect in increasing the amount of C02
E. J. RUSSELL AND A. APPLEYARD
31
alike the effect of the crop is not very great. Absolute identity of conditions has not been attained, and we cannot yet be certain whether the small effect of the crop still observed is due to uneliminated soil differences such as the removal of water by the growing crop which thus facilitates the escape of CO2 evolved from the plant roots; or tosome direct interference of the growing crop with bacterial activity in the soil.
A wholly different argument in a previous paper1, led to the con-clusion that the growing plant interferes with bacterial activity.
Before leaving this subject attention must be directed to one interesting point in connection with the two Broadbalk plots, the dunged arable and the wilderness. The arable plot shows a persistent loss of nitrogen amounting to over 100 lbs. per acre per annum, apparently
2V0-•6 •
•4
•2
aO-o-•4
•2
1 9 - 0 •
18-8
J
•
ji
r
13
l
\
, \
V*
i
A
1 JK*
ft*"
V
1 h\ ! !
\
*•— \ As
\\
•
'14
1 \
x
V
,'
if
i
[i
i
v^,
-^
Fob.Mar.Apr.MavJunoJuljAug.SoptOct.Nov. DecJon. Feb.Mar.Apr.MnyJimeJulyAug.SepL
Fig. 13. Curves showing Oa in soil air of Broadbalk dunged and wilderness plots.
not wholly by drainage. The wilderness, on the other hand, shows a persistent gain of nitrogen amounting approximately to 100 lbs. per acre per annum. We have hitherto been inclined to attribute this remarkable difference to a supposed greater aeration influencing the biochemical changes in the arable land. It is therefore of special interest to compare the oxygen content of the air from the two plots: this has been done in Fig. 13, from which it appears that there is little if any difference between them.
Amount of C02 under plants of various species. On some of the
32
The Atmosphere of the Soil
various patches. It is found that there is a perceptible falling off of oxygen and rise in CO2 in passing from a neutral matrix to a "sour"
patch (indicated by the presence of rumex or in extreme cases by the total absence of all vegetation). But a patch of a solitary species occurring on a neutral plot such as plot 7 shows no such difference. The results are:
Per
cent.
CO,
Oxygen
Plot 7
d
a
Un
d
1-5
19-3
CC
Un
d
1-4 2 0 0
Plot 5 N.
K
9.
Un
d
1-2 2 0 0
1
Un
d
1-5
19-7 H "9d
s
o
Un
d
1-3
20-0 Plot 5 S
•dao
t
o
Un
d
1 1
20.1 •» g
Un
d
an
d
2 0
19-5
Plot 4*
M
•n
' ma
t
0)
1
2-1 190
1
Un
d
pat
e
1-5
19-5 Plot
K •E
• ma
t
o>
Un
d
1-2 2 0 1
11-1
s
It
2-3
18-5
Samples taken May 24th, 1913.
Another field where segregation occurs is Geescroft which is liable to become waterlogged in winter owing to the absence of calcium carbonate from the soil and the consequent deflocculation of the clay. During normal moist or dry conditions the soil air from the various patches is similar in composition and resembles that from the other fields. But in very wet conditions marked differences set in, the
oxygen falling and the nitrogen1 rising very considerably in amount;
this happens particularly under the patches of Festuca ovina the roots of which form a densely matted tangle near the surface, but it is less marked under the patches of Aira caespitosa the roots of which form a bristly mass more readily allowing gaseous diffusion. The results are plotted in Fig. 6, they are as follows:
Wet conditions
1913
March 13 April 14 April 24 May 2 Mav 13
% CO,
Aira
1 1 —
1-3 3-9 3-0
Festuca
3-9
4-5 9 1 5-4 7-6
/o
Aira
19-4
—
19-1 10-6 14-5
o,
Festuca
1 3 0
9-2 2-6 9 0 8-6
0/
/o
Aira
79-5
—
. 79-6 \ 85-5 82-5
N,
Festuca
8 3 1
86-3 88-3 85-6 83-8
E
1913
June 3 July 11 August 29 September 22 October 6
. J. RUSSELL AND A. APPLEYARD
Dry conditions
% co
2 Aira1-0 0-6 0-4 0-8 0-9
Festuca
1-6 0-7 0-4 0-7 0-8
Aira
20-0 20-5 20-5 20-2 20-1
Festuca
19-7 20-5 20-5 20-3 20-3
33
«/ Iff /o •"»
Aira
79-0 78-9 79-1 7 9 0 79-0
Festuca
78-7 78-8 79-1 78-9 78-9
The low amount of CO2 relative to the oxygen used up has already
been discussed (p. 19).
Minor fluctuations in composition of the soil air.
We now turn to a consideration of the minor fluctuations in composition of the soil air. These differ fundamentally from the major fluctuation hitherto dealt with in as much as they are probably not associated with the production of CO2 in the soil but only with variations
in the agencies causing loss. They are brought about by two causes: (1) Variations in the soil itself: shown in Table XI (p. 41) and discussed on p. 4.
(2) Variations in meteorological and cultivation conditions.
The only satisfactory way of dealing with the effect of meteorological conditions on the soil atmosphere is by statistical methods, but although we have many records we do not feel that they are sufficiently numerous for the purpose. We have, however, tested certain broad and obvious possibilities, the data for which are found in Table VI (p. 46).
(a) Rapid change of temperature. It has happened on a warm day preceded by a frosty night, i.e. where the temperature altered quickly and considerably, that the soil air approximated closely in composition to atmospheric air indicating that it had been largely replaced by atmospheric air. Instances occur on January 13th and February 26th, 1913.
(b) High rainfall. In view of the quantity of bicarbonates in
drainage water it is important to ascertain whether high rainfall appreciably diminishes the amount of CO2 in the soil air. The
34
The Atmosphere of the Soil
effect is to increase it (p. 23, Fig. 9). The following data serve as illustrations:
Date
Rainfall of previous 24 hours CO2 per cent, in soil air:—
Broadbalk unmanured plot .. „ dunged plot „ wilderness . . Hoosfield wheat
; „ fallow
June 10th
0-33 in.
0-36 0-40 0-40 0-28 0-08
June 12th
0-37 0-48 0-58 0-41 0-07
June 13th
0-65 in.
0-50 0-43 0-51 0-43 0-10
These observations confirm the older results of Fodor1.
(1) Strong winds. On several occasions, e.g. February 3rd, March 7th, 1913, samples were taken directly after a windy night but there was nothing at all to indicate that the composition of the air had been affected by the wind. A current of air passing rapidly over the soil might have been expected to draw out the soil air, but apparently it does not. Probably the force is insufficient, the layer of air in contact with the surface of the soil moves less quickly than the layers a few inches above. Moreover any removal of air by this process from the surface layers of the soil probably leads to an upward movement of air rich in CO2 from the lower depths.
(2) Change in barometric pressure. Fodor2 found that the CO2 in soil
air rose with falling barometer at three stations out of four where in-vestigations were made. In the only continuous experiment we made we were fortunate in happening upon a time when the barometer was rapidly falling and we also obtained a rise in CO2 during the period. But when
the whole of our CO2 figures are plotted against barometic pressures
or even against changes in barometric pressure no consistent relationship can be observed such as is obtained with rainfall, temperature, etc., so that the influence of barometric pressure appears to be only minor and easily swamped by other factors.
(3) Night and day. Fodor3 and Wollny4 thought they had evidence
that CO2 streams out from the soil air at night but we can find no
indication of any greater loss by night than by day. Samples drawn from the same 5 holes at consecutive 3-hour intervals over a period of
1
JosetFoAoi,HygienischeUniersuchungen fiber Luft, Bodenund Wasser, Braunschweig,
1881, p. 130.
* Fodor, ibid. p. 135. a Fodor, ibid. p. 53.