Journal of Caring Sciences, 2013
, 2(1), 19-26
doi: 10.5681/jcs.2013.003http:// journals.tbzmed.ac.ir/ JCS
* Corresponding Author: Nasrinsadat Alavi (MSc), E-mail: [email protected]
Assessment of Sound Levels in a Neonatal Intensive Care Unit in Tabriz,
Iran
Sousan Valizadeh1, Mohammad Bagher Hosseini2, Nasrinsadat Alavi1*, Malihe Asadollahi1, Siamak Kashefimehr3
1
Department of Pediatrics Nursing, Faculty of Nursing and Midwifery, Tabriz University of Medical Sciences, Tabriz, Iran
2
Department of Pediatrics Faculty of Medicine, Tabriz University of Medical Sciences, Tabriz, Iran
3Hospital Manager, Alzahra Teaching Hospital, Tabriz University of Medical Sciences, Tabriz, Iran
ARTICLE INFO ABSTRACT
Article type: Original Article
Introduction: High levels of sound have several negative effects, such as noise-induced
hearing loss and delayed growth and development, on premature infants in neonatal intensive care units (NICUs). In order to reduce sound levels, they should first be measured. This study was performed to assess sound levels and determine sources of noise in the NICU of Alzahra Teaching Hospital (Tabriz, Iran). Methods: In a descriptive study, 24 hours in 4 workdays were randomly selected. Equivalent continuous sound level (Leq), sound level that is exceeded only 10% of the time (L10), maximum sound level (Lmax), and peak instantaneous sound pressure level (Lzpeak) were measured by CEL-440 sound level meter (SLM) at 6 fixed locations in the NICU. Data was collected using a questionnaire. SPSS13 was then used for data analysis. Results: Mean values of
Leq, L10, and Lmax were determined as 63.46 dBA, 65.81 dBA, and 71.30 dBA, respectively. They were all higher than standard levels (Leq < 45 dB, L10 ≤50 dB, and Lmax ≤65 dB). The highest Leq was measured at the time of nurse rounds. Leq was directly correlated with the number of staff members present in the ward. Finally, sources of noise were ordered based on their intensity. Conclusion: Considering that sound levels were higher than standard levels in our studied NICU, it is necessary to adopt policies to reduce sound.
Article History: Received: 11 Mar.2012 Accepted: 24 May.2012 ePublished: 26 Feb. 2013
Keywords: Noise Sound level Premature infants Neonatal intensive care unit
Introduction
Recent advances in treatment of respiratory distress syndrome has increased the survival rate of premature infants.1 However, some premature infants are faced with neurobehavioral problems during their school years.2 Premature infants spend most of their first months of life in neonatal intensive care units (NICUs) and are exposed to constant, sudden, and loud noise of 57-97 dBA and maximum intensity of 120 dBA which is equivalent to the noise of a tractor.3 Therefore, improvement of quality of life of premature infants with the focus on NICU environment has become one of the research goals.4,5
behavioral, speech, and hearing problems.10,11 The American Academy of Pediatrics (AAP) and the Joint Committee on Infant Hearing (JCIH) have introduced noise as a major physical factor causing pollution in NICUs. They thus suggested that the admittance of infants to these wards might be associated with deafness.12,13 Sound levels are reported as A-weighted decibels (dBA). A-weighted sound level measurements are numerically adjusted to reflect the frequency-dependent nature of human hearing at low sound levels.14 AAP (2007) recommended the standard values of equivalent continuous sound level (Leq), the sound level that is exceeded for only 10% of any specific hour (L10), and maximum sound level during data collection (Lmax) as 45, 50, 65 dBA, respectively.13 According to AAP, lack of compliance to these values would result in the risk of negative effects on the health of premature infants.13 The first step in establishing standard sound levels is measurement.15 Owing to suitable modern technology and equipment, it is currently possible to measure sound levels.16 In some NICUs in the United States of America, sound levels are measured annually.16 In Iran however, little attention is paid to the measurement of sound levels in NICUs. In fact, no study has been conducted on measuring sound levels in NICUs. Comparing the measured sound levels in NICUs with standard levels would facilitate the identification of sources of noise and their effects on sound levels. New policies can accordingly be designed to eliminate or mitigate sources of noise and hence reduce sound levels.17,18 Reducing sound level in NICUs will in turn shorten the NICU stay of premature infants and support their growth and development.15 The aim of the current study was to assess sound levels and to determine sources of noise and their effects on sound levels in the NICU of Alzahra Hospital as the largest NICU in northwestern Iran.
Materials and methods
After being approved by the Ethics Committee of Tabriz University of Medical Sciences, this descriptive study was conducted to assess sound levels in an NICU with an area of 187 m2. Approximately 8850 infants are delivered in this hospital annually and about 2100 are admitted to the NICU. This area was divided into 3 open care sections (1-3) with 2 partial walls. The nomination of third, second, and first levels of NICU was defined according to the condition of the infants cared. The dimensions of the first, second, and third sections were 11 × 5.5 × 3.5 m3 (area: 60.5 m2), 10 × 5.5 × 3.5 m3 (area: 55 m2), and 11 × 5.5 × 3.5 m3 (area: 60.5 m2), respectively. There were two metal sinks for washing hands and equipment at entrance of sections 1 and 3. Nursing station and entrance were along the second level of NICU. Each section had its own cooling system and one ventilation system was in section 2. Moreover, no acoustic material was used in the construction of the ward and the mean Leq outside the ward was 60 dBA. At the time of sound levels measurement, no building repairs or installation of new equipment were in progress and no sound level reduction protocols were implemented.19
A CEL-440 sound level meter (SLM) and a CEL-382 calibration device (England) capable of detecting sound levels of 10-120 dBA were used. The adjustment of the device to dBA made it sensitive to audible sounds.
Data was collected using a self-made questionnaire consisting of 3 parts of demographic characteristics, sources of noise, and mean sound levels. The validity of the questionnaire was confirmed through content validity and feedback from 3 audiologists, 2 occupational health engineers, 2 infant specialists, and 5 professors of nursing and midwifery.
we determined sound levels at 24 randomly selected hours (from 7 am to 10 pm) on 4 workdays.
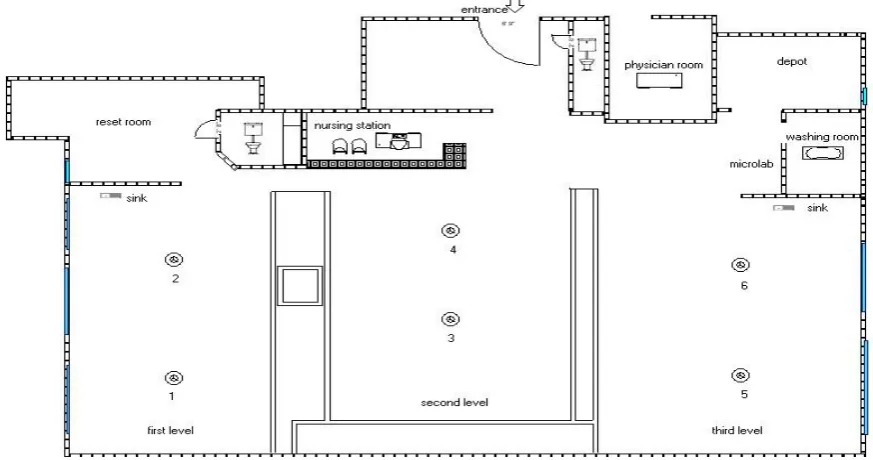
It is important to avoid noise resonance, and measure mean sound levels.16 Therefore, two locations in the center of all open care sections (a total number of 6 points) were selected (Figure 1). The SLM microphone was placed upright at the height of 1.20 m.
During every hour of measurement, the demographic characteristics of the ward and the calibration of the SLM device were assessed by the main researcher. The microphone was then covered with a wide screen to prevent the effects of air flow on the measurements.16 At every location, Leq, L10, Lmax, and peak value of instantaneous sound level (Lzpeak) were measured every 2 minutes and the data was recorded in the data collection. During data collection periods, any sources of noise were recorded. Data analysis was performed using one way analysis of variance (ANOVA) in SPSS13 (SPSS Inc., Chicago, IL, USA).
Results
The mean numbers of hospitalized infants at the time of measurements in sections 1, 2, and 3 were 10 and 12, respectively. The mean number of people present at the NICU was 13. The mean numbers of medical ventilators used in these sections were 8, 4, and 0, respectively. For all infants in sections 1 and 2, monitors were used. Pulse oximetry was used for infants in section 3. An intravenous fluid infusion pump was employed as required.
Sound levels ranged between 56.10 and 104.80 dBA. The measured values were higher than standard levels of NICU according to the recommendation of AAP (Table 1). One way ANOVA showed no significant differences between sound levels of the 6 locations [f (5, 15) = 1.71; p = 0.135].
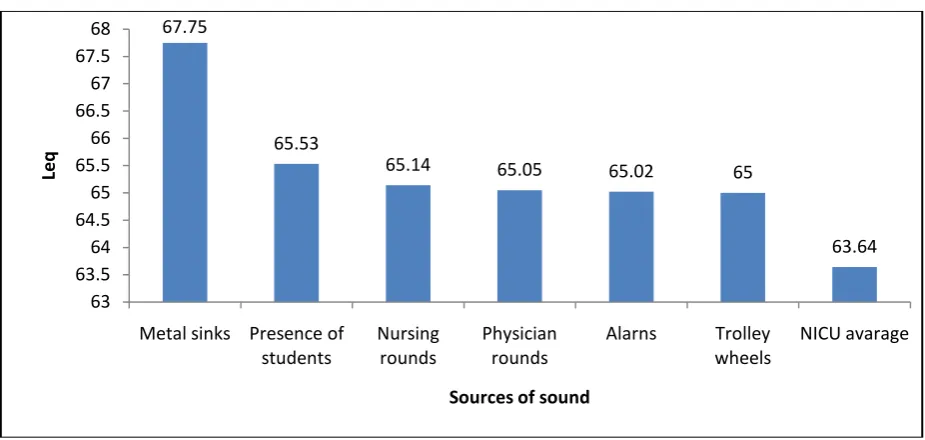
Sources of noise in the NICU in order of intensity are shown in figure 2. Washing metal dishes in the metal sink caused the greatest Leq in the ward. Leq varied during different hours of the day. The highest Leq
Figure 1. Layout of the neonatal intensive care unit showing the 6 locations in
Table 1. Measured and standard sound levels in neonatal intensive care units
Sound pressure level (dBA) Standard level Measured level* 95% CI Range
Leq 45 63.46 (2.97) 62.97-63.95 56.10-70.50
L10 50 65.81 (3.02) 70.50-71.98 57.50-75.00
Lmax 65 71.24 (4.48) 65.32-66.31 60.50-89.70
Lzpeak Undefined 91.68 (4.20) 90.99-92.38 78.30-104.80
*: Measured values are expressed as mean (SD).
Leq: Equivalent continuous sound level; L10: Sound level that is exceeded for only 10% of any specific hour; Lmax: Maximum sound level during data collection; Lzpeak: Peak value of instantaneous sound pressure level
Figure 2. Comparison of mean values of equivalent continuous sound level (Leq) in dBA caused
by various sources of sound with average sound level in the neonatal intensive care unit (NICU)
Figure 3. Equivalent continuous sound level (Leq) in dBA during measurement times
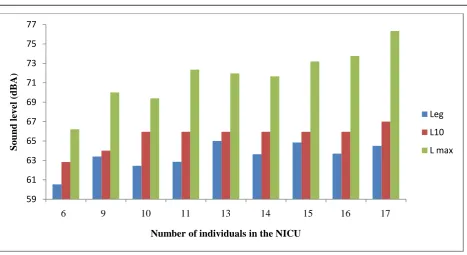
was recorded at nursing rounds (7-8, 13-14, and 19-20). The lowest Leq was detected at 10 pm (Figure 3). Sound levels had direct relationship with the number of people
present at the ward (p = 0.007) (Figure 4). The greatest mean value of Lzpeak was caused by dropping metal devices on the ground (Figure 5).
67.75
65.53
65.14 65.05 65.02 65
63.64
63 63.5 64 64.5 65 65.5 66 66.5 67 67.5 68
Metal sinks Presence of students
Nursing rounds
Physician rounds
Alarns Trolley
wheels
NICU avarage
Leq
Sources of sound
7.00 8.00 9.00 10.00 11.00 12.00 13.00 14.00 15.00 16.00 17.00 18.00 19.00 20.00 21.00 22.00 66.00
64.00
62.00
60.00
Time
M
ea
n o
f
L
Figure 4. Comparison between mean values of equivalent continuous sound level (Leq), sound level that is exceeded for only 10% of any specific hour (L10), and maximum sound level during data collection (Lmax) (all in dBA) and number of individuals people in the neonatal intensive care unit
(NICU)
Figure 5. Comparison between mean peak value of instantaneous sound
pressure level (Lzpeak) and dropping metal files (both in dBA)
Discussion
The measured values were higher than standard levels of NICU. Previous similar studies also reported the same results.17, 18 Despite differences in critical conditions and use of different number of devices, sound
levels of the 6 selected locations had no statistically significant differences.However, according to previous research, there is a direct relationship between how critical the condition of an infant in the NICU is and noise levels due to the use of more equipment and presence of greater number of
59 61 63 65 67 69 71 73 75 77
6 9 10 11 13 14 15 16 17
So
un
d lev
el
(dB
A)
Number of individuals in the NICU
Leg
L10
L max
84 86 88 90 92 94 96 98 100 102 104 106
Lzpeak Dropping Metal File
So
u
n
d
le
ve
l (d
B
A
)
individuals.20 Openings of the 3 sections in the NICU were actually sources of noise for the other 2 sections. Therefore, separation of 3 levels of NICU could be an effective strategy for reducing sound levels.21 Chen et al. were able to decrease Leq to 4.5 dBA by closing an open section of an NICU.22 Because dBA is a logarithmic unit, a 3 dBA difference cuts the intensity of the sound levels by half. Therefore, a 4 dBA difference is very noticeable.23 Ramesh et al. could decrease the sound levels of the noisiest room by 9.58 dBA through implementation of sound level reduction protocols such as separation of rooms with glass and aluminum partitions.24 Sound reduction essentially occurs according to the cascading quality of sound, i.e. in a noisy environment, people tend to speak louder and in a quite environment they tend to speak more quietly.22
Nursing rounds were the noisiest times due to the greatest number of people present in the ward, the highest level of inattention to sources of noise such as alarm of devices and crying of infants, and performing noisy activities. Many previous studies have also reported nurse rounds as one of the noisiest times in the ward.20 Krueger et al. considered nurses to have an important effect on noise levels in NICUs.25 The major source of noise in the hospital is the talking of the personnel.26 Researchers believe that the noise of conversations (mean level: 59-90 dBA) and alarm of devices (mean level: 55-85 dBA) are the two main sources of noise in NICUs that can be controlled by nurses.27 Moreover, the inattention of nurses to alarms of devices and the simultaneous noise of more than one device can increase the mean sound level of the environment up to 7.5 dBA.28 Therefore, the quick response of nurses to alarm of devices will decrease the sound levels of the ward.29 Many studies have performed training programs to increase the knowledge of staff in order to reduce sound levels.28 Teaching the harmful effects of high sound levels and implement-
ation of a behavior modification program have been reported to decrease sound levels by 5 dBA.25 Elander and Hellström informed nurses about sources of noise and thus decreased sound levels of an open care section by 10 dBA. While the staff talked for 62% of each shift before education, the rate decreased to 14% after the education.30 Many studies have been successful in decreasing sound pressure levels of wards by improving nurse activities such as limiting bedside teaching rounds on infants, reduction of the sound of monitors and alarms, and removing phones from care spaces.28
The presence of students significantly increased sound levels. Therefore, educating both medical and nursing students before entering an NICU seems necessary.17 Moreover, there was a significant correlation between the number of people present in the ward and sound level. Since the presence of people is associated with noise, implem- enting regulations to limit the number of people attending an NICU at one time is essential.31 During each of our measurements, there was a possibility of falling of metal files on the ground up to 3 times. Falling of metal objects on the ground causes a mean noise level of 90-110 dBA and results in the highest level of physiological instability in infants.32,33 Therefore, it is recommended to replace metal files with plastic ones.24,34 There were also two big metal surgical sinks in the ward. Turning the tap of a metal sink on or off generates 66-77 dBA of noise.28 In the current study, metal objects were also washed in the metal sinks which significantly increased Lzpeak. Therefore, replacing large steel scrub sinks with smaller ones will help reduce noise.20
Therefore, eliminating or adjusting alarms will reduce sound levels.34, 35
A limitation of this study was the awaren- ess of nurses of the presence of researchers which may have affected their behavior and hence the results of this study. Therefore, future studies are recommended to hide SLM microphones from the personnel and measure noise at times they are not informed about. Moreover, this study measured sound pressure levels of the ward for an average of 6 hours a day. However, further research with increased time of measurement would be beneficial in enhancing the accuracy of the results.
Conclusion
The measured values were higher than standard levels of NICU. Every NICU requires a sound level assessment system in order to achieve environmental noise limiting guidelines and to get closer to the standard sound levels. By evaluating sound levels, the sources of noise can be identified
and their effects on sound levels can be studied. Moreover, the staff, especially nurses, can decrease sound levels by implementing new policies. Infants will thus be faced less sound stimuli and a safe care environment would be created. The results of this study can also be used to create a protocol to reduce sound level.
Ethical issues
None to be declared.
Conflict of interest
The authors declare no conflict of interest in this study.
Acknowledgments
This article is part of an MSc thesis. We would like to thank all nurses of the NICU ward who assisted us in performing this research. We are also thankful to the health center specialists, Mr. Ahmadi and Mr. Adlibakhsh, who assisted us in measuring sound pressure levels.
References
1. Obladen M. History of surfactant up to 1980. Biol Neonate 2005; 87(4):308-16.
2. Perlman JM. Neurobehavioral deficits in premature graduates of intensive care--potential medical and neonatal environmental risk factors. Pediatrics 2001; 108(6):1339-48.
3. Bremmer P, Byers JF, Kiehl E. Noise and the premature infant: physiological effects and practice implications. J Obstet Gynecol Neonatal Nurs 2003; 32(4):447-54.
4. Brown G. NICU noise and the preterm infant. Neonatal Netw 2009; 28(3):165-73.
5. Floyd Dazé AM. Challenging designs of neonatal intensive care units.
6. Crit Care Nurse 2005; 25(5):59-66. Blackburn S. Environmental impact of the NICU on develop mental outcomes. J Pediatr Nurs 1998; 13(5): 279-89.
7. Morris BH, Philbin MK, Bose C. Physiological effects of sound on the newborn. J Perinatol 2000; 20(8 Pt 2):S55-60.
8. Wachman EM, Lahav A. The effects of noise on preterm infants in the NICU. Arch Dis Child Fetal
9. Graven SN, Browne JV. Sleep and brain development: The critical role of sleep in fetal and early neonatal brain development. Newborn and Infant Nursing Reviews 2008; 8(4): 173-9.
10.Graven SN, Browne JV. Sensory development in the fetus, neonate, and infant: Introduction and overview. Newborn and Infant Nursing Reviews 2008; 8(4):169-72.
11.Graven SN, Browne JV. Auditory development in the fetus and infant. Newborn and Infant Nursing Reviews 2008; 8(4): 187-93.
12. American Academy of Pediatrics, Commitee on Environmental Health. Noise: a hazard for the fetus and newborn. Pediatrics 1997; 100(4): 724-7. 13.Witt CL. Addressing noise in the NICU. Forward.
Adv Neonatal Care 2008; 8(5 Suppl):S2.
14.Vahidi R. Noise pollution. Iran: National Program Health Mangment Center; 2004. (Persian)
15.Graven SN. Sound and the developing infant in the NICU: conclusions and recommendations for care. J Perinatol 2000; 20(8 Pt 2):S88-93.
16.Gray L, Philbin MK. Measuring sound in hospital nurseries. J Perinatol 2000; 20(8 Pt 2): S100-4. 17.Berg AL, Chavez CT, Serpanos YC. Monitoring
Unit. Contemporary Issues in Communication Science and Disorders 2010; 37:69-72.
18.Matook SA, Sullivan MC, Salisbury A, Miller RJ, Lester BM. Variations of NICU sound by location and time of day. Neonatal Netw 2010; 29(2):87-95. 19.Nogueira Mde F, Di Piero KC, Ramos EG, Souza
MN, Dutra MV. Noise measurement in NICUs and incubators with newborns: a systematic literature review. Rev Lat Am Enfermagem 2011; 19(1): 212-21.
20.Darcy AE, Hancock LE, Ware EJ. A descriptive study of noise in the neonatal intensive care unit. Ambient levels and perceptions of contributing factors. Adv Neonatal Care 2008; 8(3):165-75. 21.Evans JB, Philbin MK. Facility and operations
planning for quiet hospital nurseries. J Perinatol 2000; 20(8 Pt 2): S105-12.
22.Chen HL, Chen CH, Wu CC, Huang HJ, Wang TM, Hsu CC. The influence of neonatal intensive care unit design on sound level. Pediatr Neonatol 2009; 50(6):270-4.
23.Milette I. Decreasing noise level in our NICU: The impact of a noise awareness educational program. Adv Neonatal Care 2010; 10(6):343-51.
24.Ramesh A, Suman Rao PN, Sandeep G, Nagapoornima M, Srilakshmi V, Dominic M, Swarnarekha. Efficacy of a low cost protocol in reducing noise levels in the neonatal intensive care unit. Indian J Pediatr 2009; 76(5):475-8.
25.Krueger C, Wall S, Parker L, Nealis R. Elevated sound levels within a busy NICU. Neonatal Netw 2005; 24(6): 33-7.
26.Joseph A, Ulrich R. Sound control for improved outcomes in healthcare settings. The Center for Health Care Design 2007; 4:1-15.
27.Richardson A, Thompson A, Coghill E, Chambers
I, Turnock C. Development and implementation of a noise reduction intervention programme: a pre- and postaudit of three hospital wards. J Clin Nurs 2009; 18(23):3316-24.
28.Johnson AN. Adapting the neonatal intensive care environment to decrease noise. J Perinat Neonatal Nurs 2003; 17(4):280-8.
29.Nathan LM, Tuomi SK, Müller AM. Noise levels in a neonatal intensive care unit in the Cape metropole. South African Journal of Child Health 2008; 2(2):50-4.
30.Elander G, Hellström G. Reduction of noise levels in intensive care units for infants: Evaluation of an intervention program. Heart Lung 1995; 24(5):376-9. 31.Byers JF, Waugh WR, Lowman LB. Sound level exposure of high-risk infants in different environmental conditions. Neonatal Netw 2006; 25(1):25-32.
32.White-Traut RC, Nelson MN, Silvestri JM, Patel M, Lee H, Cimo S, McReynolds E. Maturation of the cardiac response to sound in high-risk preterm infants. Newborn and Infant Nursing Reviews 2009; 9(4):193-9.
33.Johnson AN. Neonatal response to control of noise inside the incubator. Pediatr Nurs 2001;27(6): 600-5.
34.Nathan L. Noise levels in a neonatal intensive care unit in the cape metropole [Master Thesis]. Stellenbosch: University of Stellenbosch; 2007. 35.McLendon D, Check J, Carteaux P, Michael L,