0 INTRODUCTION
Traditional computer modelling is performed using CAD systems. Everything starts with a constructor idea. They present their concept on a technical drawing and then perform it in a virtual environment of a 3D model. This model may then be manufactured with the use of available methods. The problem arises when technical documentation of an object, for example, a tooth model, is not available.
2D images are the traditional way of presenting anatomical structures; unfortunately, this method is sometimes ineffective. In advanced cases of dental conditions, there are difficulties in the recognition and proper interpretation of 2D images of the affected area. This is why other ways to show the shape of the complex internal structures have been researched, such as the Marching Cube [1] and [2] and Splitting Box algorithm [3]. With the development of computer tomography systems, it has become possible to obtain volumetric data. Thanks to processing the volumetric data, a 3D computer model of a scanned
part can be created as a result. Next, medical models can be manufactured using subtractive [4] or additive
techniques [5] and [6]. Due to the complexity of
the reconstruction process of medical models, the accuracy of an output model is dependent on a 3D scanning method, such as structure light [7], MDCT [8] and [9], CBCT [10] and [11], and MRI systems [12]. Scientists also present work about a comparative evaluation of CBCT and MDCT at the stage of image reconstruction [13] and [14] and accuracy reconstruction 3D model [15]. The reconstruction process is also dependent on spatial and contrast resolution of computer tomography systems [16] and [17] method of segmentation [18] software algorithms [19] and [20], and a manufacturing technology [7] and [21].
Additive techniques are based on the incremental building of objects. They are the opposite of subtractive methods of manufacturing, often described as conventional, where an object is shaped via mechanical removal of material. Rapid prototyping (RP), i.e. additive manufacturing of physical models
Analysis of the Accuracy of Reconstructed Two Teeth Models
Manufactured Using the 3DP and FDM Technologies
Budzik, G. – Burek, J. – Bazan, A.– Turek, P. Grzegorz Budzik – Jan Burek – Anna Bazan – Paweł Turek
The Rzeszow University of Technology, Department of Mechanical Engineering, Poland
This paper presents results of the research focused on the accuracy of the manufacturing process of biomedical models, specifically tooth models. A patient’s head was scanned with cone-beam computer tomography (CBCT). The best effect of tooth geometry reconstruction was obtained using the isotropic dimensions of voxel 0.2 mm × 0.2 mm × 0.2 mm. The same Hounsfield value was used (1254HU) and the method of segmentation (region growing) applied for the models of the teeth in the process of 3D reconstruction. The marching cubes algorithm, a method of surface rendering, allowed fully reconstructing the 3D geometry. The models were manufactured using two additive techniques (3DP and FDM). They were similarly aligned in the work space of both printers to maintain similar conditions of printing, and similar layer thicknesses of 0.1 mm and 0.13 mm were used. The printed models were scanned using a focus variation (FV) microscope. The scanned geometry of the models of the two teeth was compared with the geometry of the teeth after their segmentation and filtering. A fitting process was carried out using the best fit algorithm with a fitting condition of 0.001 mm. The achieved accuracy of the FV measurements was significantly higher than the accuracy of the used printing methods. FV can be applied to performing 3D scans of complex shapes such as the crown and roots of a tooth. 3DP models have more homogenous structure, whereas layer structure is easy to recognize for FDM models. Due to that, the 3DP models have to be strengthened using infiltration, which makes it more difficult to predict the final dimensions and to achieve required accuracy.
Keywords: dental model, reverse engineering, rapid prototyping, focus variation
Highlights
• The accuracy of FDM and 3DP techniques were examined in terms of manufacturing dental models such as tooth models. • The infiltration applied to the 3DP models reduced in accuracy compared to FDM models.
• For the FDM models, the values of mean deviation were negative and met the accuracy specified by the printer’s manufacturer. • Due to infiltration the values of mean deviation of 3DF models were positive.
• The infiltration also caused the models manufactured with the FDM to be more accurate than the 3DP ones.
[22] and [23] rapid tooling (RT) [24] and machining [25] are currently used to fabricate dental models. These models help a surgeon to diagnose, plan a treatment [26] and [27] and perform surgery [28] and [29].
In the field of biomedical applications, additive manufacturing (AM) has great advantages over subtractive methods when it comes to building intricate shapes matching human anatomy as well as constructing complex porous microstructures [30]. There is a broad variety of devices using the additive methods currently on the market. Each device has specific characteristics and requirements regarding material, environmental conditions, the temperature of the process, the and stage of the final model preparation. Due to the diversity of properties and the varied availability of the RP technologies, none of these dominates in the field of medical applications; this applies to dental surgery as well [25].
The RP technologies are open to new possibilities for the development of customized applications such as the manufacture of dental models. Scientists are still conducting research to obtain reasonable accuracy at the stage of processing 2D data [10] and [11], as well as to improve the quality of dental models manufactured using the RP [31] and [32],working on material properties [33] and to find an optimal measurement system for inspecting dimensions [34] and [35].
The purpose of this investigation is to analyse the accuracy of the models of two teeth manufactured with the use of different RP methods. Because 3D printing (3DP) and fused deposition modelling (FDM) are one of the most widely used RP methods, as well as due to the relatively low cost of these processes, they were chosen for this research.
An additional aim of this paper is to evaluate a focus variation (FV) microscope as a measuring system for inspecting small parts with complex geometry, such as dental models.
1 METHOD
Three-dimensional computer models of 2 teeth were obtained by scanning the patient’s mandible with the cone beam computer topography method and subsequent segmenting the teeth from measured data. After performing geometry reconstruction, the models were printed using the two RP methods, i.e. FDM and 3DP. Next the printed models were measured using an FV microscope. The measured geometries of the models of the two teeth were compared with
geometries of the teeth after their segmentation and filtering.
1.1 Reconstruction of Geometries of the Teeth from DICOM Data
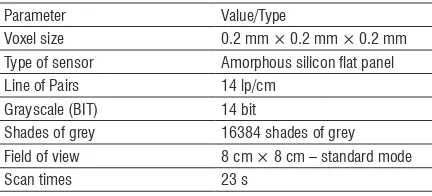
All measurements of the mandible were made with a cone bean computer tomography system - Gendex CB500 3D by a medical partner. The maximum resolution of Gendex is 0.125 mm; however, parameters are set up for each patient individually. Table 1 presents parameters used during the measurements. To minimize artefacts associated with discontinuous interpolation, the isostructure of the voxel (0.2 mm × 0.2 mm × 0.2 mm) was used. The obtained data included a stack of individual images. Each image represented a thin slice of the scanned body part and was composed of individual pixels. Those pixels were arranged on a two-dimensional grid.
The scanned data of the patient’s mandible obtained using the cone-beam computed tomography (CBCT) and stored as images in the digital imaging and communications in the medicine (DICOM) format were subsequently processed in software 3D Doctor to reconstruct the geometry of the two separated teeth.
Table 1. Parameters used in measurements with Gendex CB500 3D
Parameter Value/Type
Voxel size 0.2 mm × 0.2 mm × 0.2 mm Type of sensor Amorphous silicon flat panel Line of Pairs 14 lp/cm
Grayscale (BIT) 14 bit
Shades of grey 16384 shades of grey Field of view 8 cm × 8 cm – standard mode
Scan times 23 s
To increase accuracy, the images were subjected to filtration, reducing noisy and blurred edges. Noise reduction and sharpening parameters were chosen empirically to obtain the best results.
To separate a tooth from the mandible, a region-growing algorithm was used. The region-region-growing algorithm allows to select pixels with similar Hounsfield units (HU) and classify them into a group defining the given tissue [18]. The threshold value was set above 1254HU to select only the tissue that represented a segmented tooth.
[1] and [2] (Fig. 1). This algorithm guarantees that the resulting surfaces are free from cracks and holes, that no facet (single surface build on three nearest points) intersects one another, and that all regions assigned to different materials are well separated from one another. A disadvantage of this technique is that small details of a segmented data set may be lost.
a) b)
Fig. 1. Tooth models reconstructed from the DICOM data: a) tooth 1, b) tooth 2
1.2 Manufacturing Models of the 2 Teeth Using Rapid Prototyping Technologies
The models were manufactured using the two rapid prototyping technologies: FDM and 3DP. These methods are cheaper than others used in the dental industry such as PolyJet or SLS. Furthermore, the accuracy of FDM models is comparable to those of PolyJet or SLS. FDM and 3DP were also chosen for the reason of testing an FV microscope as a measuring system for printed models. The authors were curious about the results of measuring white powder and white/cream plastic, which are materials with different optical properties.
FDM is the most widely used additive technique in manufacturing medical replicas after
stereolithography [21]. An FDM model is built of
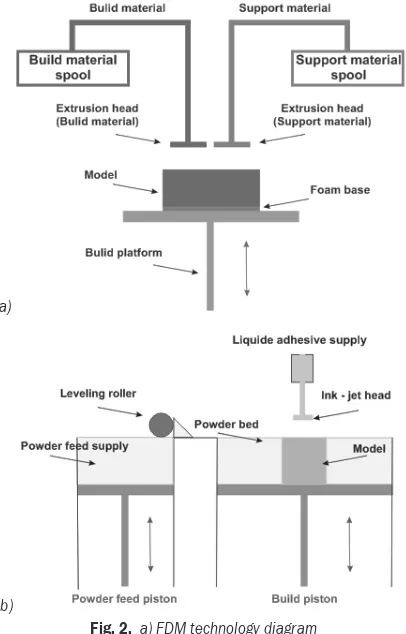
thin layers of thermoplastic wire similar to filaments (Fig. 2a). Filaments of heated thermoplastic wire are
extruded from a tip that moves in the xy-plane. The
platform is maintained at a lower temperature so that the thermoplastic hardens quickly. After the platform descends, an extrusion head deposits a second layer on the first. Along the way, support is built and fastened to a printed part either with a second, weaker material or with a perforated linkage. Support structures are fabricated for overhanging geometries and are later removed by breaking them away from the object. A water-soluble support material that can be easily washed away is also available. Several types
of materials are available for building models, e.g. acrylonitrile butadiene styrene (ABS) which offers good strength, or polycarbonate and polysulfide materials that have recently increased the capability of the FDM method in terms of strength and temperature range. The advantage of the FDM method is that there is no need for untidy liquid photopolymers, powders and lasers [36].
A 3D printing system uses print heads to selectively disperse a binder onto powder layers (Fig. 2b). A thin layer of powder is spread over a tray with a roller. A print head scans the powder tray and delivers continuous jets of a solution that binds powder particles (mostly gypsum powder) as it touches them. After one layer of a model is built, the powder bed is lowered, and the next layer of powder is spread. No support structure is required while a prototype is fabricated because surrounding powder supports unconnected parts. When the process is completed, the surrounding powder is aspirated.
a)
b)
Fig. 2. a) FDM technology diagram b) 3D printing technology (3DP) diagram
the structure. An advantage of the 3DP technology is the low cost of a printed model [36].
The sets of the process parameters used to manufacture the models of the two teeth are presented in Table 2. In both the printers, the models were similarly aligned in the work space to maintain similar conditions of production.
Table 2. Parameters used in manufacturing the models of the 2 teeth
FDM
Printer Fortus 360 mc Accuracy
(p = 99.7%) Parts are produced with the accuracy of ± 0.2 mm [37] Material ABS
Layer thickness 0.127 mm
Manufacturing time Tooth 1 to 15 min Tooth 2 to 30 min
3DP
Printer ZPrinter 650 Accuracy
(p = 99.7%) Parts are produced with the accuracy of ± 0.18 mm (with no infiltration) [38] Material gypsum powder
Infiltrating material epoxy resin Layer thickness mm
Manufacturing time Tooth 1 to 20 min Tooth 2 to 35 min
1.3 Measurement of the Printed Models
Measurements of the printed elements were carried out using the Alicona InfiniteFocus microscope based on a measurement method called FV. The operating principle of an FV microscope combines the small depth of focus of the optical system with the vertical scanning of a specimen.
Focus variation is an area-based method in which many points are measured with one vertical scan. In the FV method, information on image sharpness of a measured surface is used to determine surface height as a function of position (x, y) [39] and [40].
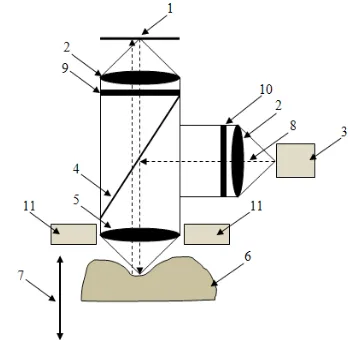
The construction and operating principle of an FV microscope are shown in Fig. 3. The optical system is moved in the vertical direction along the optical axis in the range in which all points of a scanned surface are shown as sharp. In certain positions from this range, white light, emitted by a light source, is delivered through a semi-transparent mirror and lenses and illuminates the sample. The light reflected by the scanned surface is projected through the semi-transparent mirror and the lenses to a charge-coupled device (CCD) sensor. During the vertical movement of the optical system, contrast on the CCD sensor is changing relative to the change of focus. A contrast curve is calculated for every lateral position (pixel) on the CCD sensor and for the whole vertical scanning
range. With the contrast curve, the Z position where
the sample was in focus can be determined (Fig. 4). This allows to relate the vertical position of the optical
system to Z coordinates of the points on the scanned
surface [41].
Fig. 3. Diagram of the focus variation scanning method: 1 CCD sensor, 2 lenses, 3 white light source, 4 semi-transparent mirror,
5 objective lens with limited depth of field, 6 sample, 7 vertical movement with a driving unit, 8 light rays from the white light
source, 9 optional analyzer, 10 optional polarizer and 11 optional ring light
Fig. 4. Change of focus with respect to Z position
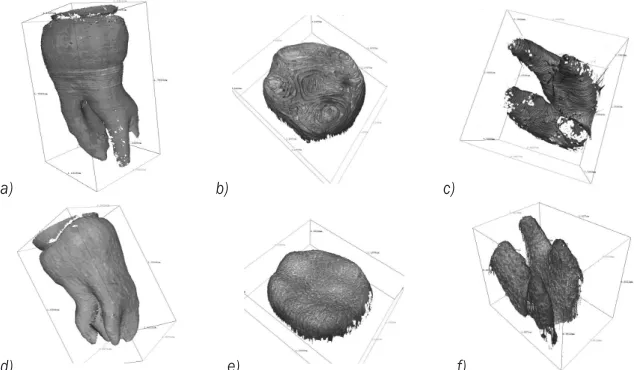
For each vertical position of the optical system, several scans of contrast are carried out. Consequently, it is possible to calculate the repeatability of measurement for each point. Due to the complexity of the geometry of the measured models, they were scanned in parts. The FDM and 3DP models of Tooth 1 were scanned in two parts – side surface and top surface (Fig. 5), and Tooth 2 models were scanned in three parts – side surface, top surface, and roots (Fig. 6).
of vertical and lateral resolution can be set. Each objective is also characterized by the field of view. Additionally, the distance between the objective lens and a measured surface varies for each objective; the higher magnification, the smaller the distance between the lens and a sample. In the studied case, where complex geometry was measured, especially for the roots and the side surface of Tooth 2, it was essential to choose an objective for which the working distance would be long enough to avoid collision during the measurement. This is why the 2.5× objective was chosen. The vertical resolution for this objective can be set in the range from 2.3 µm to 132.51 µm, and the lateral resolution from 6.92 µm to 58.71 µm.
During the research, several sets of resolutions’ values were used at testing stage. The set that offers the best quality was chosen for the final measurements. Measurement settings (i.e. vertical and lateral resolution) for each scan are presented in
Table 3. Information regarding the repeatability of measurements of the tooth 1 and the tooth 2 are shown in Table 4.
Table 3. Infinite focus scan setting
Tooth Scanned part Vertical resolution [μm]
Lateral resolution [μm] Tooth 1 side surface 15.5 19.57 Tooth 1 top surface 15.5 19.57 Tooth 2 side surface 26.76 27.86 Tooth 2 top surface 15.22 19.57
Tooth 2 Roots 7.08 16.27
Scanned geometries of the models of the 2 teeth were compared with the geometries of the teeth after their segmentation and filtering. The fitting process was carried out using the best fit algorithm with a fitting condition of 0.001 mm.
a) b) c) d)
Fig. 5. Scanned point clouds of the FDM model of the tooth 1: a) side surface, b) top surface, and of the 3DP model of the tooth 1: c) side surface, d) top surface
a) b) c)
d) e) f)
Table 4. Repeatability information of scanned point clouds
Scanned part
FDM 3DP
Repeatability threshold [μm]
Mean repeatability [μm]
Median repeatability [μm]
Repeatability threshold [μm]
Mean repeatability [μm]
Median repeatability [μm]
Tooth 1 side surface 5.39 2.32 2.13 1.63 0.59 0.51
top surface 11.5 3.39 1.87 10.02 1.47 1.07
Tooth 2
side surface 7.75 3.0 2.43 2.33 0.44 0.33
top surface 59.1 9.21 4.01 29.8 8.89 3.62
roots 76.6 11.9 5.8 13.2 3.23 1.96
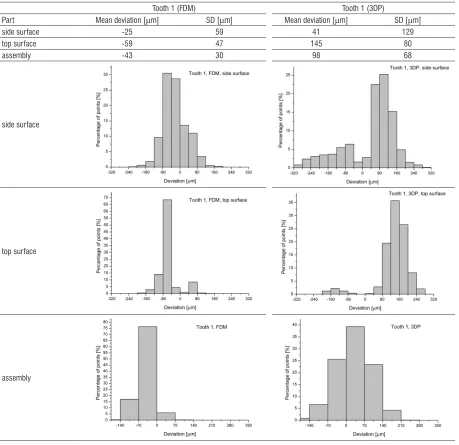
Table 5. Results of comparison between the CAD models reconstructed from the DICOM data and the printed models (Tooth 1)
Tooth 1 (FDM) Tooth 1 (3DP)
Part Mean deviation [μm] SD [μm] Mean deviation [μm] SD [μm]
side surface -25 59 41 129
top surface -59 47 145 80
assembly -43 30 98 68
side surface
top surface
assembly
The comparison was made for all the scanned parts of the teeth as well as for the scanned parts assembled into complete tooth geometries. The
of mean deviation of an inspected part, standard deviation (SD) for these values, and distribution of deviations of the printed models are shown in Table 5 for Tooth 1 and in Table 6 for Tooth 2.
3 RESULTS AND DISCUSSION
The models of the two teeth manufactured using the FDM and 3DP technologies were compared with their CAD models to examine their accuracy. Basic statistics (mean value and SD) and distributions of the printed models are gathered in Tables 5 and 6.
The accuracy of the fabricated models was influenced by errors of scanning, manufacturing, and the best-fit algorithm used.
Repeatability (Table 4) is the standard deviation of a series of the same measurements. Knowing the vertical resolution (Table 3) and the mean repeatability of scanning, it is possible to calculate a confidence interval at a specific level of significance. The confidence interval reflects the quality of scanning. The smaller the confidence interval, the better measurement.
The smallest 95 % confidence interval was calculated for the 3DP side surface, and it equalled to ±9 µm. The biggest 95 % confidence intervals were calculated for the FDM roots, the FDM top surface, and the 3DP top surface and they were ±27 µm, ±26 µm, and ±25 µm respectively.
Comparing the values of scanning resolutions and the scanning mean repeatability with the distributions of models’ deviations, it can be assumed that measurement errors have negligible influence on the results. The values of deviations far more exceed the scanning confidence intervals.
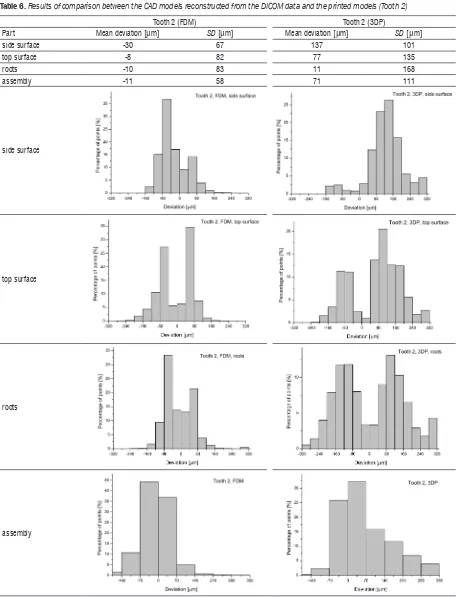
For all the inspected parts of the models of the two teeth and for the complete models, values of mean deviation were negative for FDM and positive for 3DP. In every case, except roots, the absolute value of the mean deviation was significantly higher for the 3DP models than for the FDM models. Higher and positive values of the 3DP models’ deviations were caused by infiltration of the models with an epoxy resin that increased their dimensions.
For all the parts and the complete models, the standard deviation of the deviations’ values was also much bigger for the 3DP than the FDM.
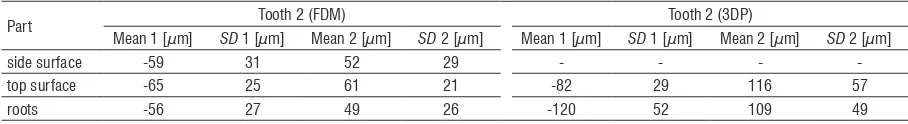
For the top surface and roots of the Tooth 2 models manufactured using the FDM and the 3DP, and the side surface of the FDM model of Tooth 2, a bimodal distribution of the deviations could be recognized. To perform the evaluation of these parts, each original distribution was separated into two
distributions using the peak fit function available in OriginPro 9.1. The mean value and the standard deviation of the components are presented in Table 7.
For all the above-mentioned parts, it can be observed that one mean value of components’ distributions is positive and the second is negative, and the modes are symmetrical with respect to 0. Also in each case, the antimode is near 0. It can be then assumed that the observed bimodal distributions are composed of distributions of the positive and negative deviations. That implicates low and similar values of mean deviation when the distributions are evaluated as unimodal (Table 6).
The observed bimodality may indicate an error during the fitting process, specifically the rotation/ translation of the measured models with respect to nominal shape (reconstructed CAD models).
All the calculated statistics of the components are significantly smaller for the FDM models than for the 3DP ones, as was previously observed for all unimodal distributions.
The values of mean deviations for the assemblies are approximately equal to the mean values calculated from the mean deviations of the scanned parts. Standard deviations for the assemblies are lower than the SD of the single parts, except the side surface of Tooth 2 manufactured with the 3DP. The greater number of points in the assemblies’ files allowed for a better fit to nominal, that is to CAD models.
It can be stated that FDM models are manufactured with the accuracy specified by the printer’s manufacturer (Table 2). In the case of the 3DP models, there is a lack of information on model accuracy after the infiltration. That is why the comparison with the data presented by the 3D printer’s manufacturer cannot be made.
4 CONCLUSIONS
The geometry of patient’s tooth crowns and roots can be obtained by scanning the patient’s mandible using CBCT. At the stage of acquiring and processing the data to create a 3D CAD model of a tooth, the voxel size and the Hounsfield value are the most significant parameters. The 3D CAD model saved as the standard template library (STL) file can be used to fabricate a physical model by one of the additive techniques.
Table 6. Results of comparison between the CAD models reconstructed from the DICOM data and the printed models (Tooth 2)
Tooth 2 (FDM) Tooth 2 (3DP)
Part Mean deviation [μm] SD [μm] Mean deviation [μm] SD [μm]
side surface -30 67 137 101
top surface -8 82 77 135
roots -10 83 11 168
assembly -11 58 71 111
side surface
top surface
roots
assembly
errors of scanning, manufacturing, and the used
the roots of the Tooth 2 models. Better fitting results were achieved for the assemblies rather than for the separate parts.
Upon comparing the mean deviations and their standard deviations, it can be concluded that the models manufactured with the FDM are more accurate than the 3DP ones. This is caused by the infiltration applied to the 3DP models. To be able to predict final dimensions and meet required accuracy of the 3DP models, it would be necessary to carry out further studies.
The focus variation method can be applied to measure parts with a complex shape, such as the crown and roots of a tooth. The achieved accuracy of measurement is significantly higher than the accuracy of the printing methods used. This means that measurement errors can be regarded as negligible. The focus variation method can be an alternative to the current measurement methods that are used in case of relatively small and complex dental models.
5 REFERENCES
[1] Lorensen, W., Cline, H. (1987). Marching cubes: a high resolution 3D surface construction. ACM SIGGRAPH Computer Graphics, vol. 21, no. 4, p. 163-169,
DOI:10.1145/37402.37422.
[2] Newman, T.S., Yi, H. (2006). A survey of the marching cubes algorithm. Computers & Graphics, vol. 30, no. 5, p. 854-879,
DOI:10.1016/j.cag.2006.07.021.
[3] Preim, B., Bartz, D. (2007). Visualization in Medicine: Theory, Algorithms, and Applications. Morgan Kaufmann Publishers Inc., San Francisco.
[4] Budzik, G., Burek, J., Dziubek, T., Gdula, M., Płodzień, M., Turek, P. (2015). The analysis of accuracy zygomatic bone model manufactured by 5-axis HSC 55 linear. Mechanik, vol. 88. (in Polish)
[5] Markowska, O., Budzik, G. (2012). Innovative methods of manufacturing bone implants using the reverse engineering (RE) and the rapid prototyping (RP) techniques. Mechanik, vol. 85. (in Polish)
[6] Salmi, M., Paloheimo, K.S., Tuomi, J., Wolff, J., Mäkitie, A. (2013). Accuracy of medical models made by additive manufacturing (rapid manufacturing). Journal of Cranio-Maxillo-Facial Surgery, vol. 41, no. 7, p. 603-609,
DOI:10.1016/j.jcms.2012.11.041.
[7] Budzik, G., Burek, J., Dziubek, T., Markowska, O., Turek, P., Pakla, P. (2014). Applications of rapid prototyping technology in the craniofacial surgery. 12th Conference Mechanics in
Medicine, p. 16-29.
[8] Ryniewicz, A. (2010). Accuracy assessment of shape mapping using computer tomography. Metrology and Measurement Systems, vol. 17, no. 3, p. 481-492, DOI:10.2478/v10178-010-0040-6.
[9] Nizam, A., Gopal, R.N., Naing, L., Hakim, A.B., Samsudin, A.R. (2006). Dimensional accuracy of the skull models produced by rapid prototyping technology using stereolithography apparatus. Archives of Orofacial Sciences, vol. 1, p. 60-66.
[10] Ye, N., Jian, F., Xue, J., Wang, S., Liao, L., Huang, W., Yang, X., Zhou, Y., Lai, W., Li, J., Wang, J. (2012). Accuracy of in-vitro tooth volumetric measurements from cone-beam computed tomography. American Journal of Orthodontics and Dentofacial Orthopedics, vol. 142, no. 6, p. 879-887,
DOI:10.1016/j.ajodo.2012.05.020.
[11] Maret, D., Telmon, N., Peters, O.A., Lepage, B., Treil, J., Inglèse, J.M., Peyre, A., Kahn, J.L., Sixou, M. (2012). Effect of voxel size on the accuracy of 3D reconstructions with cone beam CT. Dentomaxillofacial Radiology, vol. 41, no. 8, p. 649-655,
DOI:10.1259/dmf/81804525.
[12] Huotilainen, E., Paloheimo, M., Salmi, M., Paloheimo, K. S., Björkstrand, R., Tuomi, J., Mäkitie, A. (2013). Imaging requirements for medical applications of additive manufacturing. Acta Radiologica, vol 55, no. 1, p. 78-85,
DOI:10.1177/0284185113494198.
[13] Kim, M., Huh, K.H., YI, W.J., Heo, M.S., Lee, S.S., Choi, S.Ch. (2012). Evaluation of accuracy of 3D reconstruction images using multi-detector CT and cone-beam CT. Imaging Science in Dentistry, vol. 42, no. 1, p. 25-33, DOI:10.5624/ isd.2012.42.1.25.
[14] Liang, X., Jacobs, R., Hassan, B., Li, L., Pauwels, R., Corpas, L., Souza, P.C., Martens, W., Shahbazian, M., Alonso, A., Lambrichts, I. (2010). A comparative evaluation of cone beam computed tomography (CBCT) and multi-slice CT (MSCT) Part I. On subjective image quality. European Journal of Radiology, vol. 75, no. 2, p. 265-269, DOI:10.1016/j.ejrad.2009.03.042.
[15] Liang, X., Lambrichts, I., Sun, Y., Denis, K., Hassan, B., Li, L., Pauwels, R., Jacobs, R. (2010). A comparative evaluation of cone beam computed tomography (CBCT) and multi-slice CT (MSCT). Part II: On 3D model accuracy. European Journal of Radiology, vol. 75, no. 2, p. 270-274, DOI:10.1016/j. ejrad.2009.04.016.
[16] Alsleem, H., Davidson, R. (2013). Factors affecting contrast-detail performance in computed tomography: A review. Journal of Medical Imaging and Radiation Sciences, vol. 44, no. 2, p. 62-70, DOI:10.1016/j.jmir.2012.12.001.
Table 7. Statistics of components’ evaluated bimodal distributions
Part Tooth 2 (FDM) Tooth 2 (3DP)
Mean 1 [μm] SD 1 [μm] Mean 2 [μm] SD 2 [μm] Mean 1 [μm] SD 1 [μm] Mean 2 [μm] SD 2 [μm]
side surface -59 31 52 29 - - -
-top surface -65 25 61 21 -82 29 116 57
[17] Romans, L. (2011). Computed Tomography for Technologists: A Comprehensive Text. Wolters Kluwer Health, Lippincott Williams & Wilkins, Baltimore.
[18] Cerrolaza, M., Gavidia, G., Soudah, E., Martín-Landrove, M. (2014). Modeling human tissue: An efficient integrated methodology. Biomedical Engineering: Applications, Basis and Communications, vol. 26, no. 1, DOI:10.4015/ S1016237214500124.
[19] Vera, V., Corchado, E., Redondo, R., Sedano, J., García, Á.E. (2013). Applying soft computing techniques to optimise a dental milling process. Neurocomputing, vol. 109, p. 94-104,
DOI:10.1016/j.neucom.2012.04.033.
[20] Huotilainen, E., Jaanimets, R., Valášek, J., Marcián, P., Salmi, M., Tuomi, J., Mäkitie, A., Wolff, J. (2014). Inaccuracies in additive manufactured medical skull models caused by the DICOM to STL conversion process. Journal of Cranio-Maxillofacial Surgery, vol. 42, no. 5, p. e259-e265,
DOI:10.1016/j.jcms.2013.10.001.
[21] El-Katatny, I., Masood, S.H., Morsi, Y.S. (2010). Error analysis of FDM fabricated medical replicas. Rapid Prototyping Journal, vol. 16, no. 1, p. 36-43, DOI:10.1108/13552541011011695.
[22] Lambrecht, J.Th., Berndt, D.C., Schumacher, R., Zehnder, M. (2009). Generation of three-dimensional prototype models based on cone beam computed tomography. International Journal of Computer Assisted Radiology and Surgery, vol. 4, no. 2, p. 175-180, DOI:10.1007/s11548-008-0275-9.
[23] Salmi, M., Paloheimo, K. S., Tuomi, J., Ingman, T., Mäkitie, A. (2013). A digital process for additive manufacturing of occlusal splints: a clinical pilot study. Journal of the Royal Society Interface, vol. 10, no. 84, DOI:10.1098/rsif.2013.0203.
[24] Salmi, M., Tuomi, J., Sirkkanen, R., Ingman, T., Mäkitie, A. (2012). Rapid tooling method for soft customized removable oral appliances. The Open Dentistry Journal, vol. 6, p. 85-89,
DOI:10.2174/1874210601206010085.
[25] Martorelli, M., Gerbino, S., Giudice, M., Ausiello, P. (2013). A comparison between customized clear and removable orthodontic appliances manufactured using RP and CNC techniques. Dental Materials, vol. 29, no. 2, p. e1-e10,
DOI:10.1016/j.dental.2012.10.011.
[26] Figliuzzi, M., Mangano, F., Mangano, C. (2012). A novel root analogue dental implant using CT scan and CAD/CAM: selective laser melting technology. International Journal of Oral and Maxillofacial Surgery, vol. 41, no. 7, p. 858-862,
DOI:10.1016/j.ijom.2012.01.014.
[27] Papaspyridakos, P., Lal, K. (2008). Complete arch implant rehabilitation using subtractive rapid prototyping and porcelain fused to zirconia prosthesis: A clinical report. The Journal of Prosthetic Dentistry, vol. 100, no. 3, p. 165-172, DOI:10.1016/ S0022-3913(08)00110-8.
[28] Lee, J.H. (2014). Accelerated techniques for a post and core and a crown restoration with intraoral digital scanners and CAD/CAM and rapid prototyping. Journal of Prosthetic Dentistry, vol. 112, no. 5, p. 1024-1029, DOI:10.1016/j. prosdent.2014.04.019.
[29] Tuomi, J., Paloheimo, K.S., Vehviläinen, J., Björkstrand, R., Salmi, M., Huotilainen, E., Mäkitie, A.A. (2014). A
novel classification and online platform for planning and documentation of medical applications of additive manufacturing. Surgical Innovation, vol. 21, no. 6, p. 553-559,
DOI:10.1177/1553350614524838.
[30] Beaman, J.J., Atwood, C., Bergman, T.L., Bourell, D., Hollister, S., Rosen, D. (2004) Additive/subtractive manufacturing research and development in Europe. Final report by World Technology Evaluation Center, p. 55-62.
[31] Hazeveld, A., Slater, J.J.H., Ren, Y. (2014). Accuracy and reproducibility of dental replica models reconstructed by different rapid prototyping techniques. American Journal of Orthodontics and Dentofacial Orthopedics, vol. 145, no. 1, p. 108-115, DOI:10.1016/j.ajodo.2013.05.011.
[32] Reyes, A., Turkyilmaz, I., Prihoda, T.J. (2015). Accuracy of surgical guides made from conventional and a combination of digital scanning and rapid prototyping techniques. The Journal of Prosthetic Dentistry, vol. 113, no. 4, p. 295-303,
DOI:10.1016/j.prosdent.2014.09.018.
[33] Baloš, S., Milutinović, M., Potran, M., Vuletić, J., Puškar, T., Pepelnjak, T. (2015). The mechanical properties of moulded and thermoformed denture resins. Strojniški vestnik - Journal of Mechanical Engineering, vol. 61, no. 2, p. 138-145,
DOI:10.5545/sv-jme.2014.2249.
[34] Budak, I., Trifkovic, B., Puskar, T., Vukelic, D., Vucaj-Cirilovic, V., Hodolic, J., Todorovic, A. (2013). Comparative analysis of 3D digitization systems in the field of dental prosthetics. Technical
Gazette - Tehnički vjesnik, vol. 20, no. 2, p. 291-296.
[35] Flügge, T.V., Schlager, S., Nelson, K., Nahles, S., Metzger, M.C. (2013). Precision of intraoral digital dental impressions with iTero and extraoral digitization with the iTero and a model scanner. American Journal of Orthodontics and Dentofacial Orthopedics, vol. 144, no. 3 , p. 471-479, DOI:10.1016/j. ajodo.2013.04.017.
[36] Hollister, S.J. (2005). Porous scaffold design for tissue engineering. Nature Materials, vol. 7, no. 4, p. 518-24,
DOI:10.1038/nmat1421.
[37] Hanssen J., (2013), FORTUS 360mc/400mc ACCURACY STUDY, from http://www.stratasys.com/ accessed on 2013-03-18.
[38] ZPrinter Materials and Accuracy. (2011). Functional Performance and Accuracy of 3D Printed Models, from http:// www.3d-sourcegraphics.com/ accessed on 2011-06-02
[39] Danzl, R., Helmli, F., Scherer, S. (2011). Focus variation – a robust technology for high resolution optical 3D surface metrology. Strojniški vestnik - Journal of Mechanical Engineering, vol. 57, no. 3, p. 245-256, DOI:10.5545/sv-jme.2010.175.
[40] Giusca, C., Claverley, J., Sun, W., Leach, R.K., Helmli, F., Chavigner M.P.J. (2014). Practical estimation of measurement noise and flatness deviation on focus variation microscopes.
CIRP Annals - Manufacturing Technology, vol. 63, no. 1, p. 545-548, DOI:10.1016/j.cirp.2014.03.086.
[41] Helmli, F. (2011). Focus variation instruments. Leach, R. (ed.)