Volume 6, Number 2, pp. 35–44. http://www.scpe.org c 2005 SWPS
GRID-BASED VIRTUAL REALITY VISUALIZATION OF VOLUME DATA
PAUL HEINZLREITER , DIETER KRANZLM ¨ULLER , AND JENS VOLKERT∗
Abstract. Grid computing evolves into a standard method for processing large datasets. Consequently most available grid applications focus on high performance computing and high-throughput computing. Using the Grid Visualization Kernel GVK, which is a grid middleware extension built on top of the Globus Toolkit, interactive visualization of the acquired simulation results can be performed directly on the grid. An example is the visualization of volume data within Virtual Reality environments, where the data for visualization is generated somewhere on the grid, while the user explores the visual representation at some other place on the grid.
Key words. grid computing, scientific visualization, interaction, virtual reality
1. Introduction. Grid computing is an approach enabling high-performance and high-throughput com-puting to exploit resources across organizational boundaries for calculation-intensive tasks in science and en-gineering [9]. Example application areas for grid computing are medical imaging, physics simulations, and satellite image processing. Due to the large amounts of data involved, such application’s demand for computa-tional power can barely be satisfied by using computacomputa-tional resources of only one organization.
For this reason grid computing offers persistent use of computational resources within virtual organizations spanning several countries or even continents. These virtual organizations are realized by grid middleware such as Globus [6], which deliver an abstraction of the underlying hardware, and therefore foster flexible and portable software development. Other middleware approaches such as Unicore [23], Cactus [3], or Legion [12] have also been proposed in the field of scientific data processing.
As an extension to these grid middleware toolkits, the Grid Visualization Kernel GVK aims at grid-enabled data visualization. Due to the nature of many grid applications, GVK’s initial focus lies on the visualization of three-dimensional volume data as for example medical volume datasets. Providing such a flexible visualization component within a grid environment has major benefits such as flexibility concerning hardware due to the common grid middleware layer and direct access to visualization services running on the grid. For simulations exploiting the possibilities of grid computing, GVK offers a possibility to realize the required visualizations without being restricted to the usage of a specific visualization device. Therefore it supports various visualization devices including standard desktop workstations and even sophisticated Virtual Reality (VR) environments such as the CAVE [4]. The exploitation of virtual reality techniques is particularly useful in the field of scientific visualization due to the complexity of the involved datasets.
Comparable approaches to GVK are CAVERN [19], CUMULVS [11], WireGL [14], Chromium [15], VLAM-G [2], and Dv [1]. CAVERN mainly focuses on collaborative environments that consist of multiple interconnected VR devices. CUMULVS supports interactive distributed visualization of large data fields. WireGL is a dis-tributed implementation of OpenGL, which enables parallel rendering. Chromium, which is originally based on WireGL is a high-performance rendering tool mainly targeted at homogeneous cluster platforms.
A globus-based distance visualization approach is presented in [8]. It is applied for remote rendering of tomographic images and relies heavily on Globus services.
VLAM-G [2] is a grid-based software environment focused at experimental science. It provides visualization capabilities to the user while hiding the complexity of the underlying grid infrastructure from the user. Like GVK, Dv [1] also provides a visualization pipeline distributed over the grid. In contrast to GVK, Dv transmits the program to be executed within the visualization process together with the data from one grid node to the next.
Compared to these approaches, GVK is designed as a grid middleware component extending the possibilities of grid computing towards more efficient visualization methods that fully exploit the computational power of the underlying grid.
This paper describes the volume visualization capabilities and interaction modes of GVK. In Section 2 a brief overview of GVKs structure and VR visualization is given, while Section 3 describes the interaction in the context of scientific visualization offered by GVK. In Section 4 an overview over the data transmission mechanisms within GVK is provided whereas Section 5 describes necessary data transport optimizations. Section 6 describes an an
∗GUP, Johannes Kepler University Linz, Altenbergerstr. 69, A-4040 Linz, Austria/Europe
application example for grid-based interactive visualization. After that, Section 7 shows some results including rendered images and measurements before an outlook on future work concludes the paper.
The following section provides an overview of the general GVK structure and the VR visualization possi-bilities provided to the user.
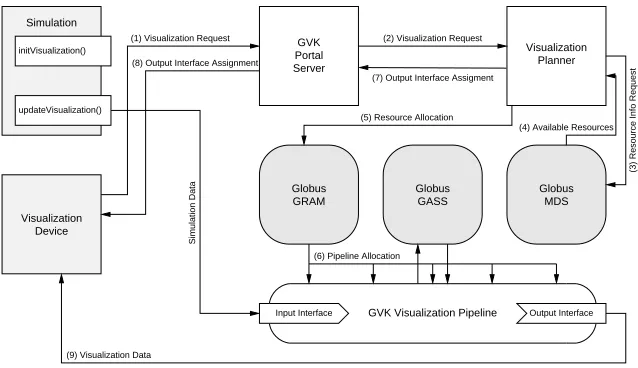
2. The GVK Architecture for Virtual Reality Visualization. The design of the GVK architecture focuses on flexibility and efficiency, which are crucial to enable visualization on arbitrary devices connected to the grid. A major problem is posed by the limited network bandwidth available for transmitting visualization data. Support for optimized data transmission across grid nodes requires that GVK itself consists of various subsystems distributed over the nodes involved in the visualization. A block diagram containing the main modules of GVK and illustrating the data flow between them is shown in Figure 2.1. The GVK portal server
Visualization Planner
GVK Visualization Pipeline
Input Interface
(5) Resource Allocation
Globus GRAM Globus GASS Server Output Interface Globus Portal MDS GVK
(7) Output Interface Assigment (8) Output Interface Assignment
(1) Visualization Request
(4) Available Resources
(3) Resource Info Request
(6) Pipeline Allocation
(2) Visualization Request
Simulation Data
(9) Visualization Data
Device Visualization
Simulation
initVisualization()
updateVisualization()
Fig. 2.1.GVK operational structure
receives the visualization request, which contains all required metadata like visualization type and input data location. The requests are forwarded to the visualization planner, which derives an appropriate visualization strategy based on the information provided by the visualization request and resource availability information obtained from Globus MDS [5]. In the next step the required resources are allocated and the visualization pipeline is constructed.
Later on, the visualization cycle is initialized by downloading the required data from the simulation server. The data is processed by sending it through the pipeline, which accomplishes the required data transformations (e.g. isosurface generation in case of volume visualization). Finally the generated graphics primitives are sent to the visualization device.
Supporting interaction with the user is achieved by collecting events from the visualization device, processing them in the main GVK subsystem and sending them back to the simulation server to reflect the interactive changes by the user within the simulation. Because network transportation optimizations are crucial to GVK, Globus IO is used as a relatively low level API which provides the required flexibility in network programming by providing a socket-type access.
An example visualization device connected to GVK is the CAVE [4], which enables the real-time visualiza-tion of interactive and complex data in a room-sized projecvisualiza-tion environment. The usage of such VR visualizavisualiza-tion techniques is expected to be useful for visualizing large amounts of data, because of the multiple dimensions and the immersion provided through stereo representation. OpenGL [24] was chosen for implementing the subsystem running on the visualization device because of its flexibility, its broad hardware support on desktop workstations, and easy integration of the CAVE and most other VR visualization devices.
At present, the GVK visualization system can cope with different types of input data: • Three-dimensional volume data
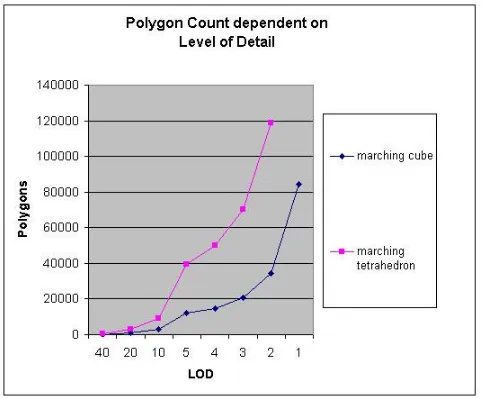
Most of the input data processed by GVK is represented as three-dimensional volume data, due to the widespread use of this data format within the context of scientific visualization. To enable fast visualization of such data it is necessary to generate representations suitable to hardware-accelerated rendering such as triangulated isosurfaces or impostors. For the isosurface generation the well-know Marching Cubes algorithm [21] and the advanced Marching Tetrahedron algorithm are applied. Because of its computational requirements the isosurface triangulation is executed in the grid. The flexible representation of the volume data to be rendered by a voxel model allows the encoding of arbitrary additional information per voxel within the model. This is implemented by storing a string for each voxel which encodes required information, like for example density values, material properties, or flow field vectors. The necessary description of the string semantics is delivered to the GVK main subsystem by the visualization request. The visualization of two-dimensional grid data is done by triangulating the given data by means of adaptive mesh algorithms [13].
3. Interaction within GVK. An important feature of GVK is interactivity within the generated visual-ization scenarios. The devices which can be used for interaction depend on the type of visualvisual-ization environment. Sitting in front of a conventional desktop workstation, the user is limited to keyboard and mouse in most cases. If a VR device like the CAVE is used, the interaction can be performed using devices that support six degrees of freedom like the wand, which is a three-dimensional mouse for virtual environments. Another possible extension is given by natural voice input [16]. There are two different modes of interaction:
• Local interaction
• Interaction with feedback to the simulation
Interaction techniques which can be handled locally on the visualization device are well-known techniques concerning changes of the observer’s viewpoint and transformations of the whole model like scaling, rotation, and translation. These types of interaction can be processed autonomously on the visualization device without producing latency imposed by limited network bandwidth.
A more complex type of interaction affects the visual representation and the simulation data itself. At first the change requests are sent back to the GVK main subsystem, which processes them to calculate the necessary modifications for the simulation. Then the updated values are sent back to the simulation server. A drawback of this interaction mode is given by the requirement for the simulation to provide a specific interaction interface to GVK.
An example of such an interaction module is a generic voxel editor applicable to a wide range of three-dimensional volume data structures. The altered data structures are feed back to the remote simulation process. Afterwards, a new simulation cycle is invoked. Simultaneously the visualization is updated according to the users interaction. Thereby the user gets visual feedback about the effects of online data alteration. Consider for example a flooding simulation in which the user can virtually break a dam by successive removal of the voxels it is composed of. The editor supports following operations:
• Location-based selection • Content-based selection • Voxel deletion
• Voxel copy/cut/paste
Contrary to the straightforward implementation of the data modification operations, the selection has to be more sophisticated due to the huge amount of voxels composing a typical volume representation.
Content-based selection is a valuable tool if the user wants to visualize only a subset of the available data, which can be identified by its attributes. Given a input dataset consisting of a density value per voxel, one can select only a specific range of density values. Another interesting scenario from the medical application domain would be a set of volume data containing different types of body tissues. In this case content based selection enables exclusive rendering of the tissue type of interest.
Fig. 3.1.Selection Cube
Another approach is given by a selection cube, as shown in Figure 3.1, where the user at first specifies the position of the cube center along the pick-ray, followed by the size of the cube. Within a VR environment, where a 3D mouse is available, the cube can be positioned directly by evaluating the location of the input device.
The selected triangles are sent to the main GVK subsystem which in turn determines the affected voxels. This can be accomplished by mapping the position of the selected triangles onto the voxel model. After applying the desired modifications to the selected voxels they are sent back to the GVK-enabled simulation, which then updates its internal data structures.
If the user requests a pasting operation of an e.g. previously copied region the semantics of that operation has to be specified, especially if the target region is not completely empty. The following actions are possible:
• Voxel replacement • Voxel value addition • Voxel value subtraction • Filling of empty regions
A replacement of voxels in the target region is simple approach for handling a paste operation and for many use cases it is sufficient. For the value addition and substraction the content of the voxels is interpreted as a numerical value. The value after the paste operation is calculated out of the current voxel contents. If the target region is partially empty, only the empty voxels could be filled with the new values.
4. Data Transmission. This section presents the different data transmission modes which are provided by GVK. To cope with the security issues arising within grid environments GVK relies on the security mechanisms provided by Globus such as GSS-API [7].
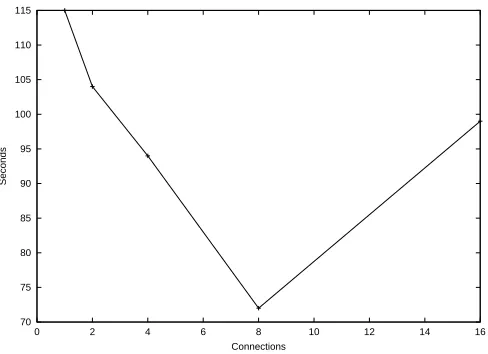
4.1. Basic GVK Communication. The modules involved in a visualization are arranged to form an ap-propriate pipeline and get interconnected by GVK communication connections. The basic GVK communication functionality is provided by point-to-point connections, which are built on top of Globus IO. In addition to con-ventional data transmission the transmission over multiple connections based on threads as well as transmission of data described by a grammar which is sent in advance is provided. The sensibility of data transmission over multiple connections is illustrated in Figure 4.1. It shows a local minimum for the transmission time using eight connections which can be explained by the reduced probability of a random packet loss during transmission [18]. The transmission of typed data sends a structural description of the data as a preamble, so that the receiving side can at first build the appropriate data structures if they are not already agreed upon by the communication partners. Currently, the data format can contain basic integer and float data types as well as arrays and structures, which can be mutually nested in order to provide the appropriate description of the applications data.
4.2. Visualization Pipeline Construction . The point-to-point connections used for communication are constructed according to the well-known client-server model. There are two necessary conditions for a visualization pipeline:
1. The server has to be available at client startup 2. Deadlocks must be avoided
70 75 80 85 90 95 100 105 110 115
0 2 4 6 8 10 12 14 16
Seconds
Connections
Fig. 4.1.Transmission of 400 MB over multiple connections
The distinction between client and server side of a connection is only required during pipeline construction in order to fulfill the first of the above conditions. During the visualization process each connection endpoint can send and receive data regardless of its client or server role.
Considering a simple visualization pipeline consisting of three modules the main challenge during visualiza-tion pipeline construcvisualiza-tion is given by the connecvisualiza-tions which send the interacvisualiza-tion data describing the user input back to the simulation source.
For the GVK visualization planner, which constructs the pipeline, the visualization device is considered as a pure server, which means it is only handling server type connections. In contrast, the simulation data source is considered a pure client feeding input data into the visualization pipeline. The modules in between are hybrids acting as a server towards the the simulation data source and as a client on the visualization side. The main dataflow is directed from the client to the server side. With the interaction data being sent in the opposite direction its the other way around. The reason for the configuration is given by the requirement that for all connections between two components the client and server ends must be the same. This enables a working invocation sequence for the whole visualization pipeline starting at the visualization end.
In contrast to this strict requirements, the server and client roles which are presented to the user can be different. For example, if the user sends the visualization request from the visualization device, the device acts as client towards the GVK portal server.
4.3. Interaction Protocol. If an interactive visualization is required, the complexity of the visualization pipeline and the number of connections involved is increased significantly by adding dedicated connections for user input. In most cases these datastreams interconnect the same modules as the connections for visualization data.
An important issue for interactive visualizations is the reduction of the latency which is imposed by the network and the processing nodes involved. The following measures can reduce the impact of latency:
• Reduction of the number of involved modules • Selective rendering of changed parts
• Reduction of visualization quality
Considering a visualization pipeline containing more than two modules and an interaction influencing the simulation data source at the other end of the visualization pipeline, the latency can be significantly reduced by immediately updating the visualization before forwarding the user input to the data source. This may lead to invalid representations until the data from the next simulation step is sent. The applicability of this approach is dependent on the type of the visualization pipeline and the timespan of a simulation step.
Selective rendering of updated parts provides an efficient technique for saving computation time and network bandwidth during the visualization process. This well-known approach is also applied in the area of graphical user interfaces in order to reduce the time spent during the redraw operation for a window being activated.
execution of a partial re-rendering operation it is important that the integration of the newly rendered area into the data already available at the visualization device can be done smoothly. An additional issue to be considered is the state of the simulation which is providing the data for the visualization. If the simulation has advanced too far during the user interaction, the whole representation has to be updated and sent through the visualization pipeline.
5. Optimizations within GVK. When transmitting large datasets for visualization purposes over the grid, network bandwidth inherently becomes the limiting factor to performance. Despite the substantial progress made in network bandwidth over the last years, todays Internet is far from being capable of transmitting large amounts of data as delivered by grid computing in reasonable time. For this reason several optimization tech-niques are provided by GVK to minimize interaction latency. Besides conventional data compression techtech-niques [20], promising approaches are
• Occlusion culling • Level-of-detail filtering
• Reference rendering and image warping
Occlusion culling [25] reduces the number of polygons to be transmitted by omitting the hidden parts of the model during the initial transmission steps. While the user is investigating the model, the rest of the polygons are transmitted. Level-of-detail algorithms [10] exploit hierarchical structures of triangle meshes by sending a coarse representation of the model first and finer representations afterwards. Reference rendering [22] uses pre-rendered images of defined viewing positions, which are sent to the visualization device on which to provide visual correct depictions for the given point of view at relatively high framerates. For more details on the applied optimization techniques, please refer to [17].
In order to implement all the mentioned optimizations it is necessary to use a low level programming interface to the data transmission functionality of Globus to provide maximum freedom to the implementation. Hence, the implementation is based on Globus IO.
6. Application Example. One application, which has been implemented to illustrate the feasibility of the GVK approach is a distributed volume rendering application consisting of three components:
• A data source providing volume data
• A data processing module doing isosurface extraction • An interactive triangle mesh rendering component
The input data which enters the visualization pipeline consists of volume data represented by a set of voxels. Different types of input data have been tested, like a digital terrain model and several different three-dimensional geometric primitives.
The data processing module performs isosurface extraction based on the marching cubes or marching tetrahedron algorithm on the volume data and extracts the isosurface requested by the user. The obtained triangle meshes are then stored on the data processing server to speed up future access from possibly multiple clients.
To reduce the load on the network as well as the required computation time a level of detail approach has been embedded into the isosurface extraction algorithm. The resolution of the produced triangle mesh is dependent on the size of the marching cube used within the isosurface extraction. After extraction each level of detail is stored on the dataserver and sent to the registered visualization clients upon request.
The visualization client receives the triangle mesh from the data processing module and presents it to the user by rendering on a desktop workstation or in the CAVE. Available rendering modes include wireframe representation, flat, and smooth shading.
The volume rendering pipeline supports sophisticated interaction possibilities like cut, copy and paste operations with different semantics like adding, substracting, and replacing the data in the paste region.
The selection is performed by a cube-type selector as shown in Figure 3.1. Additional user interface functionality includes Undo and Redo. This operations are acomplished by storing the intermediate visualization results in Undo and Redo buffers within the data processing module and restoring them upon request.
Fig. 7.1.Geometric objects with smooth shading
Fig. 7.2.Wireframe representation of a sliced sphere
Fig. 7.3.Elevation map
cube algorithm. This leads to better triangulation without ambiguities but also results in a higher load on the network when the triangles are sent to the visualization device. These measurements also illustrate the importance of triangle count reduction for visualization speedup.
Fig. 7.4.Dependency between polygon count and level of detail
Fig. 7.5. Dependency between runtime and level of detail
0 0.5 1 1.5 2 2.5 3 3.5 4 4.5
0 500 1000 1500 2000 2500 3000 3500 4000 4500 5000
Seconds
Triangles
Fig. 7.6.Interaction latency
8. Conclusions and Future Work. The Grid Visualization Kernel is a grid middleware component for visualization purposes that supports various types of input data and visualization devices. In contrast to existing distributed visualization solutions, GVK uses the computational power available on the grid for visualization optimizations. GVK is currently available as a first prototype with only limited data processing and visualization features, like VR represention in the CAVE and network transport optimization by using standard data compression algorithms and level of detail reduction of triangle meshes. Available visualization devices include triangle mesh renderers and an image based visualization tool.
Future work will focus on extending the flexibility of GVK as well as dynamic adaptation to varying bandwidths. Another important issue will be a more flexible interaction model which can be applied to different applications.
Acknowledgments. The work on GVK presented in this paper was supported by our colleagues, most notably Hans-Peter Baumgartner, Peter Praxmarer, Herbert Rosmanith, Andreas Wasserbauer, and Gerhard Kurka.
The Grid Visualization Kernel (GVK) is partially supported by the Crossgrid Project of the IST Program of the European Commission under contract number IST-2001-32243.
REFERENCES
[1] M. Aeschlimann, P. Dinda, J. L´opez, B. Lowekamp, L. Kallivokas, D. O’Halleron,Preliminary Report on the Design of a Framework for Distributed Visualization, Proc. PDPTA ’99, Las Vegas, Nevada, USA, pp. 1833–1839, 1999 [2] H. Afsarmanesh, R. Belleman, A. Belloum, A. Benabdelkader, J.F.J. van den Brand, T.M. Breit, H. Bussemaker,
G. Eijkel, A. Frenkel, C. Garita, D.L. Groep, A.W. van Halderen, R.M.A. Heren, Z.W. Hendrikse, L.O. Hertzberger, J. Kaandorp, E.C. Kaletas, V. Klos, P. Sloot, R.D. Vis, A. Visser, H.H. Yakali, VLAM-G: A Grid-Based Virtual Laboratory, Scientific Programming Journal, Vol. 10, No. 2, pp. 173–181, 2002
[3] G. Allen, T. Goodale, E. Seidel, The cactus computational collaboratory: Enabling technologies for relativistic astro-physics,and a toolkit for solving pdes by communities in science and engineering, 7th Symposium on the Frontiers of Massively Parallel Computation-Frontiers 99, IEEE, New York 1999
[4] C. Cruz-Neira, D. J. Sandin, T. A. DeFanti, R. V. Kenyon, J. C. Hart,The CAVE: audio visual experience automatic virtual environment, Communications of the ACM, Vol. 35, No. 6, pp. 64–72, 1992
[5] K. Czajkowski, S. Fitzgerald, I. Foster, C. Kesselman,Grid Information Services for Distributed Resource Sharing, Proc. of the Tenth IEEE International Symposium on High-Performance Distributed Computing (HPDC-10), IEEE Press, August 2001
[6] I. Foster, C. Kesselman,Globus: A Metacomputing Infrastructure Toolkit, Intl. Journal of Supercomputer Applications, Vol. 11, No. 2, pp. 4–18, 1997
[7] I. Foster, C. Kesselman, G. Tsudik, S. Tuecke, A Security Architecture for Computational Grids, Proc. 5th ACM Conference on Computer and Communications Security Conference, pp. 83–92, 1998
[8] I. Foster, J. Insley, G. von Laszewski, C. Kesselman, M. Thiebaux,Distance Visualization: Data Exploration on the
Grid, IEEE Computer Magazine, Vol. 32, No. 12, pp. 36–43, 1999
[10] M. Garland, P. S. Heckbert,Surface Simplification Using Quadric Error Metrics, Computer Graphics, Vol. 31, pp. 209– 216, 1997
[11] G. A. Geist, J. A. Kohl, P. M. Papadopoulos, CUMULVS: Providing Fault-Tolerance, Visualization and Steering of Parallel Applications, Intl. Journal of High Performance Computing Applications, Vol. 11, No. 3, pp. 224–236, August 1997
[12] A. Grimshaw, A. Ferrari, F. Knabe, M. Humphrey, Legion: An Operating System for Wide-Area Computing, IEEE Computer, Vol. 32, No. 5, pp. 29–37, 1999
[13] H. Hoppe,Progressive meshes, Proc. ACM SIGGRAPH ’96, pp. 99–108, 1996
[14] G. Humphreys, M. Eldridge, I. Buck, G. Stoll, M. Everett, P. Hanrahan,WireGL: a scalable graphics system for clusters, Proc. ACM SIGGRAPH ’01, pp. 129–140, 2001
[15] G. Humphreys, M. Houston, R. Ng, R. Frank, S. Ahern, P.D. Kirchner, J.T. Klosowski, Chromium: A Stream-Processing Framework for Interactive Rendering on Clusters, Proc. ACM SIGGRAPH ’02, pp. 693–207, San Antonio, Texas, USA, August 2002
[16] D. Kranzlm¨uller, B. Reitinger, I. Hackl, J. Volkert,Voice Controlled Virtual Reality and Its Perspectives for Everyday
Life, Proc. APC 2001, Arbeitsplatzcomputer 2001, Fachtagung der GI/ITG Fachgruppe APS+PC zum Thema “Pervasive
Ubiquitous Computing”, VDE-Verlag, Technical University Munich, Munich, Germany, pp. 101–107, 2001
[17] D. Kranzlm¨uller, G. Kurka, P. Heinzlreiter, J. Volkert, Optimizations in the Grid Visualization Kernel, Proc. of PDIVM 2002, Workshop on Parallel and Distributed Computing in Image Processing, Video Processing and Multimedia, IPDPS 2002 Symposion, Ft. Lauderdale, Florida, April 2002
[18] J. Lee, D. Gunther, B. Thierney, B. Allcock, J. Bester, J. Bresnahan, S. Tuecke,Applied Techniques for High Bandwidth Data Transfers Across Wide Area Networks, Proc. of International Conference on Computing in High Energy and Nuclear Physics, Bejing, China, September 2001
[19] J. Leigh, A. E. Johnson, T. A. DeFanti,CAVERN: A Distributed Architecture for Supporting Scalable Persistence and In-teroperability in Collaborative Virtual Environments, Journal of Virtual Reality Research, Development and Applications, Vol. 2.2, pp. 217–237, the Virtual Reality Society 1997
[20] D. A. Lelewer, D. S. Hirschberg,Data Compression, ACM Computing Surveys (CSUR), Vol. 19, No. 3, pp. 261–296, 1987 [21] W. E. Lorensen, H. E. Cline, Marching Cubes: A High Resolution 3D Surface Construction Algorithm, Proc. ACM
SIGGRAPH ’87, pp. 163–169, 1987
[22] L. McMillan, G. Bishop,Plenoptic modeling: an image-based rendering system, Proc. ACM SIGGRAPH ’95, pp. 39–46, 1995
[23] M. Romberg, The Unicore Architecture: Seamless Access to Distributed Resources, Proc. 8th IEEE Symposion on High Performance Distributed Computing, HPDC 1999, pp. 287–293, Los Alamitos, California, August 1999
[24] M. Woo, J. Neider, T. Davis, D. Shreiner,OpenGL Programming Guide, Third Edition, Addison Wesley, 1999
[25] H. Zhang, D. Manocha, T. Hudson, K. Hoff, Visibility Culling using Hierarchical Occlusion Maps, Proc. ACM SIG-GRAPH’97, pp. 77–88, 1997
Edited by: Zsolt Nemeth, Dieter Kranzlmuller, Peter Kacsuk
Received: April 7, 2003