Ames Laboratory Accepted Manuscripts
Ames Laboratory
2-2018
Ce3-xMgxCo9: Transformation of a Pauli
Paramagnet into a Strong Permanent Magnet
Tej Lamichhane
Iowa State University and Ames Laboratory, [email protected]
Valentin Taufour
Ames LaboratoryAndriy Palasyuk
Ames Laboratory, [email protected]
Qisheng Lin
Ames Laboratory, [email protected]
Sergey Bud’ko
Iowa State University and Ames Laboratory, [email protected]
See next page for additional authors
Follow this and additional works at:
https://lib.dr.iastate.edu/ameslab_manuscripts
Part of the
Condensed Matter Physics Commons
, and the
Materials Science and Engineering
Commons
This Article is brought to you for free and open access by the Ames Laboratory at Iowa State University Digital Repository. It has been accepted for inclusion in Ames Laboratory Accepted Manuscripts by an authorized administrator of Iowa State University Digital Repository. For more information, please [email protected].
Recommended Citation
Permanent Magnet
Abstract
We report on the synthesis of single-crystal and polycrystalline samples of Ce 3 − x Mg x Co 9 solid solution ( 0 ≤ x ≲ 1.4 ) and characterization of their structural and magnetic properties. The crystal structure remains rhombohedral in the whole composition range and Mg partially replaces Ce in the 6 c site of the CeCo 3 structure. Ferromagnetism is induced by Mg substitutions starting as low as x = 0.18 and reaching a Curie temperature as high as 450 K for x = 1.35 . Measurements on single crystals with x = 1.34 and T C = 440 K indicate an axial magnetic anisotropy with an anisotropy field of 6 T and a magnetization of 6 μ B / f . u . at 300 K. Coercicity is observed in the polycrystalline samples consistent with the observed axial magnetic anisotropy. Our discovery of ferromagnetism with large axial magnetic anisotropy induced by substituting a rare-earth element by Mg is a very promising result in the search of inexpensive permanent-magnet materials and suggests that other nonmagnetic phases, similar to CeCo 3 , may also conceal nearby ferromagnetic phases.
Disciplines
Condensed Matter Physics | Materials Science and Engineering
Authors
Ce
3xMg
xCo
9: Transformation of a Pauli Paramagnet into a Strong Permanent Magnet
Tej N. Lamichhane,1,2,*Valentin Taufour,1,3 Andriy Palasyuk,1 Qisheng Lin,1 Sergey L. Bud’ko,1,2and Paul C. Canfield1,2
1Ames Laboratory, U.S. DOE, Ames, Iowa 50011, USA 2
Department of Physics and Astronomy, Iowa State University, Ames, Iowa 50011, USA
3Department of Physics, University of California Davis, Davis, California 95616, USA
(Received 31 October 2017; revised manuscript received 16 January 2018; published 23 February 2018)
We report on the synthesis of single-crystal and polycrystalline samples of Ce3−xMgxCo9solid solution (0≤x≲1.4) and characterization of their structural and magnetic properties. The crystal structure remains rhombohedral in the whole composition range and Mg partially replaces Ce in the6csite of the CeCo3 structure. Ferromagnetism is induced by Mg substitutions starting as low as x¼0.18 and reaching a Curie temperature as high as 450 K for x¼1.35. Measurements on single crystals withx¼1.34and
TC¼440K indicate an axial magnetic anisotropy with an anisotropy field of 6 T and a magnetization of 6μB/f:u:at 300 K. Coercicity is observed in the polycrystalline samples consistent with the observed axial
magnetic anisotropy. Our discovery of ferromagnetism with large axial magnetic anisotropy induced by substituting a rare-earth element by Mg is a very promising result in the search of inexpensive permanent-magnet materials and suggests that other nonpermanent-magnetic phases, similar to CeCo3, may also conceal nearby ferromagnetic phases.
DOI:10.1103/PhysRevApplied.9.024023
I. INTRODUCTION
Current rare-earth-based commercial magnets contain local-moment-bearing rare-earth elements, mainly Nd, Sm, and Dy, whose availability is, according to the U.S. Department of Energy, important to the clean-energy economy, and these magnets have an associated supply risk. Alternative to finding a long-sought rare-earth free, high-flux permanent magnet, attempts to find Ce-based permanent magnets or substituting Ce for more critical rare-earth elements could be a pragmatic strategy to address the criticality problem since Ce is a relatively more abundant rare-earth element[1] with an easier extraction chemistry. Ce is relatively easy to separate from the other rare-earth elements since it can easily be oxidized to CeO2 via roasting from which it can be precipitated out in acidic solutions[2,3]. Ce can be, in theory as well as experiment, a substitute for critical rare-earth elements without much compromise in magnetic properties [4]. Because of the volatile price of critical rare-earth elements, Ce has drawn attention for developing gap magnets which will populate the gap in energy product (in the range of 10–20 MGOe) between low-flux (alnico, ferrites) and commercial rare-earth-based magnets such as SmCo5 and Nd2Fe14B. Additionally, the study of new Ce-based compounds often can reveal interesting physics; Ce exhibits diverse elec-tronic and magnetic properties like local-moment-bearing
Ce3þ ions, nonmagnetic Ce4þ ions, mixed valency, inter-mediate valence state, and itinerant magnetism.
Ce3−xMgxCo9alloys are substitute derivatives of CeCo3 in which Mg partially replaces Ce in the6c position. The hydrogenation properties of the compound Ce2MgCo9 (x¼1) and Nd3−xMgxCo9 alloys (x≤1.5) have recently been investigated[5,6]. In addition, it was shown that the substitution of Mg for Nd increases the Curie temperature from 381 K for NdCo3 [7]to 633 K for Nd2MgCo9 [6].
In this work, we present the structural and magnetic properties of both single-crystal and polycrystalline Ce3−xMgxCo9 for 0≤x≲1.4. The anisotropic magnetic properties are studied for a single crystal of Ce1.662ð4Þ Mg1.338ð4ÞCo9. (Hereafter, we round off the single-crystal composition to three significant digits as Ce1.66Mg1.34Co9.)
We find a remarkable transformation of Pauli paramagnet CeCo3 (Ce3Co9) into the potential permanent magnet Ce3−xMgxCo9, which develops 2.2MJ/m3 of uniaxial
anisotropy energy at 2 K for Ce1.66Mg1.34Co9.
II. EXPERIMENTAL METHODS
To establish the existence range of the solid solution Ce3−xMgxCo9, we prepare polycrystals with various nomi-nal compositions of0≤x≤2.00(see TableIII). Ce metal from the Ames Laboratory Material Preparation Center (purity>99.99%), Co chunks (99.95%, Alfa Aesar), and Mg (99.95%, Gallium Source) are packed in a three-capped Ta crucible[8]under an Ar atmosphere. The Ta crucible is then sealed into an amorphous silica ampoule. The ampoule
PHYSICAL REVIEW APPLIED
9,
024023 (2018)
is heated to900°C over 3 h and held there for 3 h. This step allows the reaction of Ce and Mg at low temperature and avoids the excessive boiling of Mg inside the Ta crucible. The ampoule is then heated to1200°C over 3 h and held there for 10 h. At this point, the ampoule is spun in a centrifuge, and all of the molten growth material is decanted and quenched in the catch side of the Ta tube. This step confirms that the mixture is forming a homo-geneous melt at 1200°C. The ampoule is put back into a furnace, then annealed at900°C for 24 h. Mg-free CeCo3is also synthesized by arc melting the stoichiometric compo-sition and annealing at 900°C for 1 week.
Single crystals of Ce3−xMgxCo9 are grown using a solution growth technique. An initial composition of Ce9Mg24Co67 (see Fig. 1) is packed in a three-capped Ta crucible [8] and heated to 1200°C similar to the polycrystals. The ampoule is then cooled down to
1100°C over 75 h after which crystals are separated from the flux by using a centrifuge. Similarly, CeCo3 single crystals are prepared by cooling a Ce30Co70 melt from
1200°C to1100°C in 1 h and then to1050°C over 75 h[9]. Elemental analysis of the samples is performed using energy-dispersive spectroscopy (EDS). Polycrystalline samples are embedded in epoxy resin and finely polished. The polished samples are examined with EDS on six to ten spots and a statistical average composition is reported. Thin, platelike single-crystal samples [see Fig. 2(a)] are mounted on a conducting carbon tape. Self-flux-grown MgCo2 and CeCo2 single crystals are used as absorption standards for the Ce-Co-Mg alloy composition analyses. Powder x-ray-diffraction data are collected at room temper-ature on a Rigaku MiniFlex II diffractometer with Cu-Kα
radiation. Data are collected with a 3-s dwell time for each interval of 0.01° within a 2θ range of 10°–100°. Lattice parameters are refined by the Rietveld analysis method using the General Structure Analysis System [10] and
EXPGUI[11].
Single-crystal x-ray diffraction is carried out on a Bruker Smart APEX II diffractometer with graphite-monochromatized Mo-Kα radiation (0.710 73 Å). Reflections are gathered at room temperature by taking four sets of 360 frames with 0.5° scans in ω, with an exposure time of 10 s. The crystal-to-detector distance is
0 25
75 100
0
25
CeCo2 Ce3−xMgxCo9line
CeCo2
MgCo2
CeCo3
Ce9Mg24Co67
Ce1.66Mg1.34Co9
Ce9Mg24Co67
Co
CeCo3
[image:4.612.64.278.46.205.2]MgCo2
FIG. 1. Co-rich portion of the Co-Mg-Ce ternary phase diagram showing the Ce3−xMgxCo9 solid solution line and (1∶2)-type
impurity phases. Ce9Mg24Co67 is the optimized initial melt composition for the solution growth of single-crystal Ce1.66Mg1.34Co9. (See the text for details.)
20 40 60 80 100
0 350 700 1050 1400
I
(counts)
2 (deg)
I(Obs) I(Cal) I(Cal) I(Obs-Cal) Bragg peaks
Ce1.66Mg1.34Co9
Rp= 0.09 0
2000 4000 6000 8000
[0021] [0018] [0015] [0012]
[009]
[006]
I
(counts)
Ce1.66Mg1.34Co9
Single-crystal facet XRD
[003] (a)
(b)
(c)
(d)
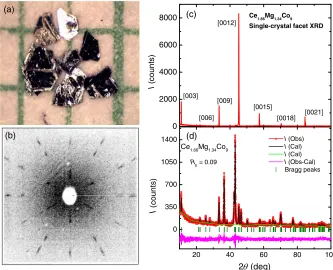
FIG. 2. (a) Single crystals of Ce1.66
Mg1.34Co9. (b) Backscattered Laue photograph of Ce1.66Mg1.34Co9 with
an x-ray beam perpendicular to the plate. (c) Monochromatic x-ray diffraction from the surface of a single crystal using Bragg-Brentano geometry. (d) Powder XRD for Ce1.66Mg1.34Co9 where I
[image:4.612.53.386.444.714.2]maintained at 60 mm. The reflections are collected over a range of 3° to 62° in 2θ.
Electrical resistivity is measured on single crystals using the four-probe technique with a Linear Research ac resistance bridge (LR700, f¼17Hz). The Quantum Design (QD) Magnetic Property Measurement System (MPMS) is used for temperature control. Samples are sliced into thin rectangular bars (approximately 0.9×0.45×0.04mm), and platinum wires are attached to the samples with Dupont 4929N silver paint. The contact resistances are less than2Ω.
Magnetization is measured using a QD-VersaLab vibrating-sample magnetometer (VSM). The standard option is used in the temperature range 50–400 K, and the oven option in the range 300–1000 K. Loctite 435 and Zircar cement are used to attach the samples in the standard and oven options, respectively. Field-dependent magneti-zation isotherms are also measured down to 2 K in a MPMS. The details of sample mounting and the exper-imental determination of the demagnetization factor along the easy axis are discussed in Refs.[12,13].
III. COMPOSITION AND STRUCTURAL PROPERTIES
A. Single crystal: Characterization and structure
A picture of as-grown Ce1.66Mg1.34Co9single crystals, a
Laue backscattered photograph, and single-crystal surface
diffracted monochromatic XRD data collected via a Rigaku MiniFlex II diffractrometer with Bragg-Brentano geometry[14] are presented in Figs. 2(a),2(b), and 2(c), respectively. Both Laue and monochromatic single-crystal XRD data confirm that the single single-crystals grow with a planar morphology with thecaxis perpendicular to the plates.
The crystallographic data obtained from the single crystal x-ray diffraction for Ce1.66Mg1.34Co9 grown out of a Ce9Mg24Co67 initial melt are summarized in Tables I
andII. Figure2(d)shows a powder x-ray-diffraction pattern of the crushed single crystals which has some noticeable mismatch in an observed and Rietveld refined intensity of f00lg families of the peaks, indicating a degree of preferred orientation in the powder sample. As mentioned above, the relatively small crystal size makes it difficult to acquire enough powder sample to obtain less noisy XRD data and better statistics in the Rietveld refinement. To reduce the intensity mismatch, a preferred orientation correction is employed in the Rietveld refinement using spherical harmonics up to 12th order and absorption correction for platelike grains in the powder sample. The Rietveld refined lattice parameters for powder XRD data of the single crystal Ce1.66Mg1.34Co9area¼4.923ð1Þ Å and
c¼24.026ð1ÞÅ, withRp¼0.09, which is in close agree-ment (within2σto3σ) with the single-crystal XRD data as shown in TableI. The single crystal XRD composition is Ce13.92Mg11.08Co75(Ce1.662ð4ÞMg1.338ð4ÞCo9). Although we
do not make a quantitative compositional analysis meas-urement on the single-crystal sample with EDS (the crystals are too thin to readily polish, and small droplets of Mg-rich flux is on their surfaces), we can detect the minor presence of Ta (up to 1 at. %), most likely caused by a slight dissolution of the inner wall surfaces of a Ta reaction container and diffusion of Ta atoms into the reaction liquid during a long-term dwelling process at a maximum temper-ature of1200°C, as well as at ramping down to1100°C over 75 h. However, an attempt to solve the crystal structure along with inclusion of Ta in any Wyckoff sites or interstitial sites is unsuccessful. We believe that Ta is distributed in our crystals in the form of nanosized precipitates rather than incorporated into interstices of the crystal structure.
[image:5.612.86.523.634.715.2]The crystal structure of Ce3−xMgxCo9 is rhombohedral and belongs to the PuNi3-type structure[5]. Similar to the TABLE I. Crystallographic data and refinement parameters for
Ce1.662ð4ÞMg1.338ð4ÞCo9.
Empirical formula Ce1.662ð4ÞMg1.338ð4ÞCo9
Formula weight 796.32
Crystal system, space group Trigonal,R-3mh Unit-cell dimensions a¼4.9260ð7Þ Å
c¼24.019ð5ÞÅ
Volume 504.75ð18ÞÅ3
Z, calculated density 3,7.859 g/cm3
Absorption coefficient 32.577mm−1 Reflections collected 2000 (RðintÞ¼0.0408) Data, restraints, parameters 224, 0, 18 Goodness of fit onjFj2 1.149
FinalRindices [I >4σðIÞ] R1¼0.0204,wR2¼0.0450
Rindices (all data) R1¼0.0226,wR2¼0.0455 Largest difference peak and hole 1.917 and−1.477eÅ−3
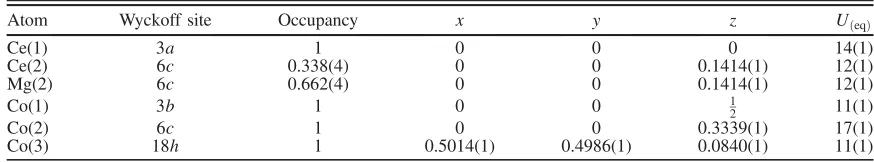
TABLE II. Atomic coordinates and equivalent isotropic displacement parameters (Å2×10⁻³) for Ce1.66Mg1.34Co9.UðeqÞ is defined as one third of the trace of the orthogonalizedUij tensor.
Atom Wyckoff site Occupancy x y z UðeqÞ
Ce(1) 3a 1 0 0 0 14(1)
Ce(2) 6c 0.338(4) 0 0 0.1414(1) 12(1)
Mg(2) 6c 0.662(4) 0 0 0.1414(1) 12(1)
Co(1) 3b 1 0 0 12 11(1)
Co(2) 6c 1 0 0 0.3339(1) 17(1)
Co(3) 18h 1 0.5014(1) 0.4986(1) 0.0840(1) 11(1)
Ce3−xMgxCo9: TRANSFORMATION OF A … PHYS. REV. APPLIED9, 024023 (2018)
R3−xMgxNi9series, the Co-containing structure is an inter-growth of CaCu5-type (A) and MgCu2-type (B) building blocks with a repeating sequence of ABA0B0A00B00A, as shown in Fig.3. Here,A0,B0andA00,B00are introduced to show the relative translation of the growth layers with respect to thecaxis during stacking. There are two independent sites for Ce atoms in this structure: one3asite is located at the center of a face-shared antihexagonal prism defined by 18 Co atoms, and the other6csite is surrounded by 12 Co atoms defining a truncated tetrahedron plus four capping atoms at longer distances. As expected from the polyhedra volume, the statistically distributed Ce/Mg mixtures prefer to occupy the Wyckoff6csite, with its smaller volume.
B. Polycrystalline samples: Composition and lattice parameters
The nominal and EDS compositions of the polycrystal-line samples are presented in Table III along with the
[image:6.612.56.295.45.234.2]Rietveld refined percentage of the majority phase in the sample. The SEM images for mixed and predominantly single-phase Ce3−xMgxCo9samples are presented in Fig.4. FIG. 3. The crystal structure for Ce3−xMgxCo9 showing the
stacking sequence of a CaCu5-type plane (A) and a MgCu2-type plane (B) visualized along the [010] direction.
TABLE III. The comparison of the loaded compositions with the EDS-determined composition. A nominal presence of Ta (up to 1 at. %) is found in the homogeneous Ce3−xMgxCo9samples. Some of the higher-Mg samples show traces of a TaCo3impurity phase, and
low-Mg content samples show a TaCo2 phase.
Loaded composition (nominal) EDS composition Rietveld refinement % of majority phase: Ce3−xMgxCo9
CeCo3(arc melted and annealed at900°C for 7 d)
CeCo3þCeCo2 ≥88%
Ce2.75Mg0.25Co9 Ce2.82Mg0.18Co9þCe0.86Mg0.14Co2þTaCo2 ≥67% Ce2.50Mg0.5Co9 Ce2.66Mg0.34Co9þCe0.77Mg0.23Co2 ≥76%
Ce2.25Mg0.75Co9 Ce2.40Mg0.60Co9þCe0.80Mg0.20Co2 ≥80%
Ce2Mg1.0Co9 Ce2.18Mg0.82Co9 Approximately single phase
Ce1.67Mg1.33Co9 Ce1.89Mg1.11Co9 Approximately single phase Ce1.5Mg1.5Co9 Ce1.77Mg1.23Co9 Approximately single phase
Ce1.33Mg1.67Co9 Ce1.65Mg1.35Co9 Approximately single phase
[image:6.612.334.537.45.352.2]CeMg2Co9 Ce1.42Mg1.58Co9þMgCo2þCo ≥50%
FIG. 4. SEM images of mixed-phase and predominantly single-phase Ce3−xMgxCo9 samples. (a) Nominal Ce2.25Mg0.75Co9,
which gives a mixture of Ce2.40Mg0.60Co9 (majority phase) and Ce0.80Mg0.20Co2(minority phase demonstrated as faint small
[image:6.612.51.559.566.716.2]Figure4(a)shows the mixed-phase sample that forms out of a nominal composition Ce2.25Mg0.75Co9, and Fig. 4(b)
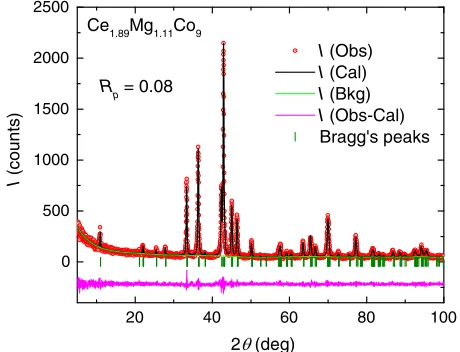
shows the predominantly single-phase sample with EDS composition Ce1.89Mg1.11Co9. In addition, TableIII
sum-marizes a phase analysis based on powder XRD data. The crystallographic information file obtained from single-crystal XRD is used to perform Rietveld refinement of the powder XRD data of polycrystal samples listed in TableIII. Rietveld refined XRD patterns for multiple-phase polycrystalline samples (nominal Ce2.75Mg0.25Co9 with
Rp¼0.09, and Ce2.50Mg0.50Co9 with Rp¼0.10), and
single-phase polycrystalline Ce1.89Mg1.11Co9 (EDS com-position) withRp¼0.08are presented in Figs.5,6, and7,
respectively. The melt-annealed nominal Ce2.75Mg0.25Co9
sample contains approximately 67% Ce2.82Mg0.18Co9
phase, about 23% of Ce0.86Mg0.14Co2, and roughly 10%
of TaCo2 inferred from Rietveld refinement. The TaCo2 phase is not observed in the nominal Ce2.50Mg0.5Co9 and
higher content of Mg, as shown in Figs. 6 and 7. An unidentified XRD peak is observed in the nominal Ce2.50Mg0.50Co9 sample shown in Fig. 6; however, the
TaCo2 phase is almost reduced to zero in comparison to the nominal composition Ce2.75Mg0.25Co9 shown in
Fig. 5. However, traces of the TaCo3 phase are observed in predominantly single-phase Ce3−xMgxCo9 samples. These results, combined with the fact that even pure (Mg¼0) CeCo3 remains mixed phase after 7 d of annealing, suggest that Mg assists the annealing of poly-crystalline Ce3−xMgxCo9 samples.
For nominal values of x¼2and higher, Ce3−xMgxCo9 can no longer be considered a clear majority phase with the presence of a significant amount of CoMg2 and Co. Looking at the composition of the Ce3−xMgxCo9 alloys from EDS, it seems that x≈1.4 is the maximum solid solubility. In the Nd3−xMgxCo9 alloys, the structure changes from the trigonal structure for x≤1.5 to a tetragonal structure at x¼2 (YIn2Ni9 type) [6]. The solubility range of Mg in CeCo3 is therefore similar,
20 40 60 80
20 40 60 80
0 1000 2000
I
(counts)
2 (deg)
I(Obs)
I(Cal)
I(Bkg)
I(Obs-Cal) CeCo2peaks CeCo3peaks TaCo2peaks Nominal
Ce2.75Mg0.25Co9
Rp= 0.09 CeCo2 [311]
CeCo3 [116]
FIG. 5. A typical example of a multiphase polycrystalline XRD pattern for a nominal Ce2.75Mg0.25Co9 sample. The enlarged
peak at the left top of the graph shows the broadening of the highest-intensity peak of Ce3−xMgxCo9around a2θvalue of 42° due to the presence of a Mg-doped CeCo2 diffraction peak.
I (Obs), I (Cal), and I (Bkg) are the experimental, Rietveld refined, and instrumental background data, respectively. The lower section of the graph shows the Bragg’s-peak positions with different-colored vertical lines for phases shown in the graph and the differential x-ray diffractrogram I (Obs-Cal).
20 40 60 80 100
0 520 1040 1560
I
(counts)
2 (deg)
I(Obs)
I(Cal)
I(Bkg)
I(Obs-Cal) CeCo2peaks CeCo3peaks TaCo2peaks Nominal
Ce2.50Mg0.50Co9
Unidentified peak
[image:7.612.326.549.43.220.2]Rp= 0.10
FIG. 6. Powder XRD pattern for a nominal Ce2.50Mg0.50Co9 sample. The TaCo2 phase is almost not detectable for XRD; however, an unidentified XRD peak is observed at around the2θ value of 25°.I(Obs),I (Cal), andI (Bkg) are the experimental, Rietveld refined, and instrumental background data, respectively. The lower section of the graph shows the Bragg’s-peak positions with different-colored vertical lines for phases shown in the graph and the differential x-ray diffractrogramI (Obs-Cal).
20 40 60 80 100
0 500 1000 1500 2000 2500
I
(counts)
2 (deg)
I(Obs)
I(Cal)
I(Bkg)
I(Obs-Cal) Bragg's peaks Ce1.89Mg1.11Co9
[image:7.612.63.287.408.594.2]Rp= 0.08
FIG. 7. A typical example of a predominantly single-phase polycrystalline XRD pattern for an EDS-characterized Ce1.89Mg1.11Co9 sample. I (Obs),I (Cal), and I (Bkg) are the
experimental, Rietveld refined, and instrumental background data, respectively. The lower section of the graph shows the Bragg’s-peak positions with olive vertical lines and the differ-ential x-ray diffractrogramI (Obs-Cal).
Ce3−xMgxCo9: TRANSFORMATION OF A … PHYS. REV. APPLIED9, 024023 (2018)
[image:7.612.322.552.453.629.2]but we do not observe a phase corresponding with the YIn2Ni9-type structure for x≥2. Instead, a three-phase region of MgCo2, Ce3−xMgxCo9, and Co is observed (see Table III). The compositional range of our Ce3−xMgxCo9 samples is summarized in Fig. 1.
The variation of the polycrystalline lattice parameters and unit-cell volume as a function of the Mg content in the Ce3−xMgxCo9phase, as determined using EDS, is shown in Fig.8. As expected, the substitution of Mg for Ce results in a reduction of the unit-cell volume, similar to the case with Nd3−xMgxCo9 alloys [6]. Neither the a nor the c lattice parameter follows a linear relation with Mg contentx. The variation in thealattice parameter shows a slight positive deviation, and the c lattice parameter shows a slight negative deviation starting in the middle of the single-phase region. The negative deviation of lattice parameterc
might indicate that the covalent bonding is increased along that direction. It should be noted that the lattice parameters (a,c,v) and composition inferred from the single-crystal x-rays (shown as the corresponding color ⋆s) agree very well with what we infer from EDS measurements on the polycrystalline samples.
IV. MAGNETIC PROPERTIES
Previously reported data do not agree on the magnetic properties of the parent compound, CeCo3. Lemaire reported on CeCo3 as a ferromagnetic material with Curie temperature 78 K [15]. Buschow identified it as a Pauli-paramagnetic phase; however, he left room for further investigation by mentioning that CeCo3 could be
ferromagnetic below 10 K[16]. To clarify this issue, we measure the temperature-dependent magnetization and electric resistivity of our single-crystal samples down to 2 K, as shown in Fig.9. The magnetization data show no signature of a phase transition, and they are only weakly temperature dependent and are consistent with a Pauli paramagnet and an impurity tail below 20 K. Assuming the Curie tail is because of the Ce3þ magnetic ions in the single-crystal CeCo3 sample, magnetic susceptibility is fitted to the Curie-Weiss law up to 150 K as
χðTÞ ¼χ0þ C
T−θ;
whereχ0is the high-temperature asymptotic susceptibility,
Cis the Curie constant, andθis the Curie-Weiss temper-ature. The concentration of Ce3þ ions is estimated to be approximately 20% (withθ¼3.8K) using the spin-only moment of2.54μB per Ce3þ ion. The electrical resistivity does not show any signature of a loss of spin-disorder scattering, which would be anticipated for a magnetic phase transition.
The temperature dependences of the magnetization data of the single-phase Ce3−xMgxCo9polycrystalline samples are shown in Fig.10. A rapid increase of the magnetization upon cooling below the Curie temperature is observed for
x¼0.82–1.35, indicating the appearance of ferromagnet-ism upon Mg substitution.
The Curie temperatureTCis estimated as the cross-point
of linear extrapolations of two tangents to the magnetiza-tion curve around the point of inflecmagnetiza-tion, as indicated on the curvesx¼1.11andx¼1.23in Fig.10. The variation of
TCwith Mg substitution is shown in the inset. The Curie
temperature increases with Mg concentration and reaches as high as 450 K forx¼1.35.
[image:8.612.318.562.42.213.2]The substitution of Mg for Ce changes a Pauli para-magnet (CeCo3) into a ferromagnet that has TC increase
FIG. 8. Variation of the lattice parameters (a,c) and the unit-cell volume (v) of polycrystalline Ce3−xMgxCo9 with Mg content inferred from EDS. Cubic Ce1−xMgxCo2-type impurity phases
are obtained for x≤0.6, and predominantly single-phase Ce3−xMgxCo9 is obtained for0.6< x≤1.4. The lattice
[image:8.612.53.297.46.216.2]param-eters for single-crystal Ce1.66Mg1.34Co9 are presented with corresponding color stars. The uncertainty in the refined lattice parameters is less than 0.01% of the reported lattice parameters and is too small to clearly show as an error bar in the diagram.
FIG. 9. Temperature-dependent susceptibility (H¼0.1T⊥
with Mg content. The most likely reason for this increment is associated with valency and band filling. In CeCo3, the Ce is essentially nonmoment bearing, which implies a Ce4þ valency. As Mg2þis added, there is a clear change in band filling that most likely leads to Stoner-type magnetism associated with the Co 3d bands. Further work, both computational and experimental, will be needed to better appreciate the origin of the observed ferromagnetism.
Figure 11 shows the magnetic hysteresis curves of various polycrystals along with the observed coercivity fields at 50 K (see the inset). The coercivity field increases with Mg content, becomes maximal (about 0.35 T) for
x¼0.82, then decreases. The observation of coercivity is consistent with the axial nature of the magnetic anisotropy, as detailed below. The abruptly increased coercivity for
x¼0.82and the spontaneous magnetization forx¼1.11 magnesium-containing phases are reproduced in multiple samples. It should be noted that differing saturation values for differingxvalues are most likely due to the nonrandom distribution of grains in these as-cast samples. In addition, the nonsaturating behavior of thex¼1.35sample indicates either the presence of the preferred orientations of the grains with their hard axis along the applied field or the presence of some anisotropic magnetic impurity in the sample. The former argument can be easily visualized in the MðTÞ data, as the x¼1.35polycrystalline sample and the single-crystal Ce1.66Mg1.34Co9MðTÞdata along the hard axis are almost identical in nature, as shown in Fig.10. The fact that the as-cast samples show coercivity is
promising for the development of permanent magnets out of this system.
Our single-crystal sample can provide further insight into this system’s promise as a permanent-magnet material. Figure 12 shows the temperature dependence of the magnetization parallel and perpendicular to thec axis of the single crystal of Ce1.66Mg1.34Co9 up to 550 K. Thec
axis is the easy axis of magnetization, and the saturation magnetization at low temperature is8μB/f:u:. The sponta-neous-magnetization data points for Ce1.66Mg1.34Co9,
0 200 400 600
0.0 0.5 1.0 1.5 2.0 2.5 3.0
0.4 0.8 1.2 0 0 150 300 450 0.82 M ( μΒ /f.u.) T(K) H= 0.1 T
x= 1.23
x= 1.11
x= 1.35
0
single crystal x= 1.34 H= 0.1 T⊥c
TC
(K)
x
[image:9.612.67.283.43.218.2]Ce3−xMgxCo9
FIG. 10. Temperature-dependent magnetization of single-crys-tal (x¼0 and 1.34), polycrystalline Ce3−xMgxCo9 measured under a magnetic field of 0.1 T. The arrow-pointed Mg content (x) for eachMðTÞ graph is inferred from EDS analysis. The olive-colored straight lines above and below the point of inflection ofMðTÞ data forx¼1.11and x¼1.23shows the scheme for inferring the Curie temperature. (Inset) The obtained Curie temperatures and the Mg-content phase diagram. ⋆ indicates the Curie temperature inferred from the tangent intersection scheme for a single-crystal Ce1.66Mg1.34Co9 sample on the
MðTÞdata measured along the hard axis of the plate.
−3 −2 −1 0 1 2 3
−5 −4 −3 −2 −1 0 1 2 3 4 5
0.6 0.9 1.2 0.1 0.2 0.3 0 M ( μB /f.u.)
0H(T)
T= 50 K
0.82 1.11 1.23 1.35 0.60 HC (T )
[image:9.612.332.543.46.220.2]Mg (x)
FIG. 11. Magnetic hysteresis loop of various annealed poly-crystalline Ce3−xMgxCo9samples at 50 K. The values of the Mg content are from an EDS analysis. (Inset) Variation of the observed coercivity fields of the samples as a function of the Mg content.
0 100 200 300 400 500
0 2 4 6 8
Ce1.66Mg1.34Co9
M
s
1TH || c
0.1 TH||c
1 TH||ab
0.1 TH||ab
M
(
μΒ
/f.u.)
T(K)
300 600 900 0 1 2 3 T(K) Μ ( μΒ
/f.u.) FCZFC
H= 0.1 TH||c
FIG. 12. Anisotropic temperature-dependent magnetization for Ce1.66Mg1.34Co9 at various applied fields and directions.
The dashed lines representH¼0.1T, and the solid lines show
H¼1.0T. Individual data points (the red squares) indicate spontaneous magnetization. MS is inferred from MðHÞ
iso-therms. (Inset) Zero-field-cooled (ZFC) and field-cooled (FC) magnetization data along the easy axis of magnetization to temperature above the sample decomposition point.
Ce3−xMgxCo9: TRANSFORMATION OF A … PHYS. REV. APPLIED9, 024023 (2018)
[image:9.612.333.541.445.619.2]represented as red squares, are obtained by theYintercept of the linear fitting of the high field MðHÞMðHÞ data (>1.5T) in the first quadrant. No hysteresis is observed in the MðHÞ loops. The absence of hysteresis in the MðHÞ
isotherms measured in the single crystals is due to an absence of grain boundaries, defects, and impurity atoms capable of pinning the ferromagnetic domains. When measurements are performed up to 1000 K, we notice a nonreproducibility of the results, as shown in the inset of Fig. 12. Thermogravimetric analysis (not shown here) shows evidence for a decomposition of the samples. This degradation is not observed when limiting the mea-surements to a maximum temperature of 550 K.
An Arrott plot with several isotherms near the Curie temperature is shown in Fig.13. The internal magnetic field
Hintis determined using the relationHint¼Happ−NM,
whereHapp is the applied field,N is the demagnetization
factor which is experimentally determined along the easy axis (Nc¼0.78)[12,13], andMis the magnetization. The Arrott curves are not linear, indicating that Ce1.66Mg1.34Co9
does not follow the mean-field theory. The Curie temper-ature of Ce1.66Mg1.34Co9 is 440 K since the Arrott curve corresponding to 440 K passes through the origin. This temperature is comparable to the values of TC obtained from polycrystals of similar composition (see the inset of Fig.10).
The magnetocrystalline anisotropy field is determined to be about 10 T (T¼2K) and approximately 6 T (T¼300K) for a Ce1.66Mg1.34Co9single-crystal sample,
as shown in Fig.14. The anisotropy field is determined by a linear extrapolation of the observed moment along the plane up to the saturation moment.
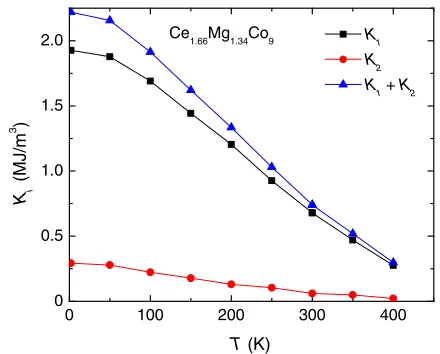
The anisotropy energy is quantified by using a Sucksmith-Thompson plot for field-dependent magnetiza-tion data along the plane, as shown in Fig. 15. In the Sucksmith-Thompson plot, the ratio of the magnetizing field with hard-axis magnetization data is related to the anisotropy constants K1 and K2, the saturation
magneti-zationMs, and the hard-axis magnetization (M⊥) as shown
in the following equation[17,18]:
μ0H
M⊥ ¼
2K1
M2s
þ4K2
M4s
M2⊥: ð1Þ
The intercept of the Sucksmith-Thompson plot gives the anisotropy constantK1, and the slope gives the anisotropy
0 2 4 6 8 10
0 2 4 6 8 Ce
1.66Mg1.34Co9
H||cat 50 K H⊥cat 50 K H||cat 300 K H⊥cat 300 K T= 300 K
Ha= 6 T
M
(
μB
/f.u.)
0Hint(T) T= 50 K Ha= 10.3 T
0 2 4 6 8 10
0 2 4 6 8 Ce
1.66Mg1.34Co9
H||cat 50 K H⊥cat 50 K H||cat 300 K H⊥cat 300 K T= 300 K
Ha= 6 T
M
(
μB
/f.u.)
0Hint(T) T= 50 K Ha= 10.3 T
FIG. 14. Anisotropic field-dependent magnetization of Ce1.66Mg1.34Co9at 50 K (Ha≈10T) and 300 K (Ha≈6T).
0 2 4 6 8 10 12
0 1 ×10¹⁰ 2 ×10¹⁰ 3 ×10¹⁰ 4 ×10¹⁰ 5 ×10¹⁰
M
2 (A/m)
2
Hint/M
Ce1.66Mg1.34Co9
T= 432 K
T= 452 K
[image:10.612.61.289.44.220.2]440 K
FIG. 13. Arrott plot for a Ce1.66Mg1.34Co9 single crystal within a temperature range of 432 to 452 K at steps of 2 K between adjacent curves. The Curie temperature is determined to be 440 K.
0 3 6 9 12 15
0 0.5 1.0 1.5 2.0 2.5
0 1 2 3
0 0.5 1.0 1.5
T = 300 K
2 K 50 K 100 K 150 K 200 K 250 K 300 K Ce1.66Mg1.34Co9
0
H/M
(10
−
5 T m
/A)
M2(1010A2/m2)
T=2 K,50 K H⊥ [001]
0
H/M
M2
T= 300 K
[image:10.612.329.547.433.609.2]T = 400 K
FIG. 15. Sucksmith-Thompson plot for Ce1.66Mg1.34Co9 to
obtain anisotropy constants K1 and K2. The field-dependent
magnetization data are measured up to 7 T along the hard axis of magnetization. The dotted straight lines are the linear fits to
½ðμ0HÞ/Mat high-field magnetization data to obtain the inter-cepts and slopes of the isotherms. (Inset) Sucksmith-Thompson plots for VSM data measured along the hard axis (H⊥½001) up to the 3-T field.K1 and K2, obtained using the VSM data, are
[image:10.612.71.282.509.686.2]constant K2. Figure 16 shows the temperature variation
of the measured anisotropy constants. There is a slight mismatch (<2%) in the anisotropy data above and below the 300-K value obtained from the VSM and MPMS data. The VSM data are scaled to the MPMS data at 300 K since the slope of the Sucksmith-Thompson plot is better determined with a higher applied field. Here, the total anisotropy energy of Ce1.66Mg1.34Co9is determined to be 2.2MJ/m3. Such high anisotropy energy density makes
Ce1.66Mg1.34Co9 a potential candidate for
permanent-magnet applications.
V. CONCLUSIONS
In this paper, we investigate the effect of Mg sub-stitution into the Ce3Co9(e.g., CeCo3) binary phase where Mg partially replaces the Ce atom on the 6c crystallo-graphic site, giving rise to the Ce3−xMgxCo9solid solution for 0≤x≲1.4. The substituted Mg induces ferromag-netism; the Curie temperature of the solid solution increases with a higher content of Mg and becomes maximal (450 K) at Mg content x¼1.35. The magnetic anisotropy is determined for a self-flux-grown Ce1.66Mg1.34Co9 single crystal. The uniaxial-anisotropy
field is determined to be approximately 10 T at 2 K and about 6 T at 300 K. The anisotropy energy density is determined to be2.2MJ/m3at 2 K. With these observed
magnetic properties, the Ce3−xMgxCo9solution shows the potential to be used as a permanent magnet.
ACKNOWLEDGMENTS
We would like to thank Dr. T. Kong for the useful discussions. Dr. Warren Straszheim is acknowledged for doing SEM on various samples. This research was
supported by the Critical Materials Institute, an Energy Innovation Hub funded by the U.S. Department of Energy, Office of Energy Efficiency and Renewable Energy, Advanced Manufacturing Office. Q. L. is sup-ported by the office of Basic Energy Sciences, Materials Sciences Division, U.S. DOE. This work was performed at the Ames Laboratory, operated for the DOE by Iowa State University under Contract No. DE-AC02-07CH11358.
[1] G. B. Haxel, J. B. Hedrick, and G. J. Orris, U.S. Geological Survey Fact Sheet No. 087-02, 2002.
[2] Pradyot Patnaik, Handbook of Inorganic Chemicals (McGraw-Hill, New York, 2003).
[3] Feng Xie, Ting An Zhang, David Dreisinger, and Fiona Doyle, A critical review on solvent extraction of rare earths from aqueous solutions, Miner. Eng.56, 10 (2014). [4] Arjun K. Pathak, Mahmud Khan, Karl A. Gschneidner,
Ralph W. McCallum, Lin Zhou, Kewei Sun, Kevin W. Dennis, Chen Zhou, Frederick E. Pinkerton, Matthew J. Kramer, and Vitalij K. Pecharsky, Cerium: An unlikely replacement of dysprosium in high performance NdFeB permanent magnets,Adv. Mater.27, 2663 (2015). [5] R. V. Denys, A. B. Riabov, R.Černý, I. V. Koval’chuk, and
I. Yu. Zavaliy, New CeMgCo4and Ce2MgCo9compounds: Hydrogenation properties and crystal structure of hydrides,
J. Solid State Chem.187, 1 (2012).
[6] V. V. Shtender, R. V. Denys, V. Paul-Boncour, I. Yu. Zavaliy, Yu. V. Verbovytskyy, and D. D. Taylor, Crystal structure, hydrogen absorption-desorption behavior and magnetic properties of the Nd3−xMgxCo9 alloys, J. Alloys Compd. 695, 1426 (2017).
[7] M. I. Bartashevich, K. Koui, T. Goto, M. Yamaguchi, I. Yamamoto, and F. Sugaya, Magnetic properties of NdCo3 and itsγ-phase hydride NdCo3H4.1,J. Alloys Compd.202, 7 (1993).
[8] Paul C. Canfield and Ian R. Fisher, High-temperature solution growth of intermetallic single crystals and quasi-crystals, J. Cryst. Growth225, 155 (2001).
[9] H. Okamoto, Ce-Co phase diagram, in ASM Alloy Phase Diagrams Database, edited by P. Villars, H. Okamoto, and K. Cenzual (ASM International, Materials Park, OH, 1990). [10] A. C. Larson and R. B. Von Dreele, Los Alamos National
Laboratory Report No. LAUR 86-748, 2004.
[11] Brian H. Toby,EXPGUI, a graphical user interface for GSAS,
J. Appl. Crystallogr.34, 210 (2001).
[12] Tej N. Lamichhane, Valentin Taufour, Srinivasa Thimmaiah, David S. Parker, Sergey L. Bud’ko, and Paul C. Canfield, A study of the physical properties of single crystalline Fe5B2P,
J. Magn. Magn. Mater.401, 525 (2016).
[13] Tej N. Lamichhane, Valentin Taufour, Morgan W. Masters, David S. Parker, Udhara S. Kaluarachchi, Srinivasa Thimmaiah, Sergey L. Bud’ko, and Paul C. Canfield, Discovery of ferromagnetism with large magnetic anisotropy in ZrMnP and HfMnP, Appl. Phys. Lett. 109, 092402 (2016).
[14] A. Jesche, M. Fix, A. Kreyssig, W. R. Meier, and P. C. Canfield, X-ray diffraction on large single crystals
0 100 200 300 400
0 0.5 1.0 1.5
2.0 Ce1.66Mg1.34Co9
Ki
(MJ
/m
3 )
T(K)
K1
K2
[image:11.612.64.284.44.221.2]K1+K2
FIG. 16. Temperature dependent anisotropy energy constants for Ce1.66Mg1.34Co9. The anisotropy constants are determined from the Sucksmith-Thompson plot. K1 and K2 values up to
300 K are measured using MPMS, and higher-temperature data are measured using VSM.
Ce3−xMgxCo9: TRANSFORMATION OF A … PHYS. REV. APPLIED9, 024023 (2018)
using a powder diffractometer, Philos. Mag. 96, 2115 (2016).
[15] R. Lemaire, Magnetic properties of the intermetallic com-pounds of cobalt with the rare earth metals and yttrium, Cobalt33, 201 (1966).
[16] K. H. J. Buschow, Magnetic properties of CeCo3, Ce2Co7 and CeNi3and their ternary hydrides,J. Less-Common Met. 72, 257 (1980).
[17] W. Sucksmith and J. E. Thompson, The magnetic anisotropy of cobalt,Proc. R. Soc. A225, 362 (1954).
![FIG. 3.The crystal structure for Ce3−xMgxCo9 showing thestacking sequence of a CaCu5-type plane (A) and a MgCu2-typeplane (B) visualized along the [010] direction.](https://thumb-us.123doks.com/thumbv2/123dok_us/8122340.239763/6.612.51.559.566.716/crystal-structure-showing-thestacking-sequence-typeplane-visualized-direction.webp)
![FIG. 9.Temperature-dependent susceptibility (of a CeCo½probe measurement. The sample isH ¼ 0.1T ⊥001�) and electrical resistivity (excitation current ⊥ to [001])3 single crystal](https://thumb-us.123doks.com/thumbv2/123dok_us/8122340.239763/8.612.53.297.46.216/temperature-dependent-susceptibility-measurement-electrical-resistivity-excitation-current.webp)